
Market
Whale Activity Signals Potential Upswing

Cardano (ADA) price is currently struggling to find a clear direction. The ADX indicator shows a weakening trend, pointing to reduced momentum. This suggests that ADA is in a phase of consolidation, lacking strong bullish or bearish forces.
Whales have been accumulating ADA, hinting at potential upward movement. However, whether the price will break upwards or downwards remains uncertain as support and resistance levels come into play.
ADA ADX Shows a Weak Trend
Cardano (ADA) currently has an Average Directional Index (ADX) of 15.51, down sharply from 41 just four days ago. This decline indicates a significant weakening in ADA’s trend strength.
The ADX is a widely used technical indicator that measures the strength of a trend without indicating its direction. ADX values range from 0 to 100, with readings above 25 typically indicating a strong trend, and values below 20 suggesting a weak or nonexistent trend.
Read more: Who Is Charles Hoskinson, the Founder of Cardano?
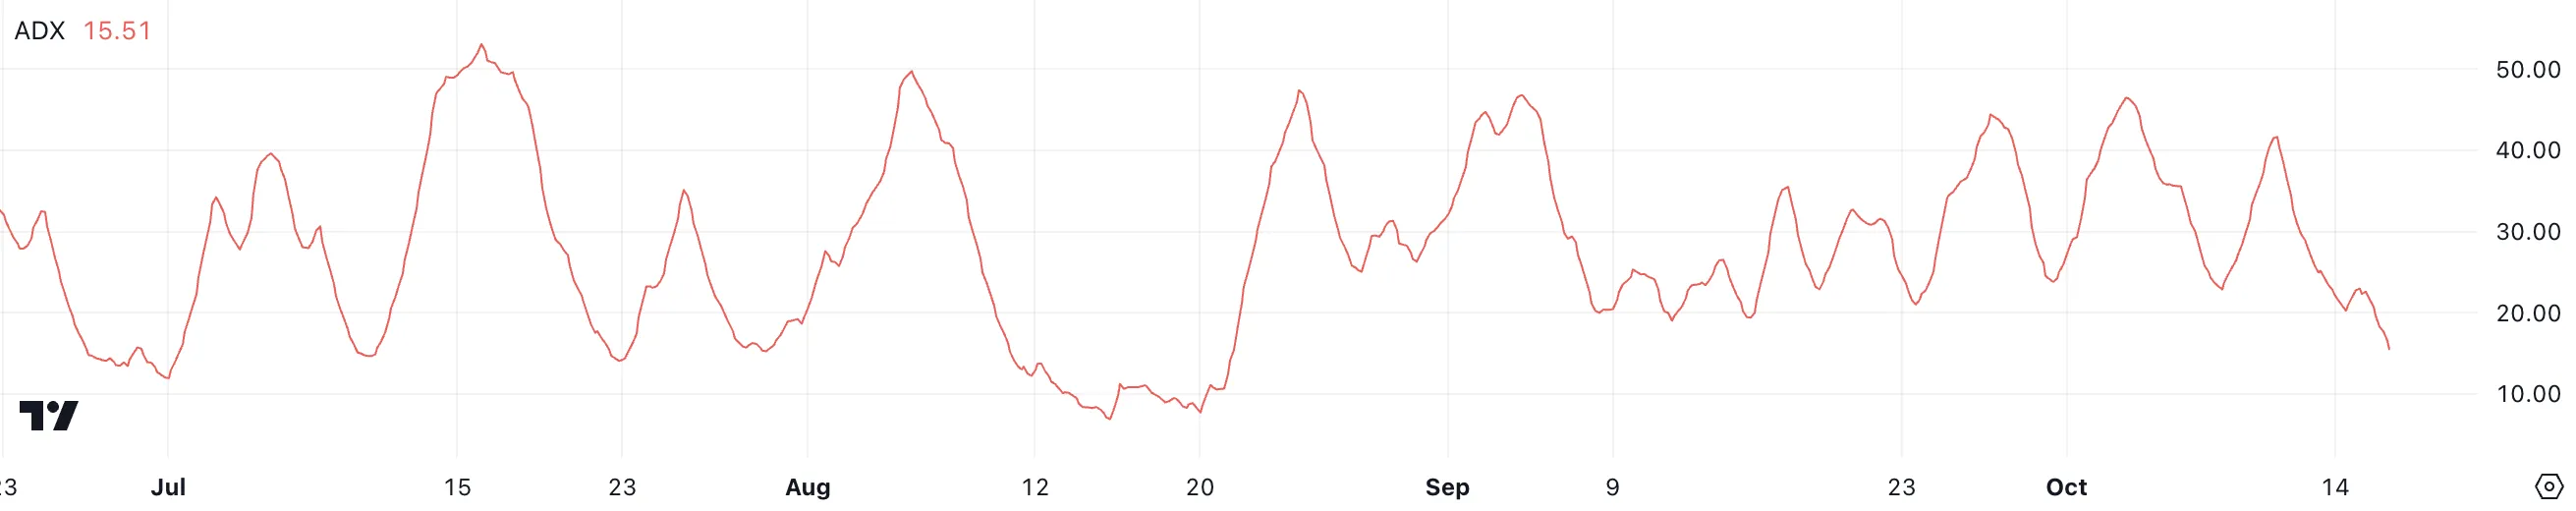
An ADX value of 41 previously suggested strong momentum, either upward or downward, signaling a decisive price movement. However, the current value of 15.51 suggests that this momentum has dwindled, pointing towards a lack of clear directional strength, with ADA now in a phase of low volatility and reduced conviction among market participants.
Cardano Whales Are Making Moves Again
In recent weeks, the number of ADA addresses holding between 1 million and 10 million ADA remained relatively stable throughout mid-September until October 7. Similarly, addresses holding between 10 million and 100 million ADA also showed a steady trend since the end of September, following a sharp decline between September 18 and 19.
However, from October 12 to October 15, the number of addresses holding between 1 million and 10 million ADA grew from 2,450 to 2,462, suggesting renewed interest from smaller whales while the larger whale cohort remains steady. These subtle shifts in holdings can provide valuable insights into potential market trends.
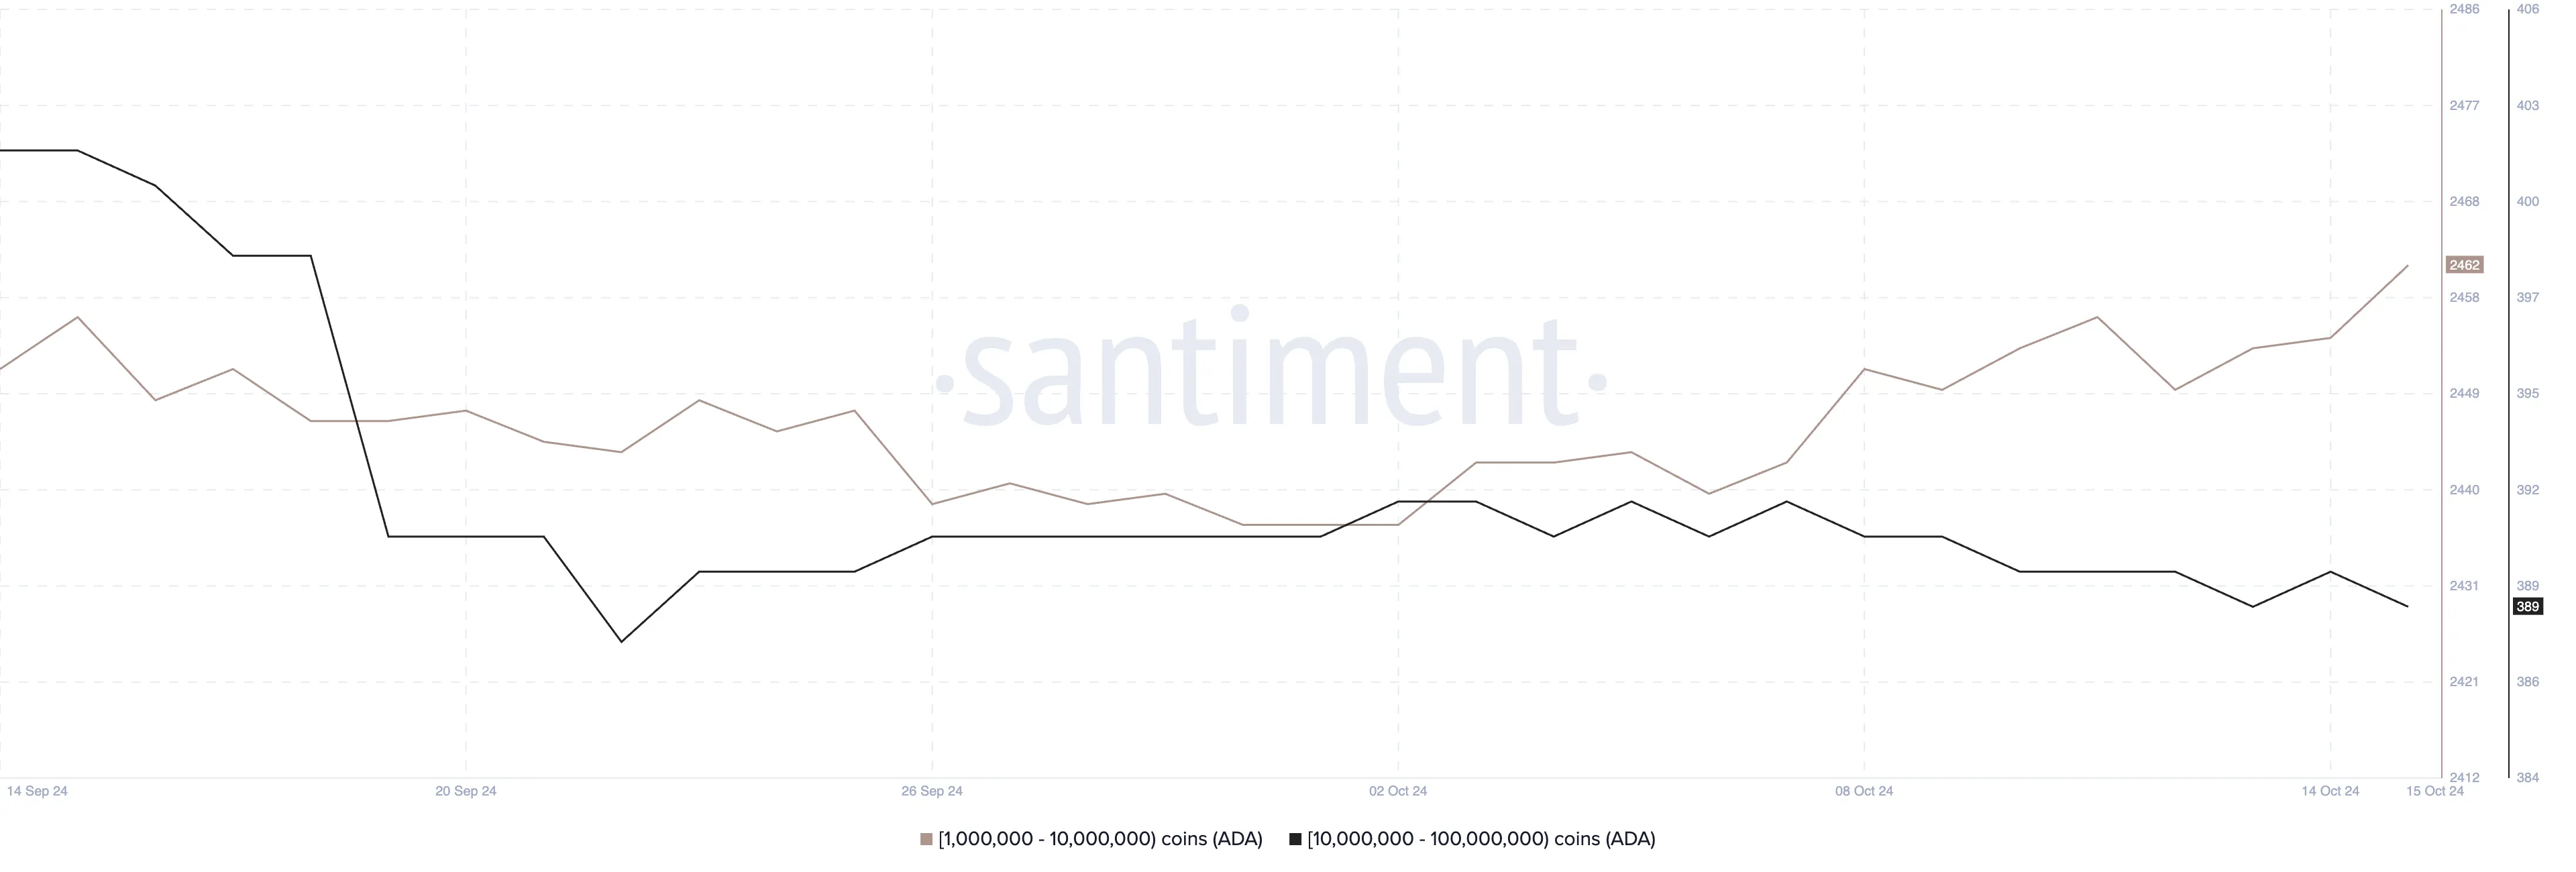
Tracking the behavior of these whales — specifically, those holding millions of ADA — is crucial as they wield substantial influence over the market. When whales accumulate or divest their holdings, it often correlates with upcoming price movements due to their potential to impact liquidity and market sentiment.
Although the current trend is not particularly strong, and the direction of ADA’s price remains uncertain, the recent accumulation by addresses holding between 1 million and 10 million ADA could be viewed as a potential bullish signal.
Such accumulation during a period of low trend strength could indicate that larger players are positioning themselves for a future upward movement in ADA’s price, hinting at optimism for positive momentum in the coming days.
ADA Price Prediction: Can It Jump 17% In The Next Few Days?
ADA EMA (Exponential Moving Average) lines are currently very close together, indicating that there is no clear trend direction at the moment. This often suggests that ADA’s price is in a consolidation phase, where the market lacks strong bullish or bearish momentum.
EMA lines are moving averages that place greater weight on more recent price data, making them more responsive to short-term price movements compared to a simple moving average.
When EMA lines converge and move tightly in sync, it typically implies that neither buyers nor sellers are dominating, resulting in a period of sideway movement, where the price fluctuates within a narrow range without breaking out in either direction.
Read more: How To Buy Cardano (ADA) and Everything You Need To Know
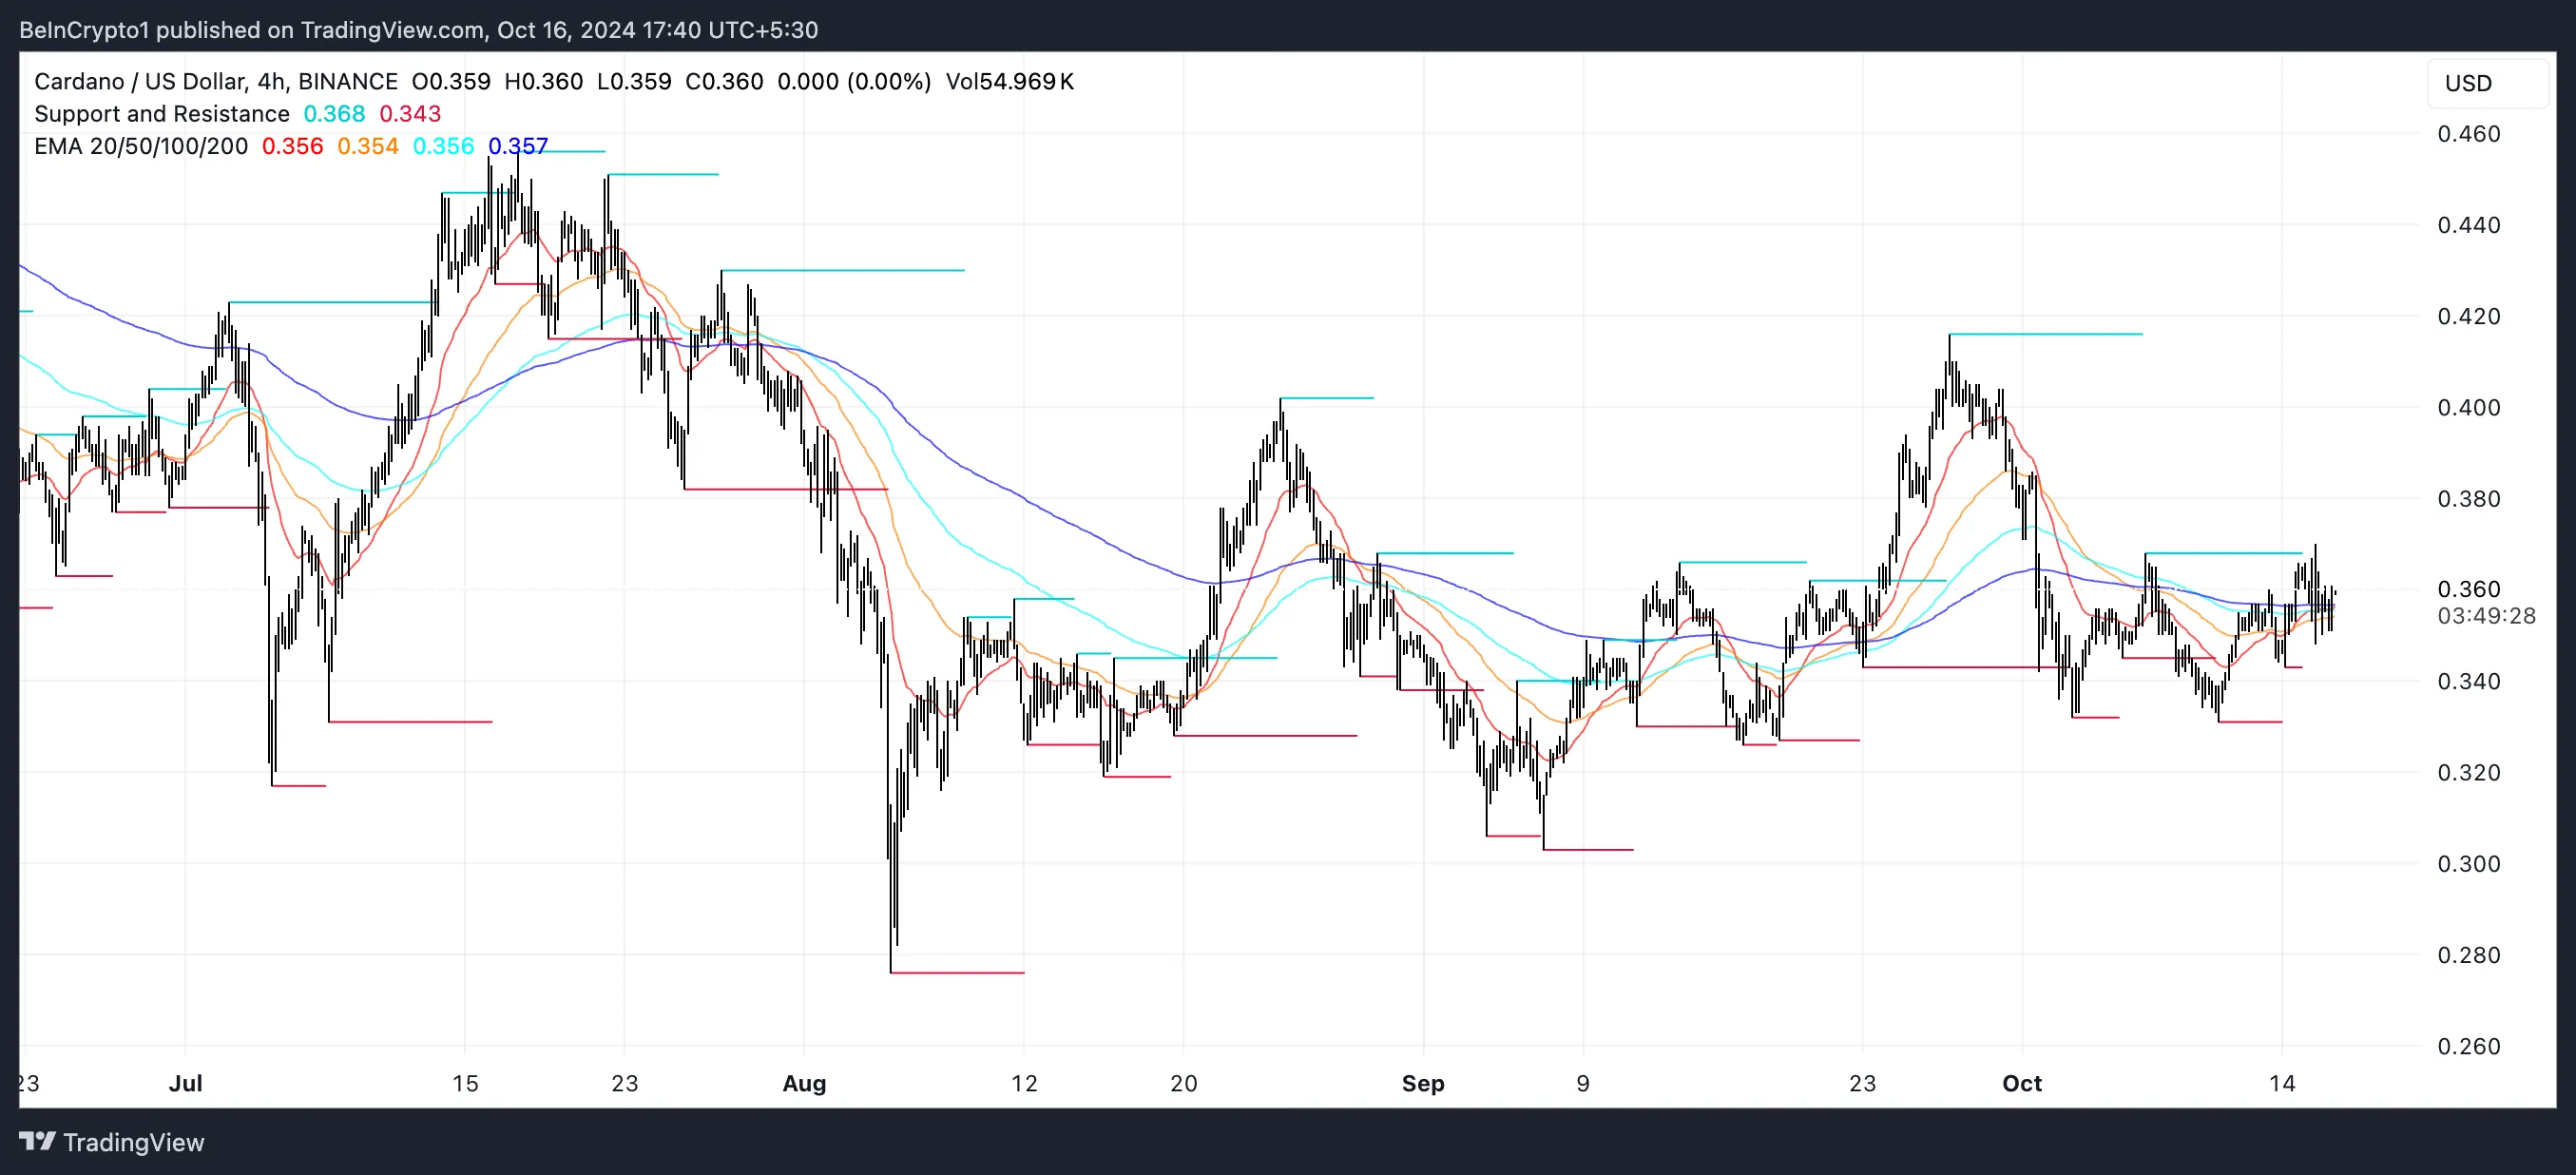
Despite this consolidation phase, the recent increase in whale accumulation, as observed in the number of large ADA addresses, suggests that a potential uptrend may be on the horizon. If an upward movement emerges, ADA may test resistance levels at $0.40 and $0.416, presenting an opportunity for approximately 17% growth from its current levels.
However, if a downtrend takes hold instead, ADA’s price could fall to support levels around $0.328 or even $0.303, suggesting a risk of further price depreciation if selling pressure intensifies.
Disclaimer
In line with the Trust Project guidelines, this price analysis article is for informational purposes only and should not be considered financial or investment advice. BeInCrypto is committed to accurate, unbiased reporting, but market conditions are subject to change without notice. Always conduct your own research and consult with a professional before making any financial decisions. Please note that our Terms and Conditions, Privacy Policy, and Disclaimers have been updated.


Aayush Jindal, a luminary in the world of financial markets, whose expertise spans over 15 illustrious years in the realms of Forex and cryptocurrency trading. Renowned for his unparalleled proficiency in providing technical analysis, Aayush is a trusted advisor and senior market expert to investors worldwide, guiding them through the intricate landscapes of modern finance with his keen insights and astute chart analysis.
From a young age, Aayush exhibited a natural aptitude for deciphering complex systems and unraveling patterns. Fueled by an insatiable curiosity for understanding market dynamics, he embarked on a journey that would lead him to become one of the foremost authorities in the fields of Forex and crypto trading. With a meticulous eye for detail and an unwavering commitment to excellence, Aayush honed his craft over the years, mastering the art of technical analysis and chart interpretation.
As a software engineer, Aayush harnesses the power of technology to optimize trading strategies and develop innovative solutions for navigating the volatile waters of financial markets. His background in software engineering has equipped him with a unique skill set, enabling him to leverage cutting-edge tools and algorithms to gain a competitive edge in an ever-evolving landscape.
In addition to his roles in finance and technology, Aayush serves as the director of a prestigious IT company, where he spearheads initiatives aimed at driving digital innovation and transformation. Under his visionary leadership, the company has flourished, cementing its position as a leader in the tech industry and paving the way for groundbreaking advancements in software development and IT solutions.
Despite his demanding professional commitments, Aayush is a firm believer in the importance of work-life balance. An avid traveler and adventurer, he finds solace in exploring new destinations, immersing himself in different cultures, and forging lasting memories along the way. Whether he’s trekking through the Himalayas, diving in the azure waters of the Maldives, or experiencing the vibrant energy of bustling metropolises, Aayush embraces every opportunity to broaden his horizons and create unforgettable experiences.
Aayush’s journey to success is marked by a relentless pursuit of excellence and a steadfast commitment to continuous learning and growth. His academic achievements are a testament to his dedication and passion for excellence, having completed his software engineering with honors and excelling in every department.
At his core, Aayush is driven by a profound passion for analyzing markets and uncovering profitable opportunities amidst volatility. Whether he’s poring over price charts, identifying key support and resistance levels, or providing insightful analysis to his clients and followers, Aayush’s unwavering dedication to his craft sets him apart as a true industry leader and a beacon of inspiration to aspiring traders around the globe.
In a world where uncertainty reigns supreme, Aayush Jindal stands as a guiding light, illuminating the path to financial success with his unparalleled expertise, unwavering integrity, and boundless enthusiasm for the markets.

Ethereum (ETH) co-founder Vitalik Buterin has proposed overhauling the blockchain’s smart contract infrastructure by replacing the Ethereum Virtual Machine (EVM) with RISC-V, a widely adopted open-source instruction set architecture.
This shift aims to address one of Ethereum’s key scaling bottlenecks by dramatically improving the efficiency and simplicity of smart contract execution.
Buterin Proposes Ditching EVM for RISC-V
The proposal was detailed in a post on the Ethereum Magicians forum. In it, Buterin suggested that smart contracts could eventually be compiled to RISC-V rather than EVM bytecode.
According to Buterin, this shift addresses long-term scalability challenges. This particularly includes keeping block production competitive and improving zero-knowledge (ZK) EVM-proof efficiency.
“It aims to greatly improve the efficiency of the Ethereum execution layer, resolving one of the primary scaling bottlenecks, and can also greatly improve the execution layer’s simplicity – in fact, it is perhaps the only way to do so,” he wrote.
Current ZK-EVM implementations spend around half of their proving cycles on EVM execution. By switching to a native RISC-V VM, Ethereum could potentially achieve up to 100x efficiency gains.
Importantly, many fundamental aspects of Ethereum’s architecture would remain unchanged, preserving continuity for developers and users. Core abstractions such as accounts, smart contract storage, ETH balances, and cross-contract calls would function exactly as they do today.
Developers would still write contracts in familiar languages like Solidity or Vyper. These would simply be compiled to RISC-V rather than EVM bytecode. Tooling and workflows would remain largely intact, ensuring a smooth transition.
Crucially, the proposal ensures backward compatibility. Existing EVM contracts will remain fully operational and interoperable with new RISC-V contracts.
Buterin outlines several potential implementation paths forward. The first would support both EVM and RISC-V smart contracts natively. The second suggests wrapping EVM contracts to run via an interpreter written in RISC-V. Thus, it would enable a full transition without breaking compatibility.
The third, more modular approach, builds on the second by formally enshrining interpreters as part of the Ethereum protocol. This would allow the EVM and the future virtual machines to be supported in a standardized way.
Buterin stated that the idea is “equally as ambitious as the beam chain effort.”
“The beam chain effort holds great promise for greatly simplifying the consensus layer of Ethereum. But for the execution layer to see similar gains, this kind of radical change may be the only viable path,” Buterin added.
For context, the Ethereum Beam Chain is a redesign of Ethereum’s consensus layer (Beacon Chain). It focuses on faster block times, faster finality, chain snarkification, and quantum resistance. The development will likely begin in 2026.
This proposal fits into Ethereum’s broader vision of modularity, simplicity, and long-term scalability. Previously, BeInCrypto reported on Buterin’s privacy-centric plans for the blockchain.
The proposal focused on integrating privacy-preserving technologies. Moreover, the Pectra upgrade is also nearing, with the launch expected on May 7.
Meanwhile, ETH continues to face market headwinds, trading at March 2023 lows. This year has been quite hard for the altcoin, as it saw a decline of 50.8%. In fact, Ethereum dominance hit a 5-year low last week.

Nonetheless, BeInCrypto data showed a slight recovery over the last 14 days. ETH rose by 6.1%. Over the past day alone, it saw modest gains of 1.7%. At the time of writing, ETH was trading at $1,639.
Disclaimer
In adherence to the Trust Project guidelines, BeInCrypto is committed to unbiased, transparent reporting. This news article aims to provide accurate, timely information. However, readers are advised to verify facts independently and consult with a professional before making any decisions based on this content. Please note that our Terms and Conditions, Privacy Policy, and Disclaimers have been updated.

Solana started a fresh increase from the $120 support zone. SOL price is now consolidating and might climb further above the $142 resistance zone.
- SOL price started a fresh increase above the $125 and $132 levels against the US Dollar.
- The price is now trading above $130 and the 100-hourly simple moving average.
- There is a connecting bullish trend line forming with support at $137 on the hourly chart of the SOL/USD pair (data source from Kraken).
- The pair could start a fresh increase if it clears the $142 resistance zone.
Solana Price Gains Over 5%
Solana price formed a base above the $120 support and started a fresh increase, like Bitcoin and Ethereum. SOL gained pace for a move above the $125 and $132 resistance levels.
The pair even spiked toward the $145 resistance zone. A high was formed at $143.06 and the price is now retreating lower. There was a move below the 23.6% Fib retracement level of the upward move from the $135 swing low to the $143 high.
Solana is now trading above $130 and the 100-hourly simple moving average. There is also a connecting bullish trend line forming with support at $137 on the hourly chart of the SOL/USD pair. The trend line is close to the 76.4% Fib retracement level of the upward move from the $135 swing low to the $143 high.

On the upside, the price is facing resistance near the $142 level. The next major resistance is near the $145 level. The main resistance could be $150. A successful close above the $150 resistance zone could set the pace for another steady increase. The next key resistance is $155. Any more gains might send the price toward the $165 level.
Pullback in SOL?
If SOL fails to rise above the $142 resistance, it could start another decline. Initial support on the downside is near the $138.50 zone. The first major support is near the $137 level and the trend line.
A break below the $137 level might send the price toward the $132 zone. If there is a close below the $132 support, the price could decline toward the $125 support in the near term.
Technical Indicators
Hourly MACD – The MACD for SOL/USD is gaining pace in the bullish zone.
Hourly Hours RSI (Relative Strength Index) – The RSI for SOL/USD is above the 50 level.
Major Support Levels – $137 and $132.
Major Resistance Levels – $142 and $145.

Solana, Bitcoin in Texas, and Initia

XRP Bulls Defend $2.00—Is a Fresh Price Surge Loading?

Vitalik Buterin Proposes to Replace EVM with RISC-V
US Economic Indicators to Watch & Potential Impact on Bitcoin

Solana Rallies Past Bitcoin—Momentum Tilts In Favor of SOL

Expert Says Solana Price To $2,000 Is Within Reach, Here’s How

2.52 Million Altcoins Are Ruining Crypto’s Future

Animoca Brands Valuation Tanks 75% In Two Years, Here’s Why

Crypto exchange BingX hacked for $43 million

Are The Big Players Losing Interest?

Hong Kong’s Securities Association Tips Authorities On Crypto Self-Regulation

Coinbase cbBTC Set to go Live on Solana
2.52 Million Altcoins Are Ruining Crypto’s Future
Animoca Brands Valuation Tanks 75% In Two Years, Here’s Why
Crypto exchange BingX hacked for $43 million
Are The Big Players Losing Interest?
Hong Kong’s Securities Association Tips Authorities On Crypto Self-Regulation
Coinbase cbBTC Set to go Live on Solana
-
 Market16 hours ago
1 Year After Bitcoin Halving: What’s Different This Time?
-

 Ethereum23 hours ago
Ethereum Consolidates In Symmetrical Triangle: Expert Predicts 17% Price Move
-

 Market22 hours ago
Today’s $1K XRP Bag May Become Tomorrow’s Jackpot, Crypto Founder Says
-

 Market20 hours ago
MELANIA Crashes to All-Time Low Amid Insiders Continued Sales
-

 Market21 hours ago
Charles Schwab Plans Spot Crypto Trading Rollout in 2026
-

 Market17 hours ago
VOXEL Climbs 200% After Suspected Bitget Bot Glitch
-

 Ethereum22 hours ago
Ethereum Enters Historic Buy Zone As Price Dips Below Key Level – Insights
-

 Market18 hours ago
How Token Launch Frenzy Is Delaying 2025 Altcoin Season