
Market
Weekly Price Analysis: Crypto Prices Reel from Risk Off Sentiments


- The crypto market trended lower last week as US tariffs rocked the market, causing investors to flee to safe-haven assets like Gold.
- Crypto prices which recovered slightly on Monday and Tuesday continued trending downward as uncertainty looms.
- Meanwhile, spot ETF inflows remained positive despite some days of outflows.
Bitcoin
Bitcoin’s price trended lower over the last week following President Trump’s announcement of tariffs on Canada, Mexico and China. Investors fled to safe-haven assets like Gold while risky assets, like crypto, trended lower.
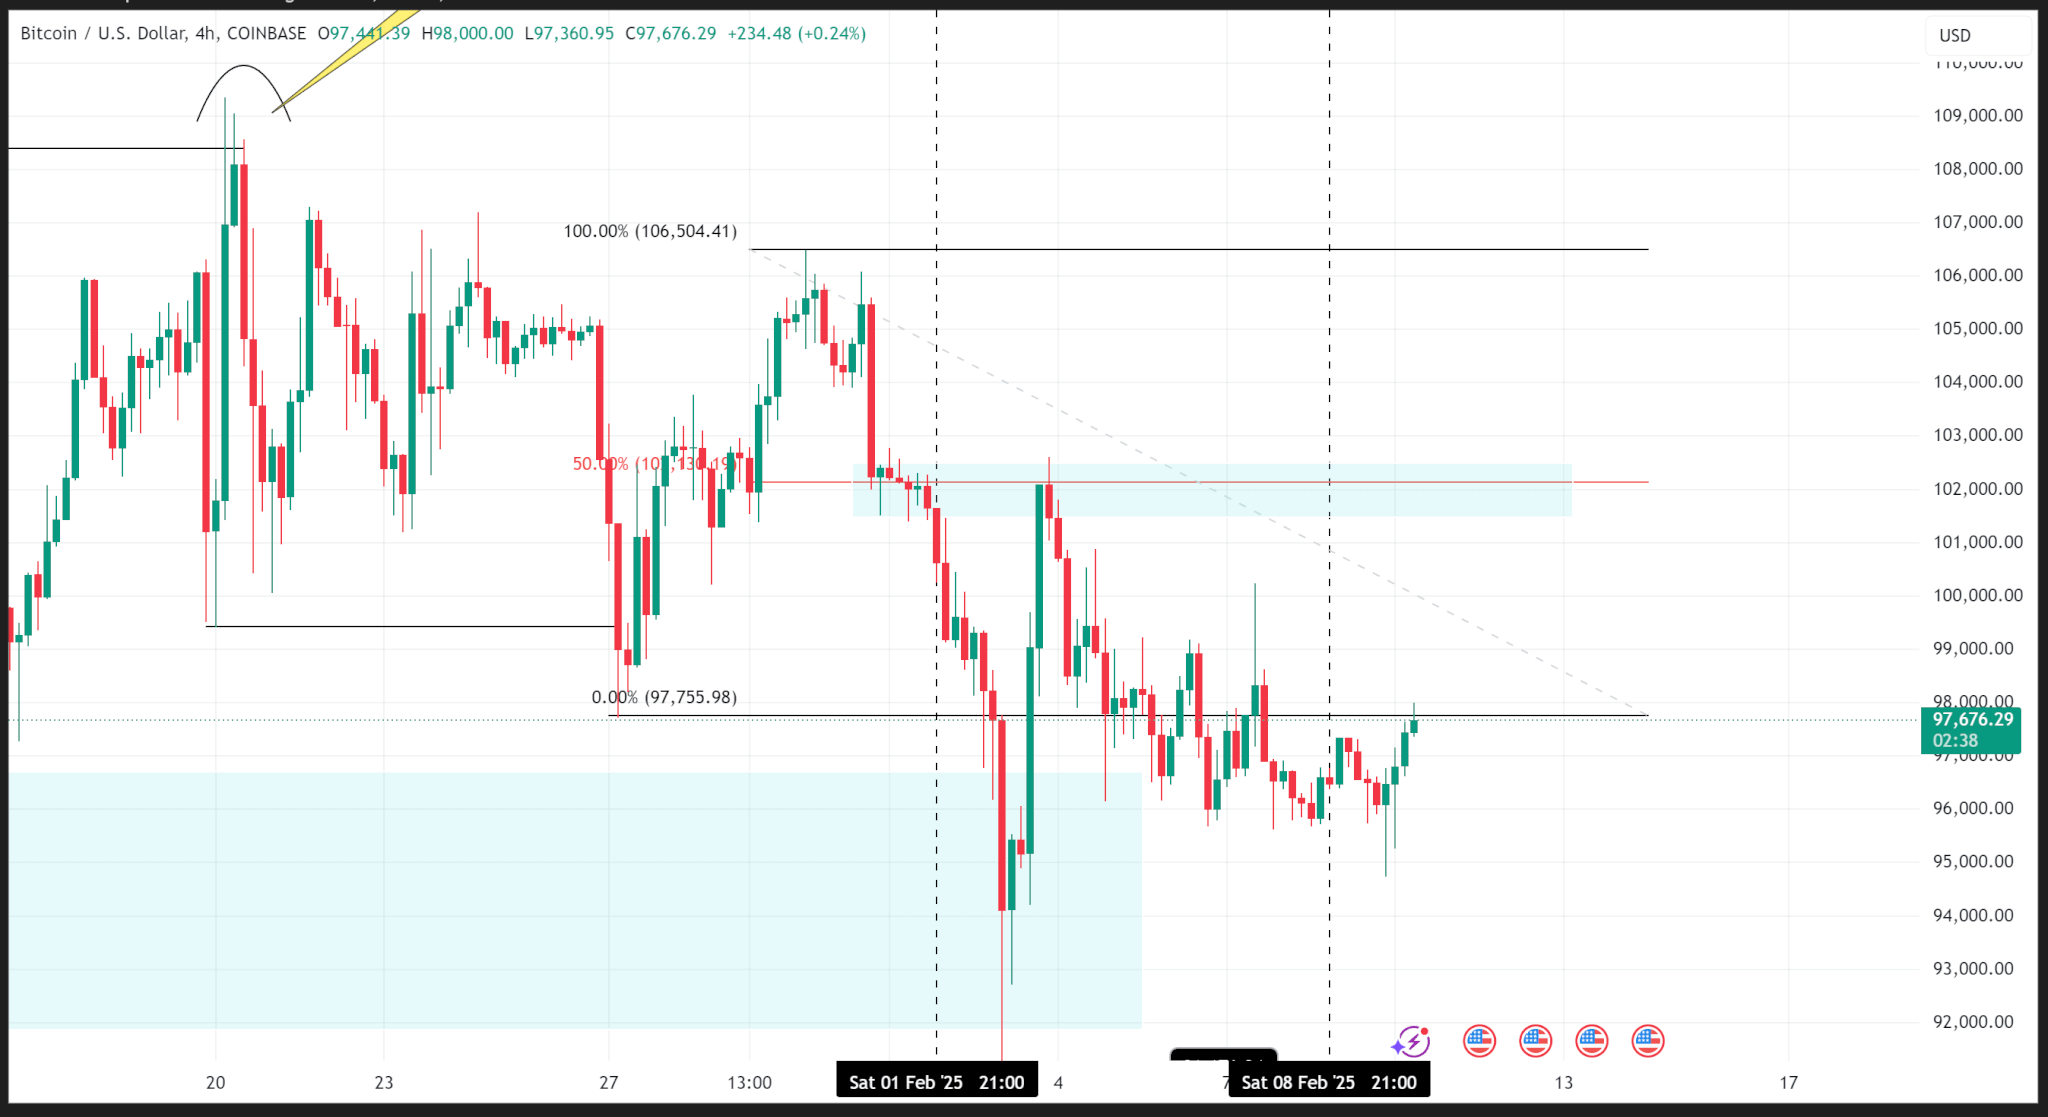
However, the tariffs are a catalyst for faster price declines as price action shows that BTC was already on a decline in its substructure after failing to swing higher than the $108,000 level three weeks ago.
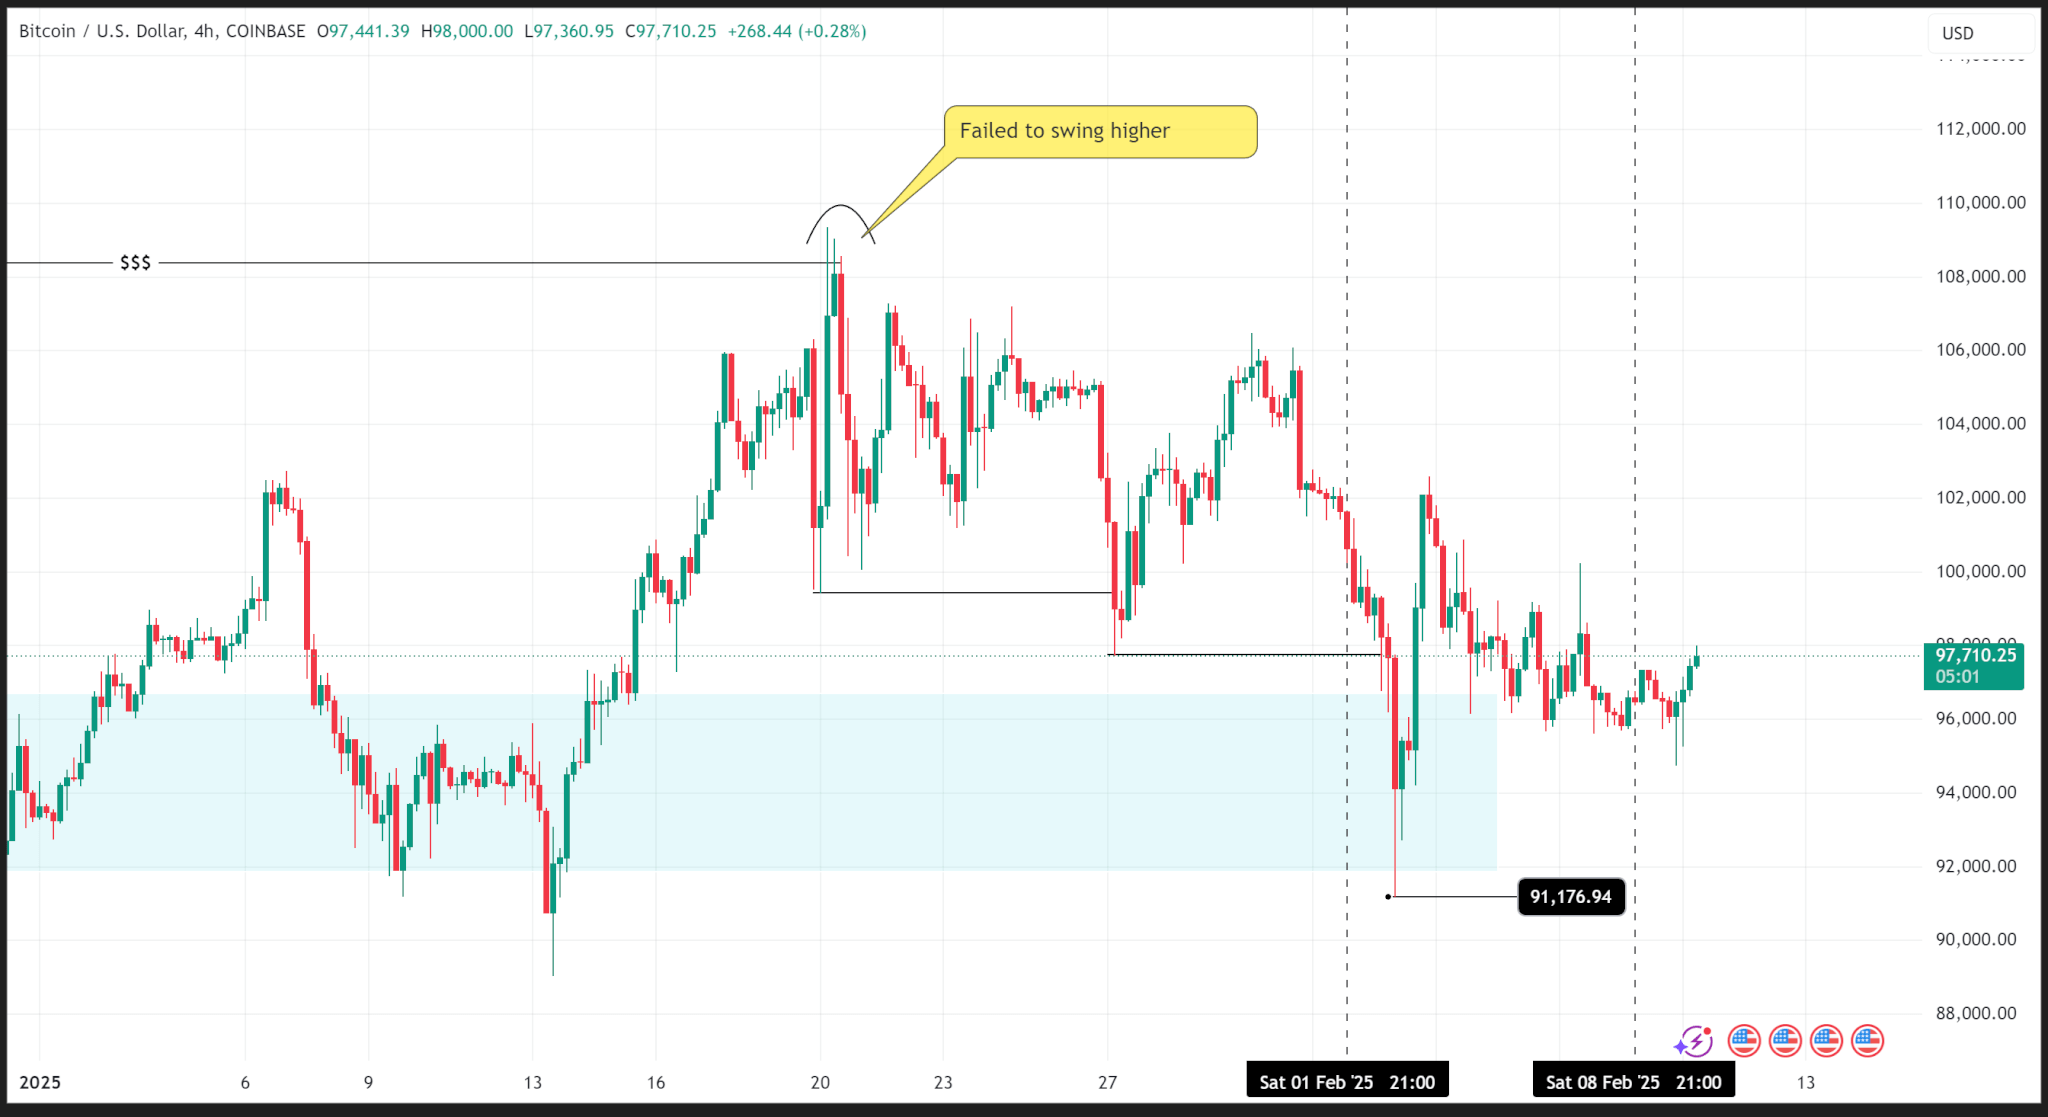
BTC made two consecutive lower lows on the substructure over the last two weeks and traded into the daily demand zone early last week, logging a weekly low of $91,176.94.
After buying from the demand zone, the price rose to an internal supply zone at $102,000, validated by the 50% Fibonacci level, and sold off that zone to end the week at $96,475.03.
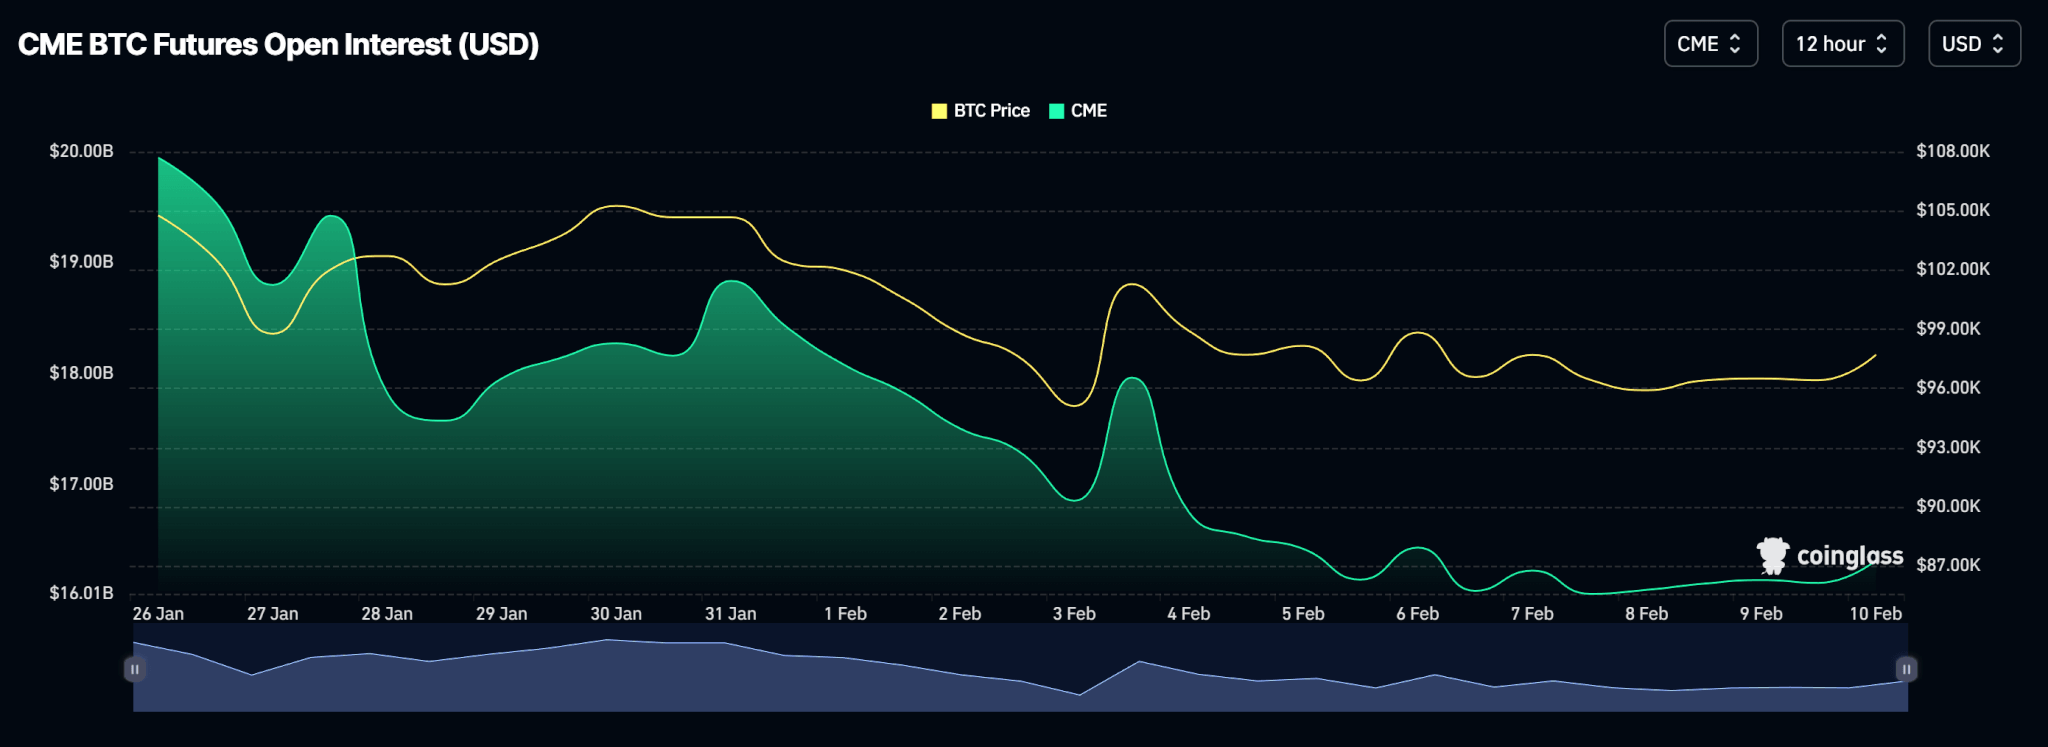
On the CME, where Bitcoin Futures are traded the most, open interest fell last week as traders closed contracts due to uncertainty caused by Trump’s tariffs.
Meanwhile, spot BTC ETFs logged a positive week as net flows printed $208.30Mn despite two days of major outflows.
Price Outlook
Provided the price remains above the demand zone on the daily time frame, then Bitcoin’s overall structure should remain bullish despite price declines on the substructure.
However, a daily close below the demand zone, i.e., below the $90,000 level, may trigger a sell-off to support levels around $84,000 or lower.
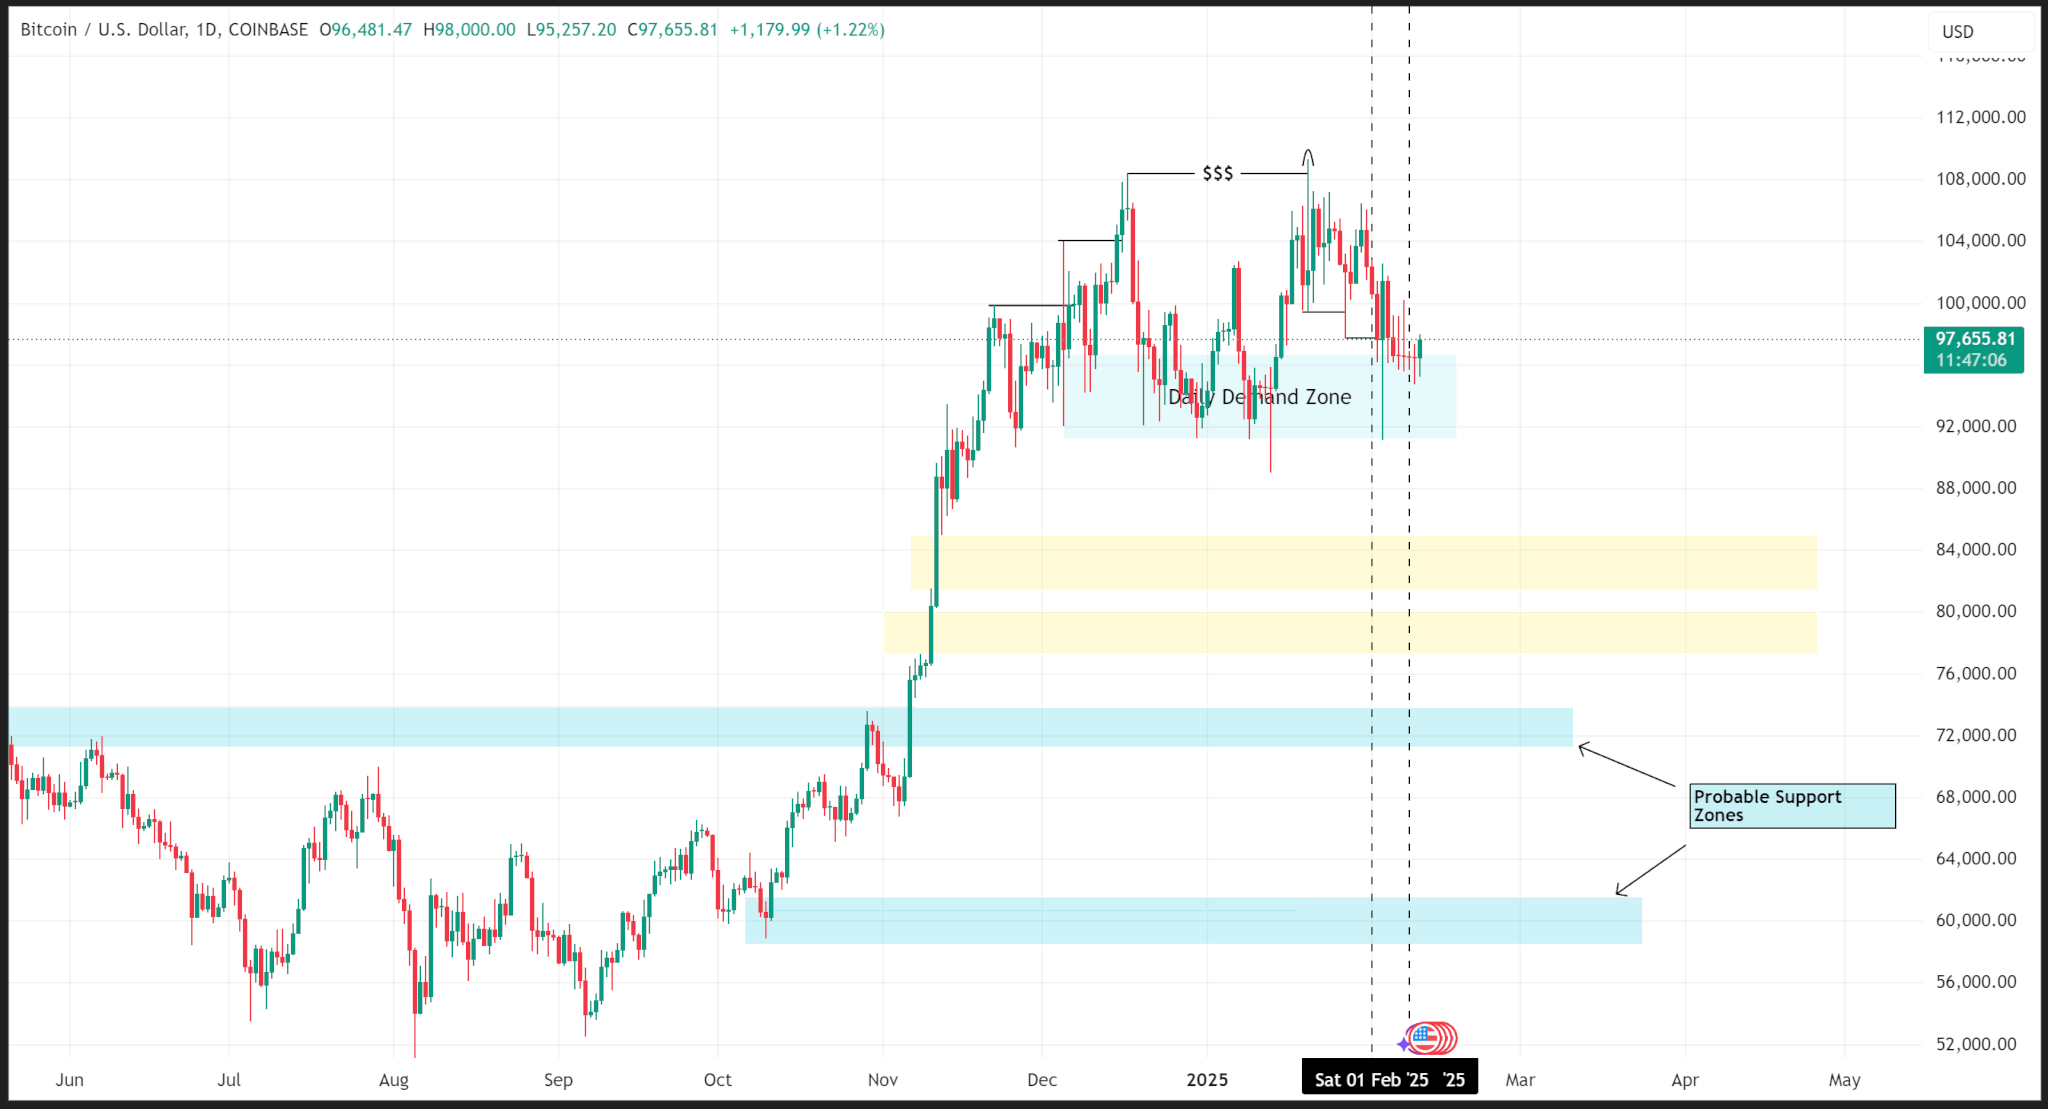
BTC trades at $97,624.73 as of publishing.
Ethereum
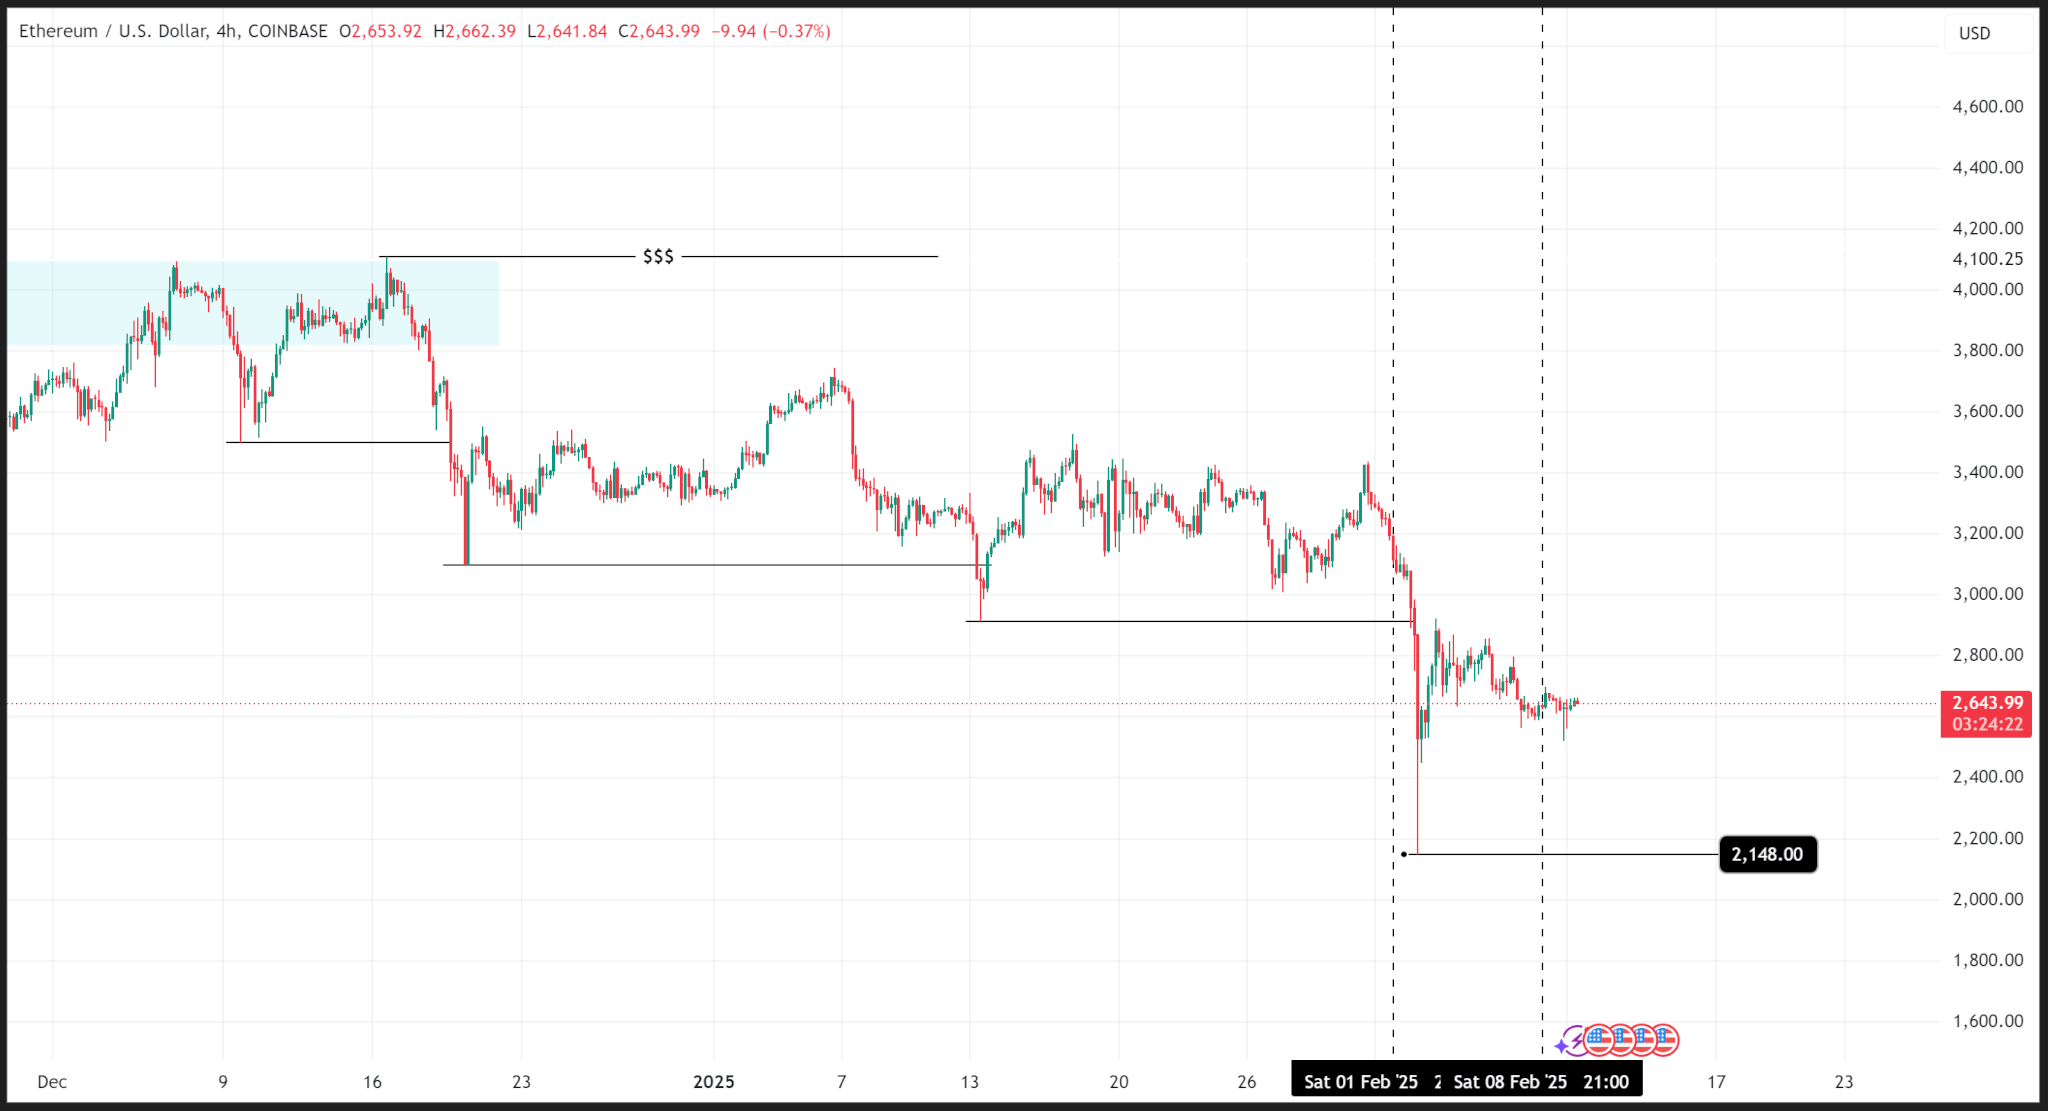
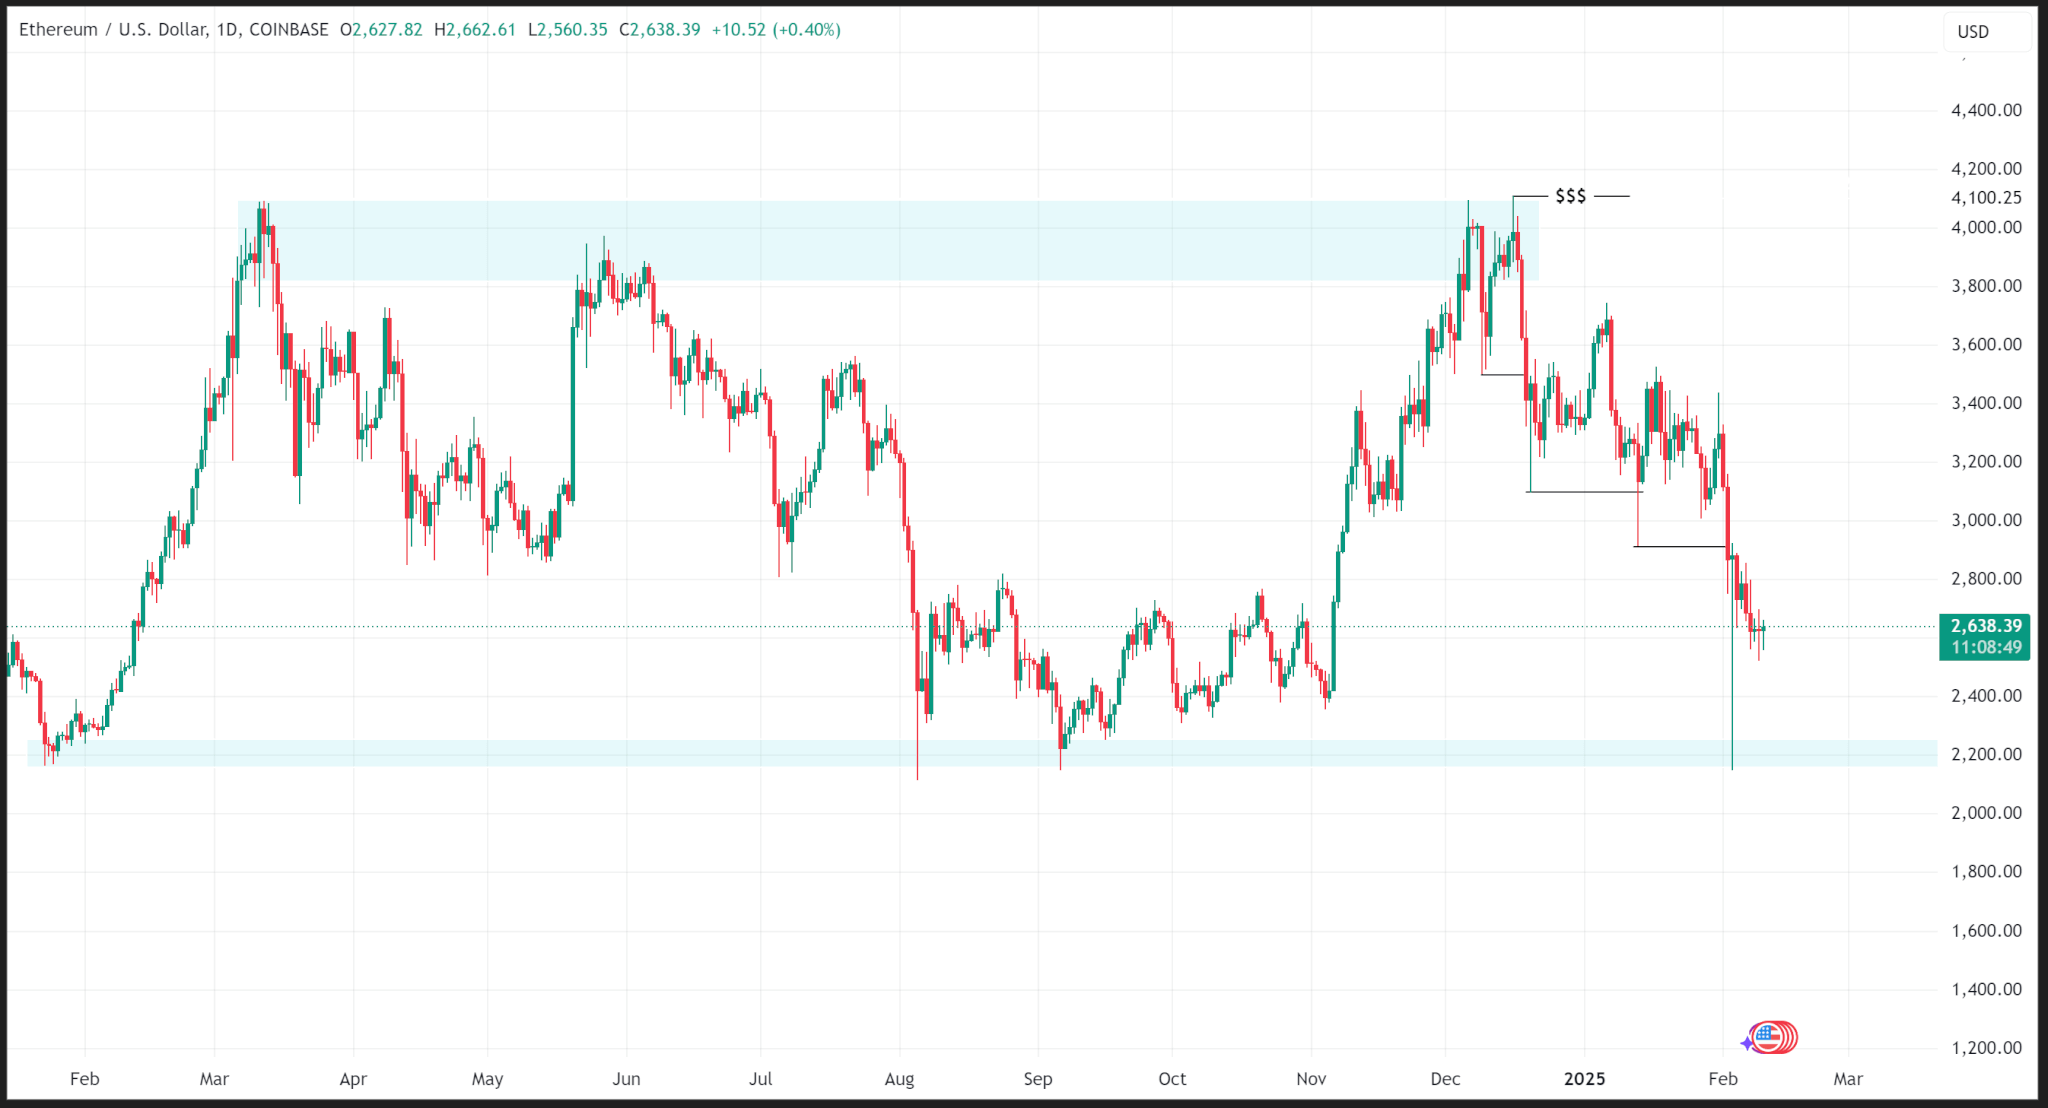
After failing to break above March 2024 highs, Ethereum’s price has been on a downtrend on its substructure since mid-December 2024.
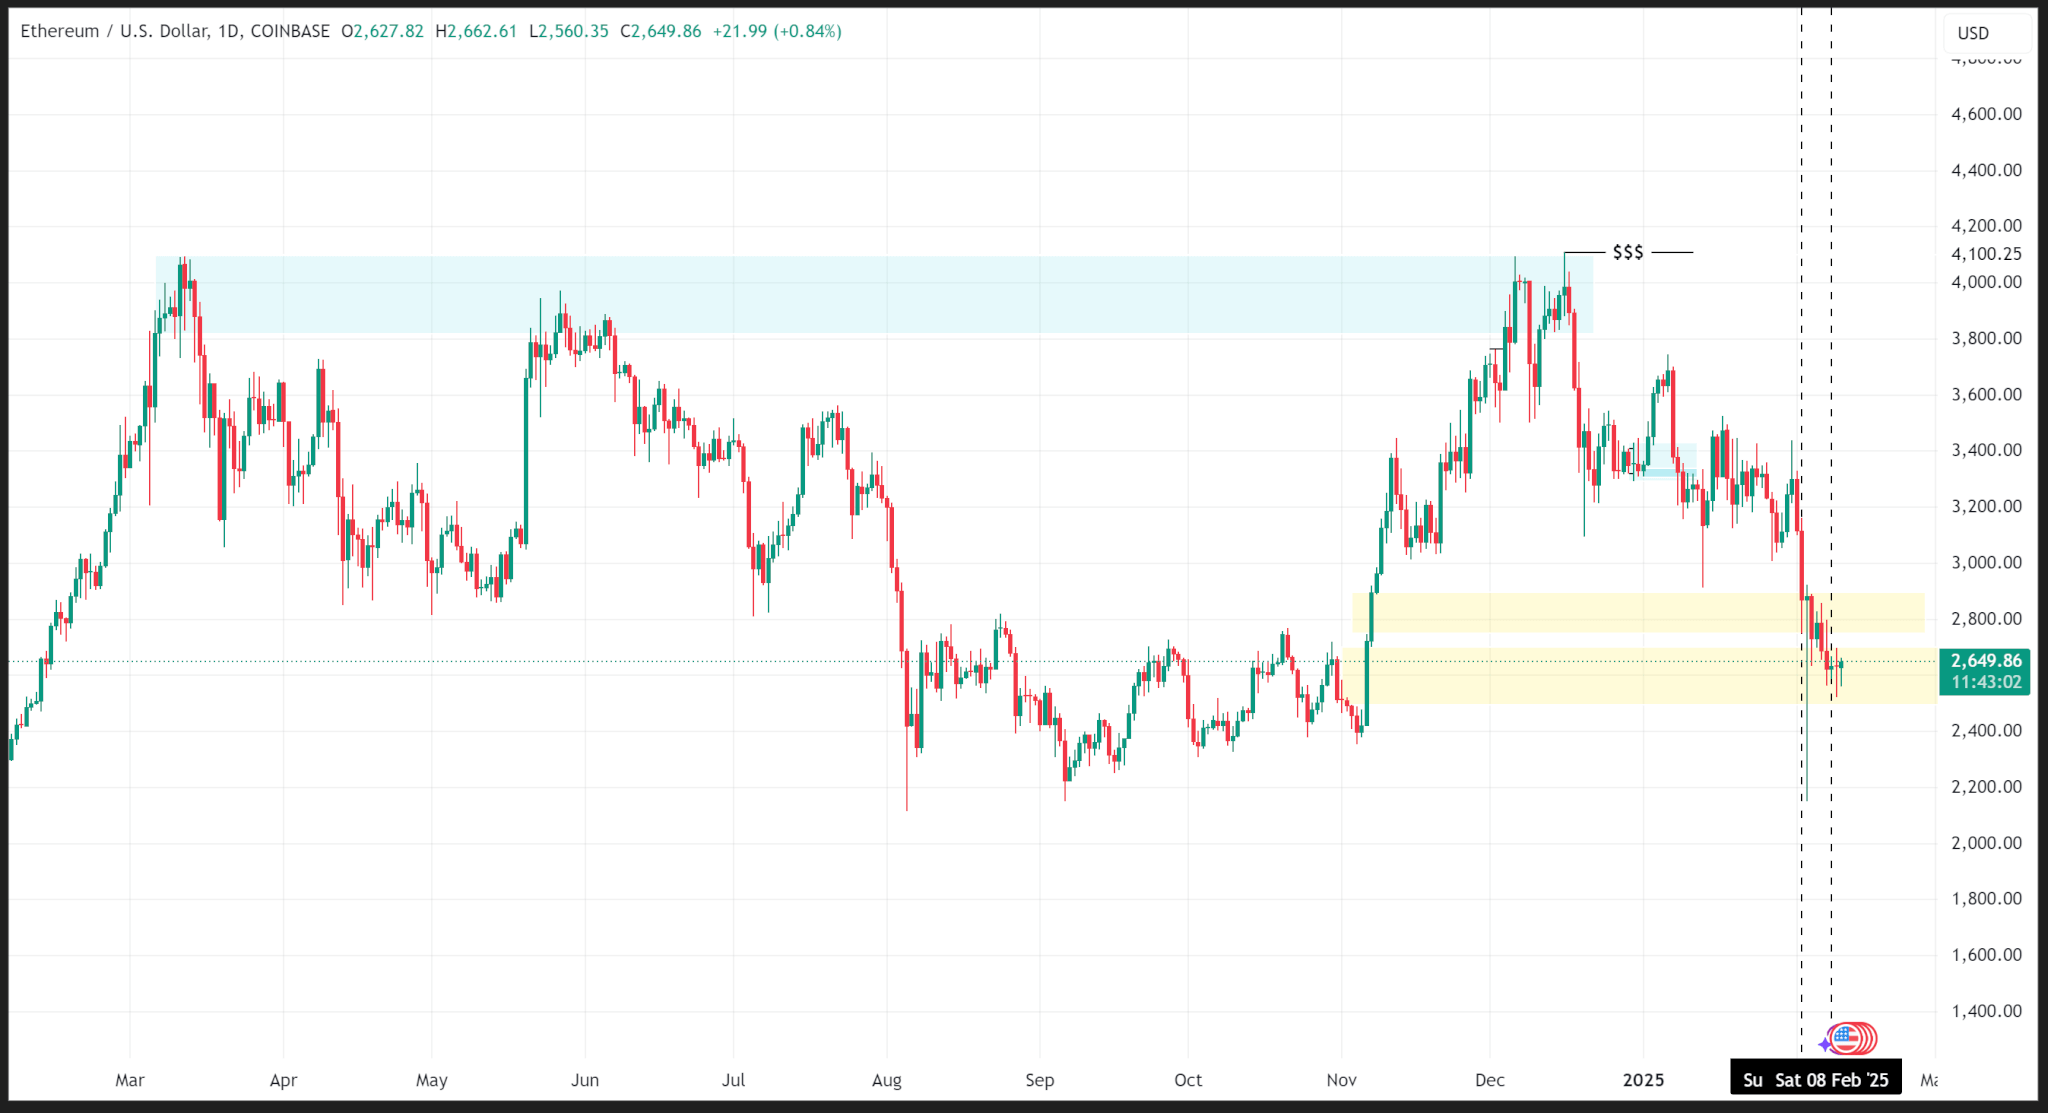
On the 4-hour time frame, the price logged consecutive lower lows with the most recent low of $2,148.00 reached early last week. Price has improved since then, closing last week at $2,632.16.
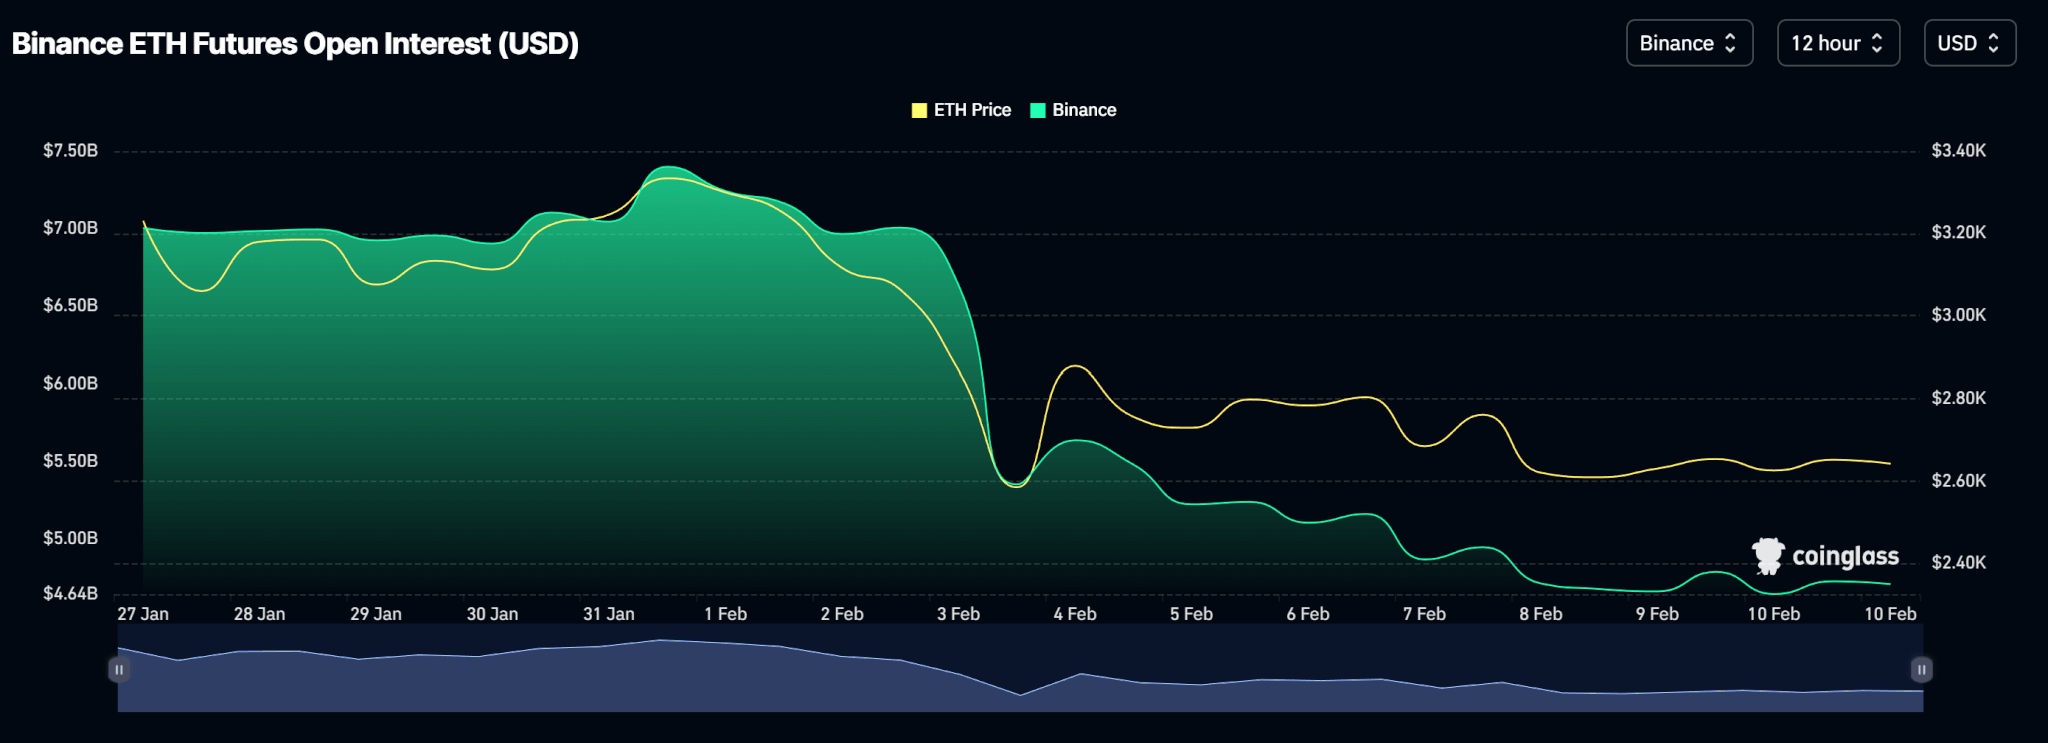
Open interest on Binance, where Ethereum Futures are traded the most, shows a decline in the number of open contracts, which could be another catalyst for price declines.
Meanwhile, spot ETH ETFs logged positive inflows on all days last week, aside from Friday when it logged no inflows (or outflows), totalling $420.20Mn for the week.
Price Outlook
The next probable zone for ETH’s price to fall is a major support zone around $2,200. With Trump planning to impose a 25% tariff on steel and Aluminum as well as a fresh round of retaliatory tariffs against trade partners, more uncertainty could push ETH’s price there soon.
ETH trades at $2,640.05 as of publishing.


Pi Network (PI) is down nearly 10% in the last 24 hours, as multiple indicators point to growing bearish momentum. The DMI shows a clear shift from an uptrend to a downtrend, while CMF data confirms increasing outflows.
EMA lines are also warning of a potential death cross, which could trigger further losses. Here’s a breakdown of what the charts are signaling for PI in the near term.
Bearish Momentum Builds as PI Network’s DMI Flips to Downtrend
Pi Network’s (PI) DMI chart reveals a clear shift in momentum, with the ADX dropping from 43.68 to 39.17 over the past two days.
The ADX, or Average Directional Index, measures the strength of a trend, with values above 25 generally indicating a strong trend.
Although the current reading still suggests solid momentum, the recent decline in ADX combined with the trend reversal from uptrend to downtrend signals that bullish strength is fading and bearish pressure is taking control.

Supporting this shift, the +DI (Directional Indicator) has dropped sharply from 22.11 to 13.29, while the -DI has surged from 11.32 to 30.95.
The +DI represents bullish strength, and the -DI represents bearish strength—so this crossover and widening gap confirm that sellers are now in control. This setup typically points to continued downside, especially if the -DI remains dominant and the ADX stabilizes or rises again, signaling a strengthening bearish trend.
Unless there’s a sharp reversal in these indicators, PI could remain under pressure in the near term.
Selling Pressure Intensifies as Outflows Accelerate on PI Network
Pi Network’s Chaikin Money Flow (CMF) has dropped sharply to -0.13, down from 0.07 just a day ago. The CMF is a volume-based indicator that measures the flow of money in and out of an asset over a set period.
It ranges from -1 to +1, with positive values indicating buying pressure and negative values suggesting selling pressure.
A sudden shift from positive to negative typically signals a change in sentiment and potential weakness ahead.

With the CMF now at -0.13, it suggests that outflows are picking up and sellers are becoming more active.
This kind of drop often reflects reduced demand and a lack of confidence from buyers, especially if it comes alongside declining prices or weakening momentum indicators.
If the CMF remains in negative territory, it could point to sustained bearish pressure and a risk of further downside for PI unless strong inflows return soon.
Will PI Fall Below $0.50?
Pi Network’s EMA lines are signaling a potential death cross, where the short-term moving average crosses below the long-term moving average.
This is typically seen as a bearish sign, often preceding further downside. If confirmed, it could lead PI to retest the support level at $0.54.
A break below that level may open the door for a move under $0.50, especially if overall momentum continues to weaken, as analysts warn about Pi Network transparency after Mantra’s OM token collapse.

However, if the trend reverses and buyers step back in, PI price could regain strength and push toward the resistance at $0.66.
A breakout above that level would be an early sign of renewed bullish momentum.
If that move holds and gains traction, the next key target would be $0.789, which could be a major test of the strength of the recovery.
Disclaimer
In line with the Trust Project guidelines, this price analysis article is for informational purposes only and should not be considered financial or investment advice. BeInCrypto is committed to accurate, unbiased reporting, but market conditions are subject to change without notice. Always conduct your own research and consult with a professional before making any financial decisions. Please note that our Terms and Conditions, Privacy Policy, and Disclaimers have been updated.
Raydium is releasing LaunchLab, a new token launchpad to compete with Pump.fun. The exchange announced this platform last month, and its full release has sparked community enthusiasm.
Pump.fun and Raydium have been locked in an intense competition in the Solana ecosystem. Last month, Pump.fun launched its own decentralized exchange, and now Raydium has introduced its own launchpad.
Raydium Increases Solana Dominance with new Launchpad
Raydium, Solana’s largest decentralized exchange, has the opportunity to make some serious gains in the near future. Solana meme coins are eyeing a comeback with heightened trade volumes and rising token prices, and the firm is releasing a long-awaited project.
Although it will compete with Pump.fun, Raydium’s launchpad services look more extensive. They will allow all kinds of tokens to be launched, not just meme coins, and these tokens can be directly traded on the exchange.
“Introducing LaunchLab, Raydium’s all-in-one token launchpad. Built for creators, developers, and the community. Get started with JustSendIt mode: launch a token, hit 85 SOL, [and] liquidity migrates to Raydium’s AMM INSTANTLY. Seamless, on-chain token creation. No migration fee. No gatekeepers,” the firm claimed in its launch announcement.
Pump.fun is the most popular meme coin launchpad on Solana, and its business has been intertwined with Raydium in a few ways. Since it launched Pumpswap, its own DEX, both exchanges have fueled a meme coin frenzy.
A month and a half ago, rumors that it was testing an AMM made Raydium’s RAY token drop significantly.
Last month, however, this same asset soared when Raydium first announced Launchpad. Pump.fun entered the DEX sector, and Raydium is enabling users to launch their own meme coins.
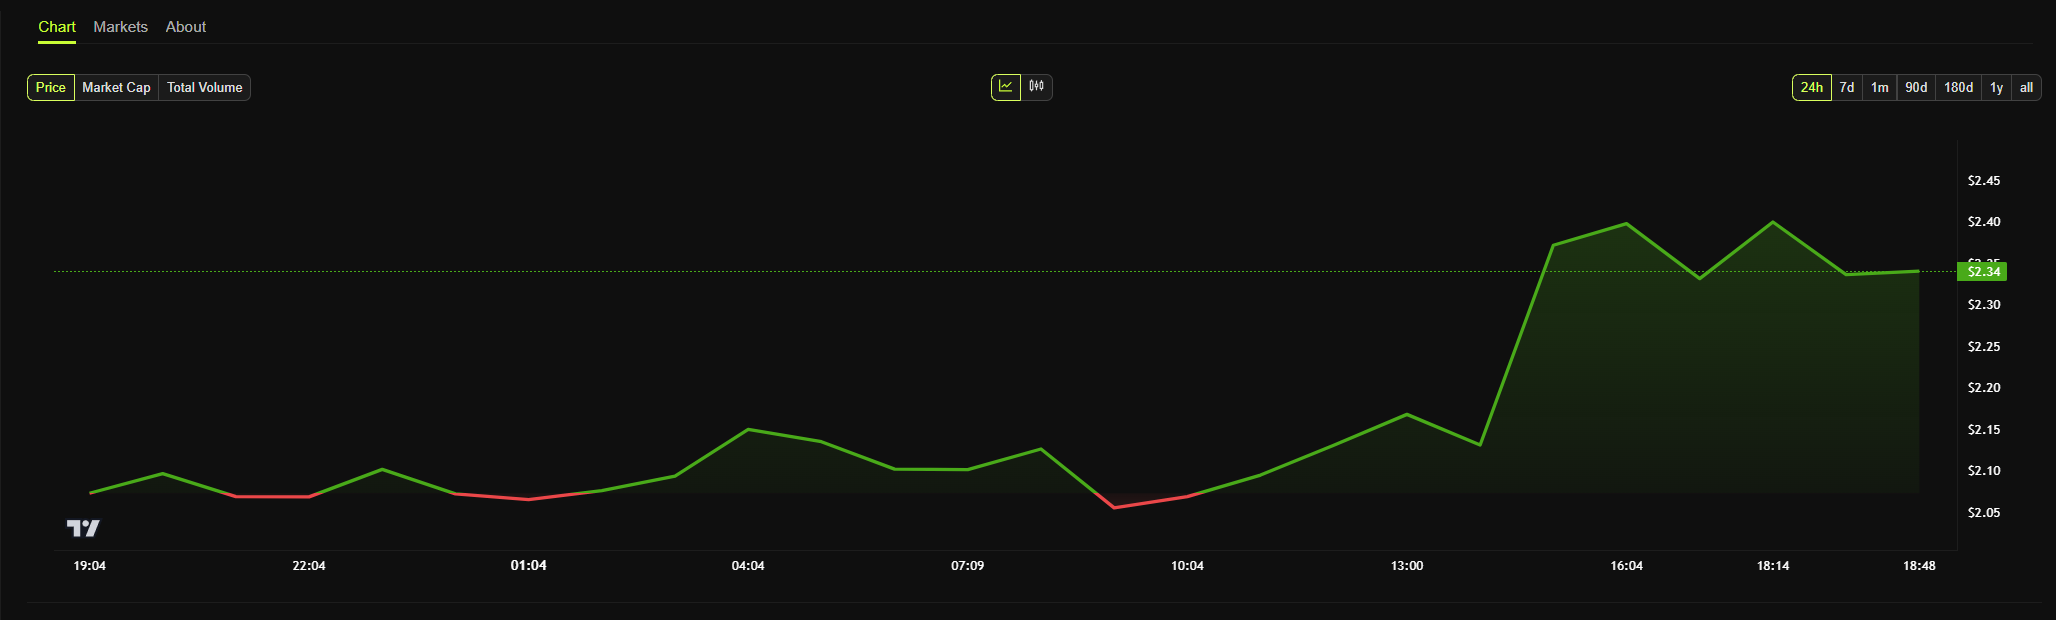
Since this launch announcement took place, RAY spiked around 10%, signifying the community’s enthusiasm.
There may be another explanation for this token rally in addition to community hype. Raydium also mentioned that all of Launchpad’s trading fees will go towards ecosystem development.
More specifically, 25% of these fees will directly fund buybacks of RAY tokens, while the other 75% go towards a Community Pool and Program fee.
These other funds can enable a few generous user incentives. Raydium claimed that Launchpad token creators can earn up to 10% of trading fees from the AMM pool post-graduation, and users can also receive SOL tokens from referring new clients. Token creators will also enjoy several other quality-of-life features.
Disclaimer
In adherence to the Trust Project guidelines, BeInCrypto is committed to unbiased, transparent reporting. This news article aims to provide accurate, timely information. However, readers are advised to verify facts independently and consult with a professional before making any decisions based on this content. Please note that our Terms and Conditions, Privacy Policy, and Disclaimers have been updated.

At the beginning of 2025, Layer-1 (L1) blockchain network Solana found itself in the spotlight, thanks to meme coins.
Donald Trump’s Official Trump (TRUMP) meme coin launch on January 17 ignited a flurry of activity across the network, driving demand to levels unseen since the 2021 bull cycle.
While these volatile assets boosted Solana’s network activity and pushed up SOL’s price, they also present a paradox. They have brought in liquidity, users, and attention—but at what cost?
Presidential Memes Pump Solana Into Overdrive
Solana’s cheap, lightning-fast transactions and highly composable DeFi infrastructure make it one of the most preferred blockchains for launching meme coins. So when newly elected Donald Trump launched his TRUMP meme coin on the network in January, it came as no surprise to many.
Following TRUMP’s launch on January 17, demand for Solana skyrocketed, driven on the one hand by developers eager to launch their own meme coins and on the other by the frenzy of trading activity surrounding them.
Melania Trump followed her husband’s lead by launching her MELANIA meme coin on the same chain two days later. This move exacerbated the meme hype and drove significant trade volumes across multiple meme coins, both existing and newly created.
For example, within a day of launch, MELANIA’s trading volume soared 396%, jumping from $1.33 billion to $6.6 billion, according to CoinGecko data.
Solana Memes Took It to the Moon, Then Back Down
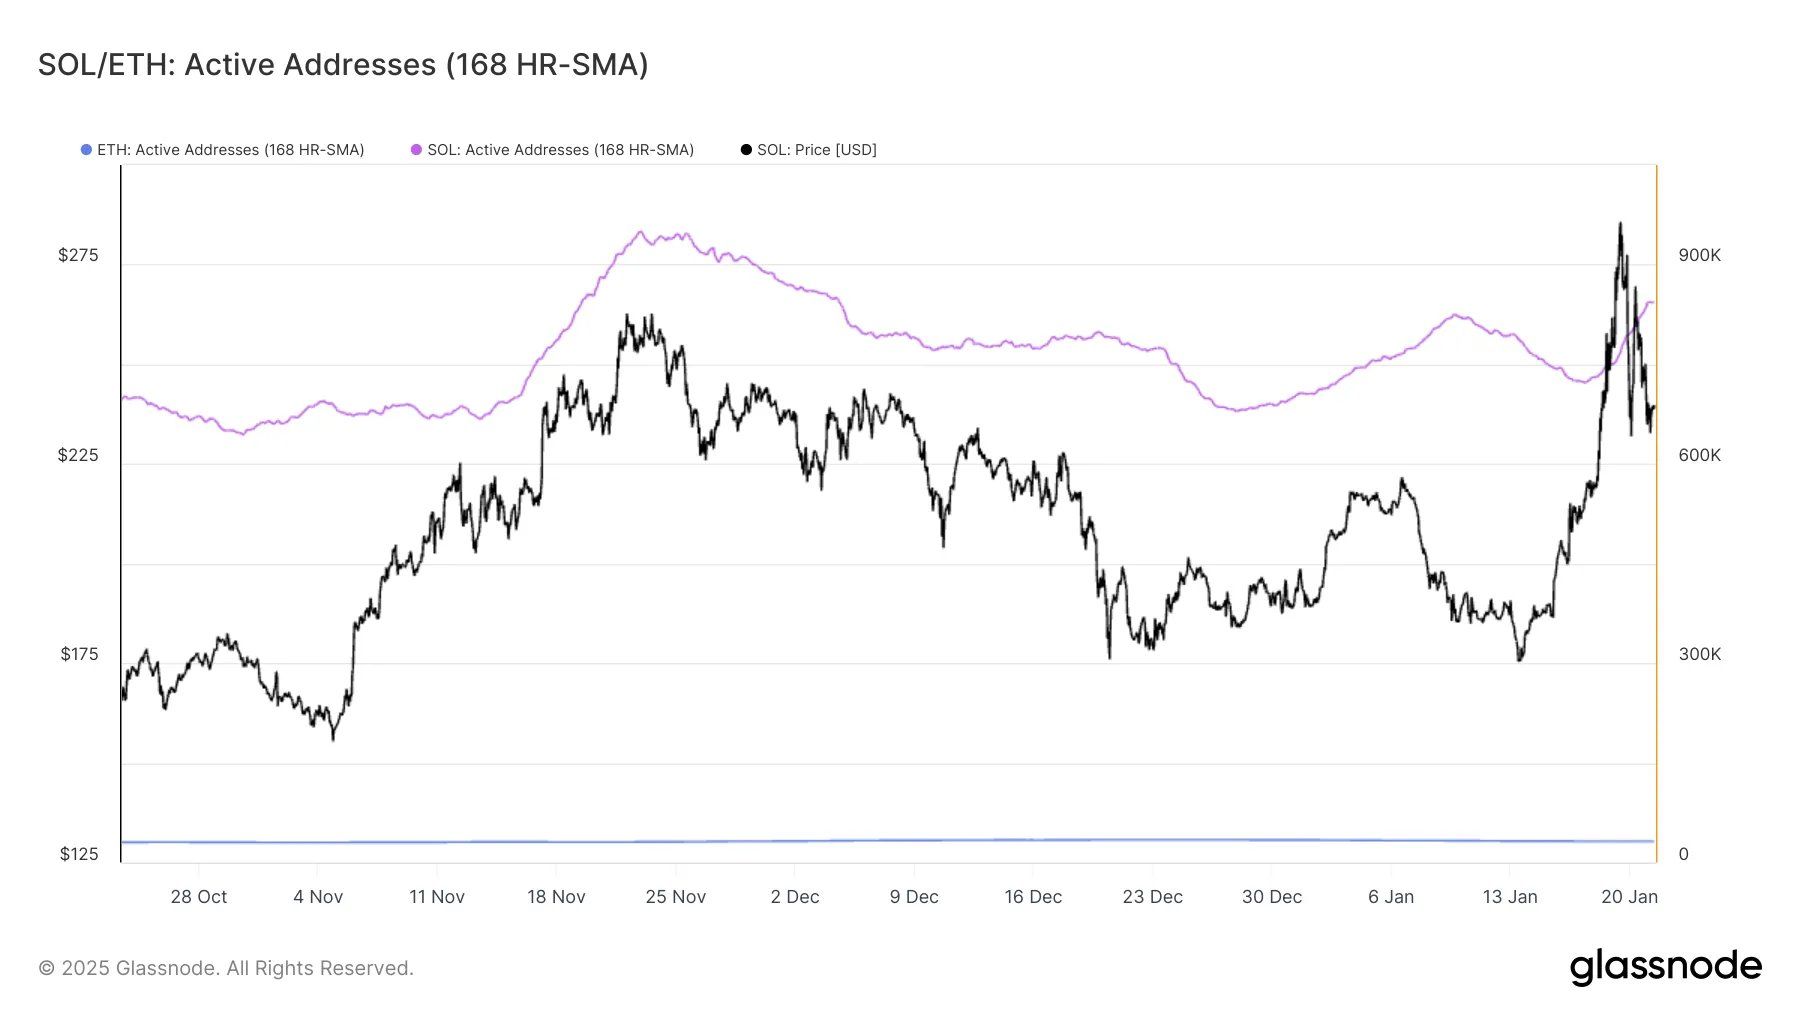
This development drove significant user engagement on Solana. According to Glassnode, by January 24, the network was processing 832,000 active addresses per hour, over 26 times more than Ethereum, which recorded just 31,000 per hour.
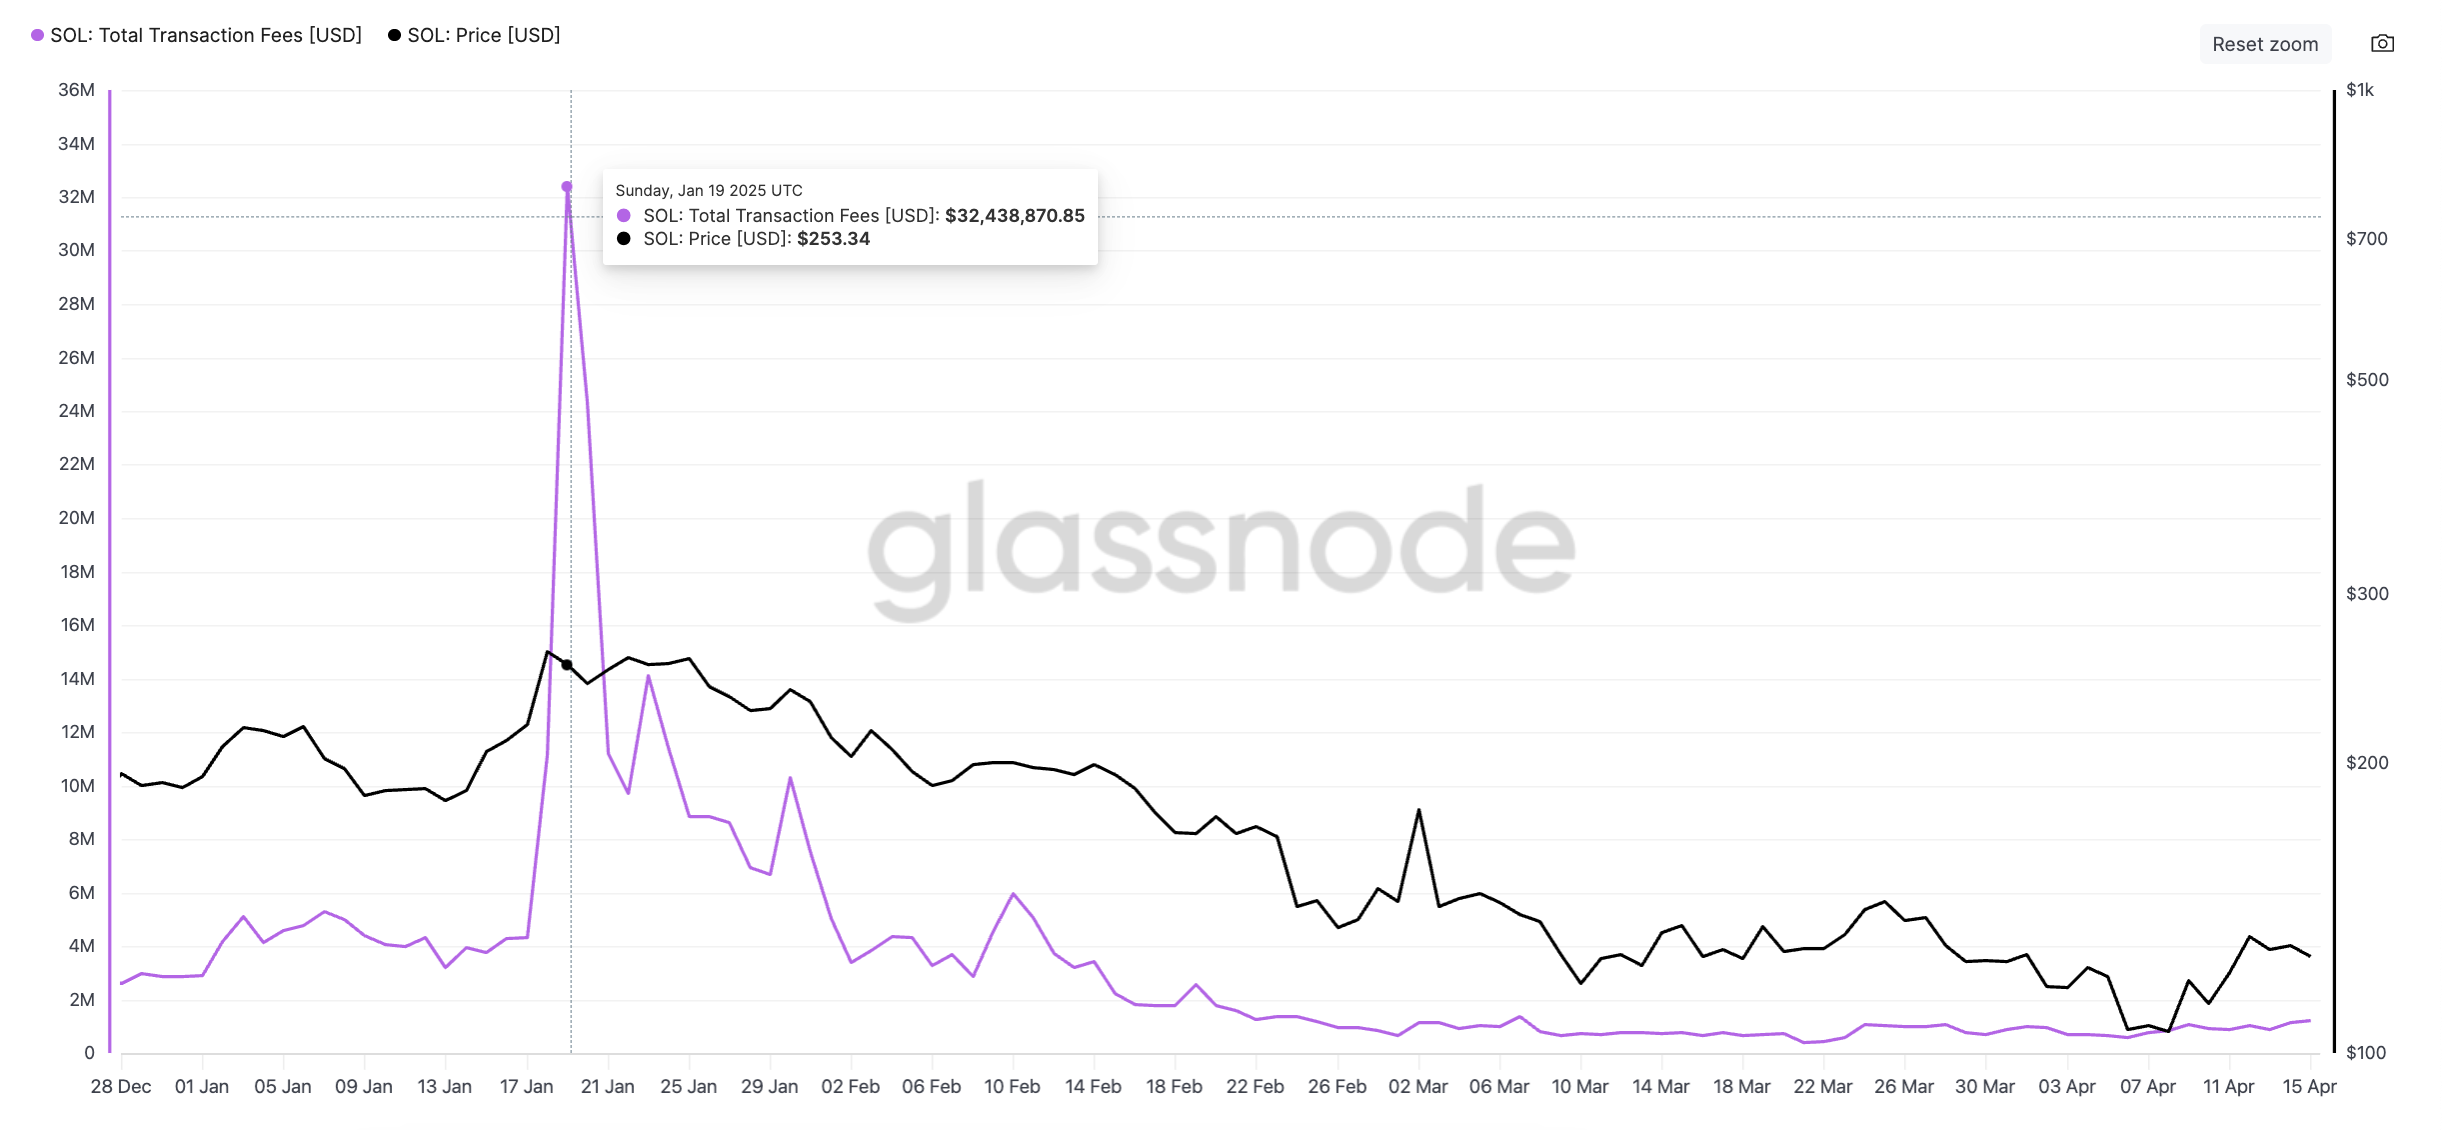
Due to the huge influx of new users on the network, transaction fees rocketed. Per Glassnode, Solana’s total transaction fees climbed to an all-time high of $32.43 million on January 19 after MELANIA launched. On the same day, SOL climbed to an all-time high of $293.
However, market exhaustion set in shortly after this price peak was reached. The meme coin mania began to fade, taking Solana users with it. Daily active addresses and new demand for the L1 plunged, dragging down DEX volume, SOL’s price, and DeFi TVL.
For example, SOL’s DEX volume hit an all-time high of $36 billion on January 19. But as the meme coin hype cooled off, by January 31, it had plummeted to just $3.8 billion, dropping nearly 90%. As of April 15, this totaled $1.5 billion.
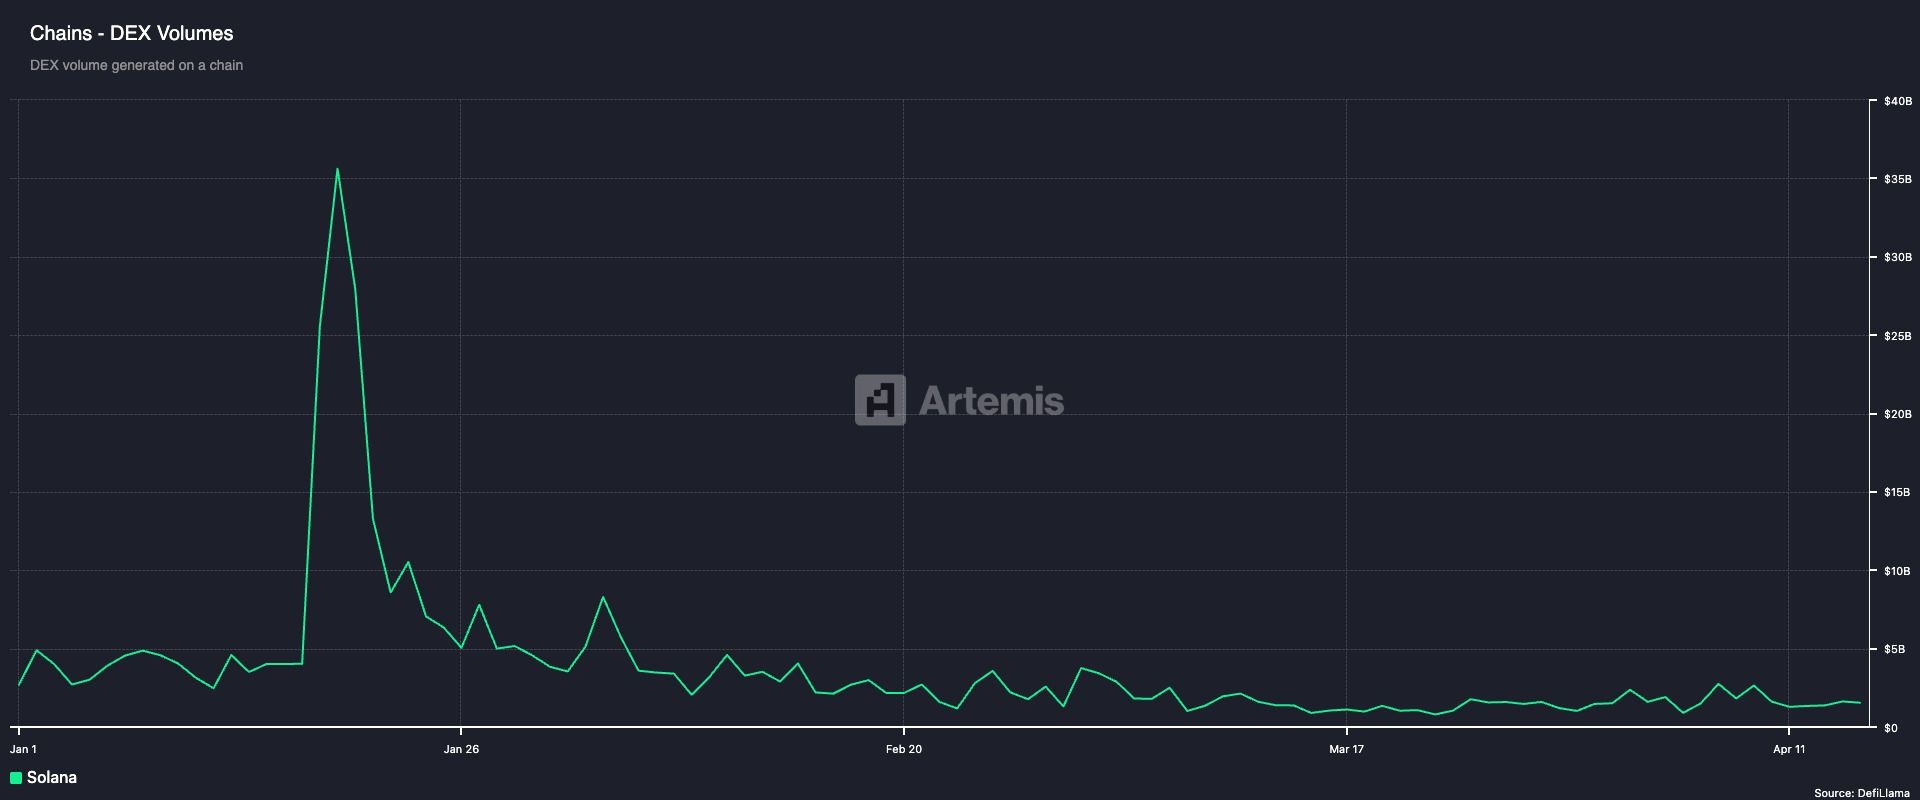
Solana’s network revenue was not spared. Daily revenue, which rose to an all-time high of $16 million on January 19, plummeted to under $5 million by the end of January. Yesterday, the network’s total revenue from all transactions completed was under $115,000.

Solana Has Bigger Plans, Analyst Says
While TRUMP, MELANIA, and the slew of other meme coins that launched on Solana in the first few weeks of the year drove unprecedented network activity and boosted SOL’s value, the drop in their values and overall trading volumes has impacted the network’s performance.
It then raises the question of whether Solana’s actual value is now tied to this highly volatile, borderline chaotic asset class.
In an exclusive interview with BeInCrypto, Binance Research spokesperson Marina Zibareva noted that while these meme assets contributed to the network’s growth at the beginning of the year, Solana’s performance remains “increasingly driven by broader ecosystem fundamentals.”
According to Zibareva:
“We’ve seen DeFi TVL grow nearly 4x in SOL terms since January, and stablecoin supply has increased over 6x – pointing to lasting interest in real utility. Developer activity is also accelerating, with smart contract deployments rising almost 6x, suggesting strong long-term potential beyond the speculative wave.”
Although Solana’s inherent features make it a go-to destination for launching meme coins via platforms like Pump.fun, Jupiter, and Meteora, Zibareva sees a future for the network that stretches beyond meme coins.
“Meme coins have brought attention and users, but the long-term trajectory likely points toward use cases like DeFi, DePIN, Gaming, and SocialFi. Solana’s daily active addresses have increased nearly 6x year-to-date, and with its infrastructure battle-tested, we expect to see more developer activity focused on sustainable value creation,” she added.
Disclaimer
In line with the Trust Project guidelines, this price analysis article is for informational purposes only and should not be considered financial or investment advice. BeInCrypto is committed to accurate, unbiased reporting, but market conditions are subject to change without notice. Always conduct your own research and consult with a professional before making any financial decisions. Please note that our Terms and Conditions, Privacy Policy, and Disclaimers have been updated.

DOGE Whale Moves 478M Coins As Analyst Predicts Dogecoin Price Breakout “Within Hours”

Pi Network Drops10% as Outflows Surge, Death Cross Looms

Raydium’s New Token Launchpad Competes with Pump.fun
Analyst Reveals Why The Solana Price Can Still Drop To $65

How It’s Impacting the Network

DWF Invests $25 Million in Trump’s World Liberty Financial

2.52 Million Altcoins Are Ruining Crypto’s Future

Animoca Brands Valuation Tanks 75% In Two Years, Here’s Why

Crypto exchange BingX hacked for $43 million

Are The Big Players Losing Interest?

Hong Kong’s Securities Association Tips Authorities On Crypto Self-Regulation

Coinbase cbBTC Set to go Live on Solana
2.52 Million Altcoins Are Ruining Crypto’s Future
Animoca Brands Valuation Tanks 75% In Two Years, Here’s Why
Crypto exchange BingX hacked for $43 million
Are The Big Players Losing Interest?
Hong Kong’s Securities Association Tips Authorities On Crypto Self-Regulation
Coinbase cbBTC Set to go Live on Solana
-

 Ethereum21 hours ago
Ethereum Metrics Reveal Critical Support Level – Can Buyers Step In?
-

 Market20 hours ago
Solana (SOL) Jumps 20% as DEX Volume and Fees Soar
-

 Market19 hours ago
Hedera Under Pressure as Volume Drops, Death Cross Nears
-

 Bitcoin24 hours ago
Bitcoin Adoption Grows As Public Firms Raise Holdings In Q1
-

 Market18 hours ago
Ethena Labs Leaves EU Market Over MiCA Compliance
-

 Market17 hours ago
3 US Crypto Stocks to Watch Today: CORZ, MSTR, and COIN
-

 Market16 hours ago
Bitcoin Price on The Brink? Signs Point to Renewed Decline
-

 Market23 hours ago
New USDi Stablecoin Pegged to US Inflation Metrics
