
Market
US Bitcoin ETFs Surge as BlackRock’s IBIT Sees $3.36B in Trades

BlackRock’s iShares Bitcoin Trust (IBIT) saw trading volume reach $3.36 billion on Tuesday, a six-month high amid heightened activity across all Bitcoin ETFs.
Meanwhile, Bitcoin (BTC) is trading with a bullish bias, holding well above the $72,000 threshold. Its March 14 all-time high of $73,777 is now within striking distance.
BlackRock’s Bitcoin ETF Hits Six Month High At $3.36 Billion
The IBIT spot Bitcoin ETF recorded $642.9 million inflows on Tuesday, more than double the positive flows recorded on Monday. Similarly, the value traded hit $3.36 billion, as shown by data on SoSoValue. This sentiment was shared across all US Spot Bitcoin ETFs, which recorded elevated trading.
Read more: What Is a Bitcoin ETF?
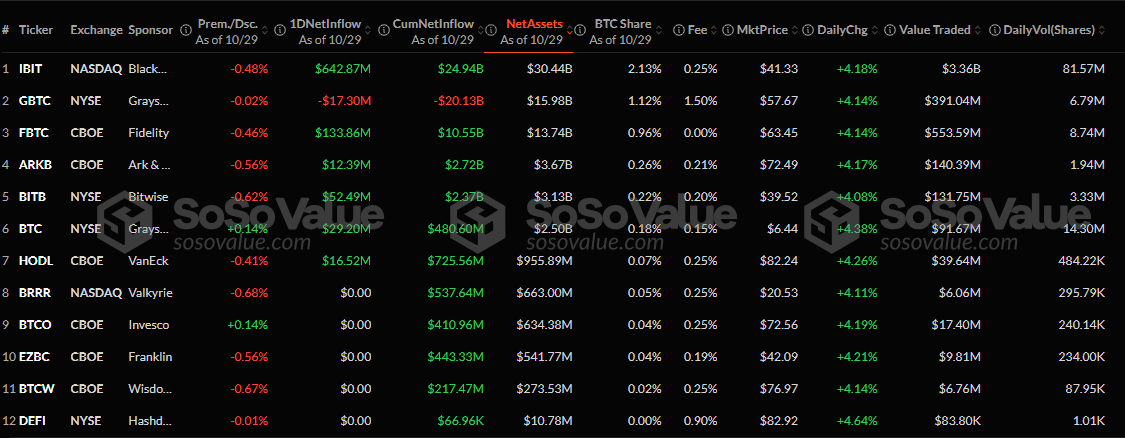
ETF analyst Eric Balchunas noted the rise is surprising given Bitcoin’s 4% gain. The surprise came as ETF volumes traditionally surge in market downturns, with this unorthodox turnout hinting at possible FOMO (fear of missing out) interest in Bitcoin. Against this backdrop, the ETF expert anticipates more inflows this week as Bitcoin continues to show strength.
“Given the surge in price the past few days, my guess is this is the latter, which means looking for (more) big inflows this week…. If this is a FOMO Frenzy we’ll see it show up in the flows next few nights,” Balchunas noted.
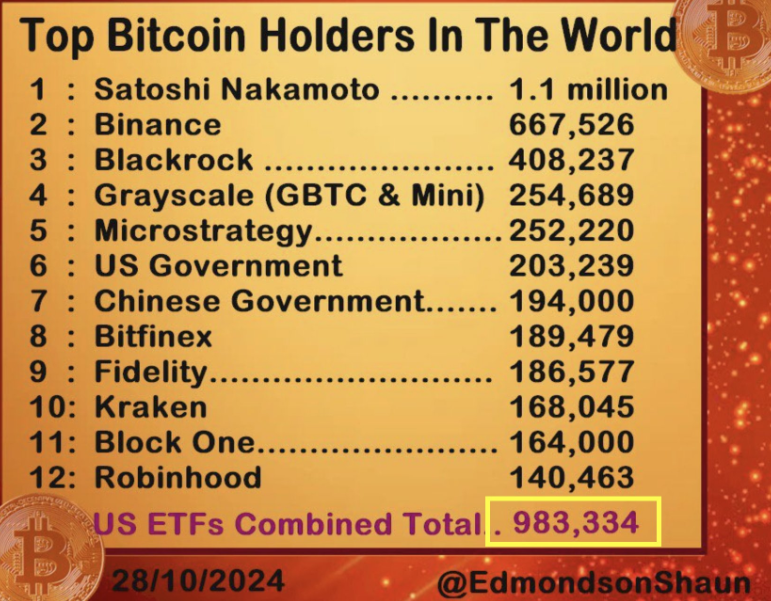
Indeed, with all major US Bitcoin ETFs seeing elevated trading, upcoming reports could confirm significant inflows if the trend continues. Meanwhile, US spot Bitcoin ETFs are projected to reach one million BTC held by next week, closing in on Satoshi Nakamoto’s estimated holdings of up to 1.1 million by mid-December.
BlackRock’s dominance in the Bitcoin space is unsurprising, given the firm’s pivot to cryptocurrency. Alongside MicroStrategy’s Michael Saylor, BlackRock remains one of Bitcoin’s strongest advocates. During the Q3 earnings call, CEO Larry Fink revealed that IBIT reached a $23 billion market in just nine months.
Recently, Fink also said Bitcoin is an independent asset as the BlackRock executive progressively fastens his belief in the pioneer crypto despite his previous skepticism. Taken together, therefore, the latest milestone coincides with BlackRock’s ongoing investments, recently purchasing over $680 million in Bitcoin. This is alongside a deeper involvement in Bitcoin-linked firms like MicroStrategy.
The general sentiment is that external factors, such as a Bitcoin price rally or a potential Donald Trump election victory, could accelerate inflows. CoinShares researchers echoed this view, attributing the rising interest to US politics rather than monetary policy. This is especially true among traditional investors, who actively engage with spot ETFs for the first time.
Read more: Who Owns the Most Bitcoin in 2024?
Nevertheless, as spot Bitcoin ETFs draw large financial institutions to the Bitcoin market, concerns arise that they increasingly contradict the principles behind Bitcoin’s establishment. Specifically, institutional control in the crypto space would erode this original ethos, shifting power back to the very entities Bitcoin aimed to bypass.
“Does this not defeat the whole purpose of “decentralization”? BlackRock will be the biggest hodler, it doesn’t get much more centralized than that,” one X user noted.
Disclaimer
In adherence to the Trust Project guidelines, BeInCrypto is committed to unbiased, transparent reporting. This news article aims to provide accurate, timely information. However, readers are advised to verify facts independently and consult with a professional before making any decisions based on this content. Please note that our Terms and Conditions, Privacy Policy, and Disclaimers have been updated.


Reason to trust
![]()
Strict editorial policy that focuses on accuracy, relevance, and impartiality
Created by industry experts and meticulously reviewed
The highest standards in reporting and publishing
Strict editorial policy that focuses on accuracy, relevance, and impartiality
Morbi pretium leo et nisl aliquam mollis. Quisque arcu lorem, ultricies quis pellentesque nec, ullamcorper eu odio.
Bitcoin price is slowly moving higher above the $83,500 zone. BTC must clear the $85,200 resistance zone to continue higher in the near term.
- Bitcoin found support at $83,200 and started a recovery wave.
- The price is trading above $84,500 and the 100 hourly Simple moving average.
- There was a break above a connecting bearish trend line with resistance at $84,650 on the hourly chart of the BTC/USD pair (data feed from Kraken).
- The pair could start another increase if it clears the $85,200 zone.
Bitcoin Price Eyes Fresh Upside
Bitcoin price started a fresh decline below the $86,200 and $85,500 levels. BTC even declined below the $84,00 level before the bulls appeared.
The price tested the $83,200 support. A low was formed at $83,171 and the price recently started a recovery wave. The price climbed above the $84,500 resistance zone. There was a break above the 50% Fib retracement level of the downward move from the $86,400 swing high to the $83,171 low.
Besides, there was a break above a connecting bearish trend line with resistance at $84,650 on the hourly chart of the BTC/USD pair. Bitcoin price is now trading above $84,500 and the 100 hourly Simple moving average.
On the upside, immediate resistance is near the $85,200 level. It is near the 61.8% Fib retracement level of the downward move from the $86,400 swing high to the $83,171 low. The first key resistance is near the $85,500 level. The next key resistance could be $86,500.

A close above the $86,500 resistance might send the price further higher. In the stated case, the price could rise and test the $87,200 resistance level. Any more gains might send the price toward the $88,800 level.
Another Decline In BTC?
If Bitcoin fails to rise above the $85,200 resistance zone, it could start another decline. Immediate support on the downside is near the $84,500 level. The first major support is near the $84,000 level.
The next support is now near the $83,200 zone. Any more losses might send the price toward the $82,500 support in the near term. The main support sits at $81,800.
Technical indicators:
Hourly MACD – The MACD is now gaining pace in the bullish zone.
Hourly RSI (Relative Strength Index) – The RSI for BTC/USD is now above the 50 level.
Major Support Levels – $84,500, followed by $83,200.
Major Resistance Levels – $85,200 and $85,500.

Circle, the issuer behind the USDC stablecoin, has officially introduced the Refund Protocol—an advanced smart contract framework developed by Circle Research.
This innovation marks a turning point for decentralized stablecoin payments by directly embedding on-chain dispute resolution mechanisms into the blockchain, ensuring digital commerce transparency, security, and trust.
Role of Refund Protocol in the Circle Ecosystem
Traditional stablecoin payment models often lack on-chain refund or dispute resolution mechanisms. Typically, the sender’s stablecoins are held in escrow for a period before being released to the recipient.
An external party, known as an arbiter, oversees this escrow account. However, resolution usually happens off-chain when disputes arise, leading to two major concerns: centralized control by the arbiter and lack of transparency in the dispute process.
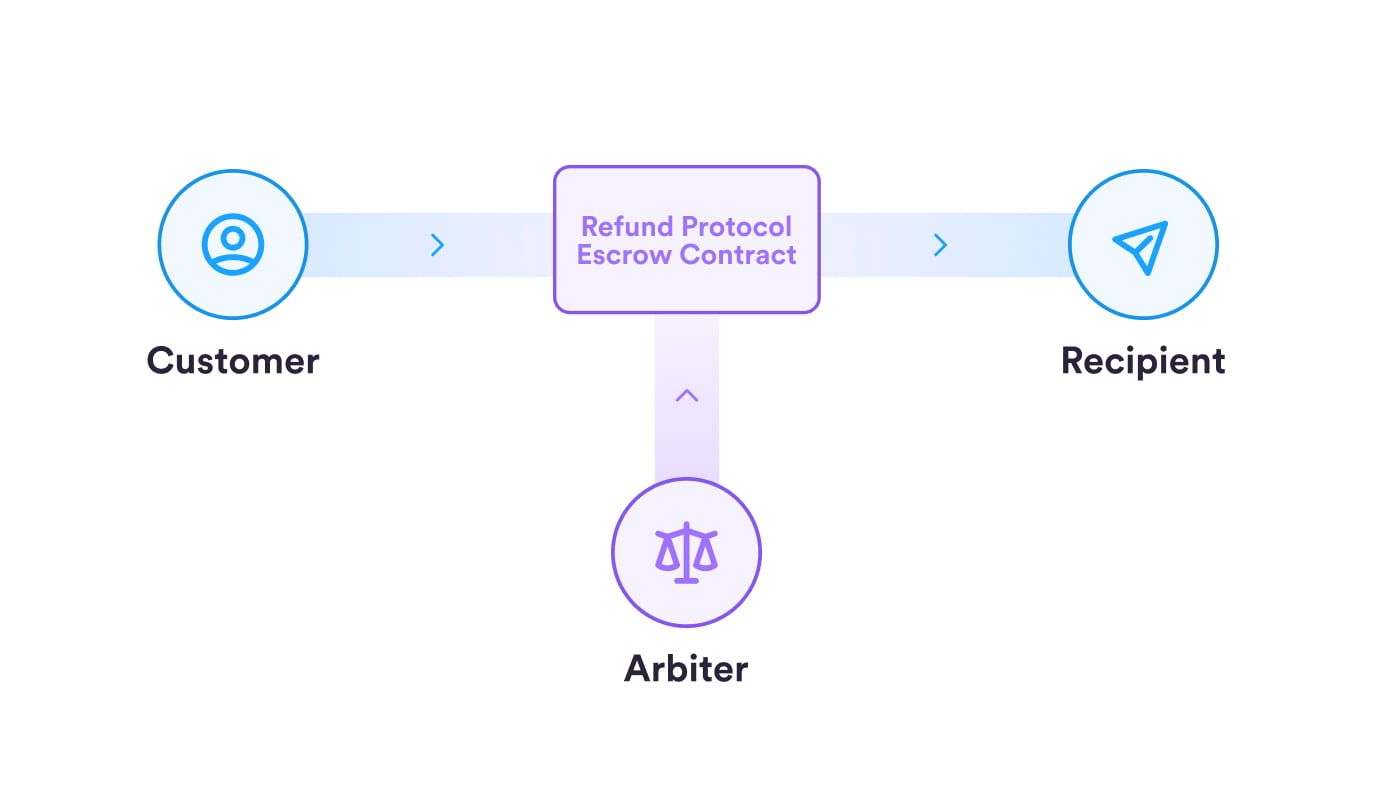
To solve this, Circle has designed the Refund Protocol to enhance the overall stablecoin payment experience, especially for USDC. The protocol acts as a smart contract, enabling non-custodial escrow and on-chain dispute resolution.
“Today, Circle’s R&D team released a new Refund Protocol for stablecoin payments. This builds on our earlier open source releases for confidential payments as well as reversible payments. Progress in mainstreaming stablecoin payments,” said Circle CEO Jeremy Allaire.
Rather than controlling the escrow account, the Refund Protocol can only do two things: release funds to the recipient or refund them to the customer. This removes reliance on third-party intermediaries, increases transparency, and boosts efficiency and user trust.
Refund Protocol to Help USDC Gain Market Share?
According to data from DefiLlama, USDT from Tether currently dominates the stablecoin market with over 61% market share. Although USDC holds the second position, its market capitalization is still less than half that of USDT.

The launch of Refund Protocol provides Circle with a strategic edge. By offering developers and businesses an easy way to integrate USDC payments into e-commerce platforms, NFT marketplaces, and DeFi applications, the protocol strengthens USDC’s position as a flexible and reliable medium of exchange.
Additionally, Refund Protocol gives Circle an advantage by providing a decentralized, low-cost, and transparent solution. This will help USDC stand out in real-world applications.
Refund Protocol may face regulatory hurdles despite its innovation, especially in jurisdictions with strict blockchain laws. The legal recognition of on-chain dispute resolution remains uncertain in many regions, potentially posing one of the biggest obstacles to widespread adoption.
Disclaimer
In adherence to the Trust Project guidelines, BeInCrypto is committed to unbiased, transparent reporting. This news article aims to provide accurate, timely information. However, readers are advised to verify facts independently and consult with a professional before making any decisions based on this content. Please note that our Terms and Conditions, Privacy Policy, and Disclaimers have been updated.

Aayush Jindal, a luminary in the world of financial markets, whose expertise spans over 15 illustrious years in the realms of Forex and cryptocurrency trading. Renowned for his unparalleled proficiency in providing technical analysis, Aayush is a trusted advisor and senior market expert to investors worldwide, guiding them through the intricate landscapes of modern finance with his keen insights and astute chart analysis.
From a young age, Aayush exhibited a natural aptitude for deciphering complex systems and unraveling patterns. Fueled by an insatiable curiosity for understanding market dynamics, he embarked on a journey that would lead him to become one of the foremost authorities in the fields of Forex and crypto trading. With a meticulous eye for detail and an unwavering commitment to excellence, Aayush honed his craft over the years, mastering the art of technical analysis and chart interpretation.
As a software engineer, Aayush harnesses the power of technology to optimize trading strategies and develop innovative solutions for navigating the volatile waters of financial markets. His background in software engineering has equipped him with a unique skill set, enabling him to leverage cutting-edge tools and algorithms to gain a competitive edge in an ever-evolving landscape.
In addition to his roles in finance and technology, Aayush serves as the director of a prestigious IT company, where he spearheads initiatives aimed at driving digital innovation and transformation. Under his visionary leadership, the company has flourished, cementing its position as a leader in the tech industry and paving the way for groundbreaking advancements in software development and IT solutions.
Despite his demanding professional commitments, Aayush is a firm believer in the importance of work-life balance. An avid traveler and adventurer, he finds solace in exploring new destinations, immersing himself in different cultures, and forging lasting memories along the way. Whether he’s trekking through the Himalayas, diving in the azure waters of the Maldives, or experiencing the vibrant energy of bustling metropolises, Aayush embraces every opportunity to broaden his horizons and create unforgettable experiences.
Aayush’s journey to success is marked by a relentless pursuit of excellence and a steadfast commitment to continuous learning and growth. His academic achievements are a testament to his dedication and passion for excellence, having completed his software engineering with honors and excelling in every department.
At his core, Aayush is driven by a profound passion for analyzing markets and uncovering profitable opportunities amidst volatility. Whether he’s poring over price charts, identifying key support and resistance levels, or providing insightful analysis to his clients and followers, Aayush’s unwavering dedication to his craft sets him apart as a true industry leader and a beacon of inspiration to aspiring traders around the globe.
In a world where uncertainty reigns supreme, Aayush Jindal stands as a guiding light, illuminating the path to financial success with his unparalleled expertise, unwavering integrity, and boundless enthusiasm for the markets.
DOGE Price To Hit $1?

Bitcoin Price Gears Up for Next Leg Higher—Upside Potential Builds

HashKey Launches First XRP Tracker Fund With Ripple’s Backing

Circle Introduces On-Chain Refund Protocol to Strengthen USDC Payments

What Good Friday Options Expiry Means for Bitcoin & Ethereum

Ethereum Fee Plunges To 5-Year Low—Is This A Bottom Signal?

2.52 Million Altcoins Are Ruining Crypto’s Future

Animoca Brands Valuation Tanks 75% In Two Years, Here’s Why

Crypto exchange BingX hacked for $43 million

Are The Big Players Losing Interest?

Hong Kong’s Securities Association Tips Authorities On Crypto Self-Regulation

Coinbase cbBTC Set to go Live on Solana
2.52 Million Altcoins Are Ruining Crypto’s Future
Animoca Brands Valuation Tanks 75% In Two Years, Here’s Why
Crypto exchange BingX hacked for $43 million
Are The Big Players Losing Interest?
Hong Kong’s Securities Association Tips Authorities On Crypto Self-Regulation
Coinbase cbBTC Set to go Live on Solana
-
 Altcoin24 hours ago
How Rising Solana Network Inflows Could Drive SOL Price to $150?
-
 Bitcoin23 hours ago
Gary Gensler Explains Why Bitcoin Will Outlast Altcoins
-

 Market23 hours ago
Bitcoin Whales Withdraw $280 Million: Bullish Signal?
-

 Market16 hours ago
Over $700 Million In XRP Moved In April, What Are Crypto Whales Up To?
-

 Altcoin16 hours ago
CZ Honors Nearly $1 Billion Token Burn Promise
-

 Market24 hours ago
XRP’s $2.00 Pivot Point—A Launchpad or Breakdown Zone?
-
 Altcoin23 hours ago
How Crypto Traders Made $666K from $4.5K in One Trade?
-

 Market22 hours ago
Bitcoin Price Range-Bound—But a Move Higher May Be Brewing?