
Market
Understanding the Dominance of Tether’s USDT

Stablecoins have become an essential part of the blockchain space, offering stability in a highly volatile market. Although there are dozens of stablecoins with different collateral available to investors today, Tether’s USDT remains the to-go choice for most crypto users.
In this article, we explore the importance of stablecoins, focusing on USDT and its unconditional dominance.
The Need for Stability
Stablecoins are digital assets designed to maintain a stable value by being pegged to a reserve asset, such as the US dollar, euro, or even commodities like gold. They achieve this stability through various mechanisms, including fiat-collateralized, crypto-collateralized, and algorithmic stablecoins. Fiat-collateralized stablecoins, the most common type, back each token issued with reserves of the corresponding fiat currency, ensuring support by a real-world asset.
While many crypto investors enjoy a bit of volatility, the level seen in most crypto assets can make it difficult to use them for payments or trading. Stablecoins address this issue by offering a stable and reliable alternative, facilitating their use in a wide range of applications, including base trading pairs, remittances, and decentralized finance (DeFi).
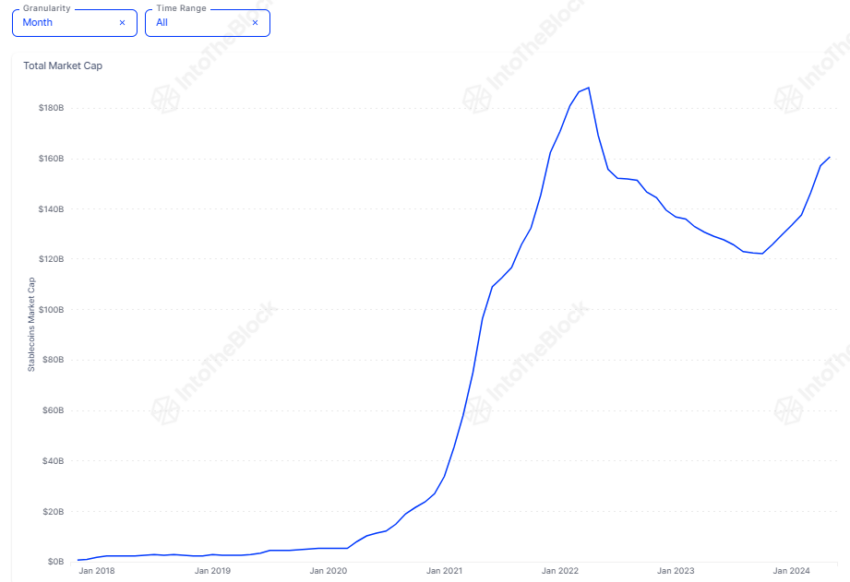
This has resulted in substantial growth for stablecoins, now boasting a combined market capitalization of $161 billion. The chart below highlights this significant increase, which began in 2020.
Read more: How to Buy USDT in Three Easy Steps – A Beginner’s Guide
“While some of this growth is due to the rising interest in cryptocurrencies, it is primarily driven by the growing importance of DeFi and the crucial role stablecoins play in DeFi primitives like lending protocols and automated market makers (AMMs),” Vincent Maliepaard, Marketing Director at IntoTheBlock, told BeInCrypto.
USDT: The Undisputed Market Leader
Despite strong competition, Tether (USDT) has established itself as the most important stablecoin in the cryptocurrency market. Launched in 2014, USDT is pegged to the US dollar, with each token purportedly backed by an equivalent amount of fiat currency held in reserve.
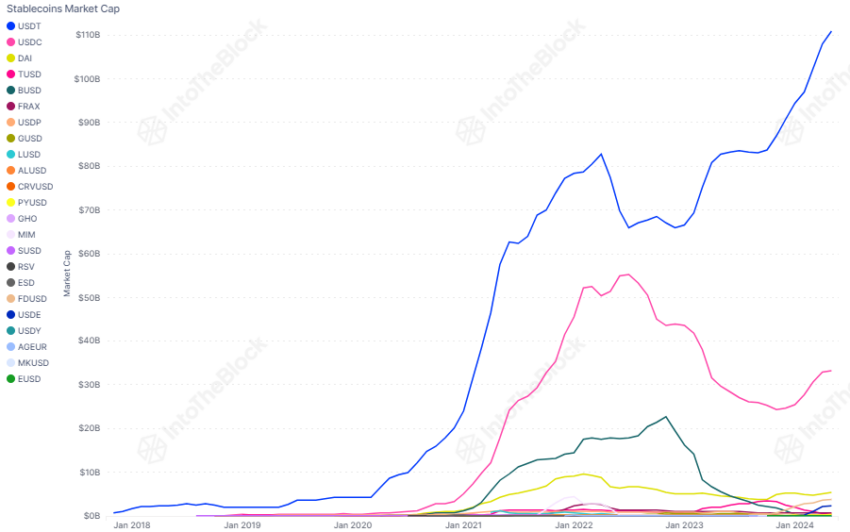
Data from IntoTheBlock shows that USDT, with a market cap of $111 billion, accounts for just over 70% of the total stablecoin market capitalization. In contrast, the second largest stablecoin, USDC, accounts for just 21%.
Read more: 9 Best Crypto Wallets to Store Tether (USDT)
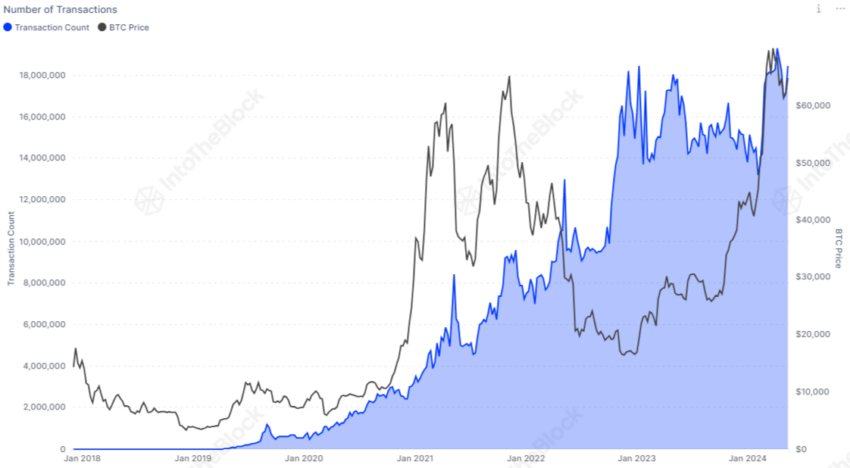
Furthermore, there is no sign that this growth is slowing down soon. The number of USDT transactions has significantly increased since the start of the year and is approaching new highs.
Maliepaard notes USDT’s dominance is attributed to several factors:
- Liquidity and Accessibility: USDT boasts the highest trading volume among stablecoins and is available on most centralized and decentralized exchanges as a base trading pair.
- Integration with DeFi: Many DeFi protocols and platforms use USDT for transactions, lending, and borrowing, enabling participation without exposure to price volatility.
- Cross-Border Transactions: USDT facilitates fast and cost-effective cross-border transactions, offering an efficient alternative to traditional banking systems.
- Stable Store of Value: In regions experiencing hyperinflation or economic instability, USDT offers a reliable store of value.
Comparing Usage of USDT Across Different Chains
While USDT activity is booming across all chains, not all are created equal. Data suggests that users utilize stablecoins differently across various networks. By examining their behavior on different chains, we can see how USDT is utilized in diverse ways. Whether it’s for trading, transferring value, or acting as a stable store of value, USDT’s versatility is evident.
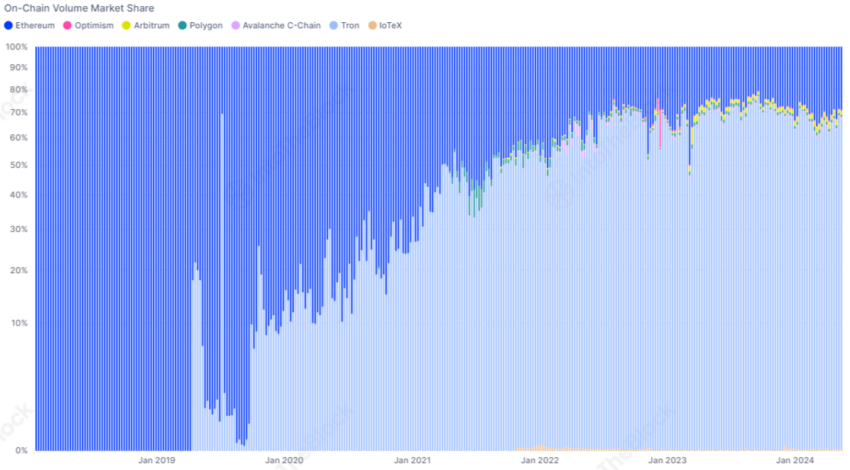
TRON Dominates USDT Transactions
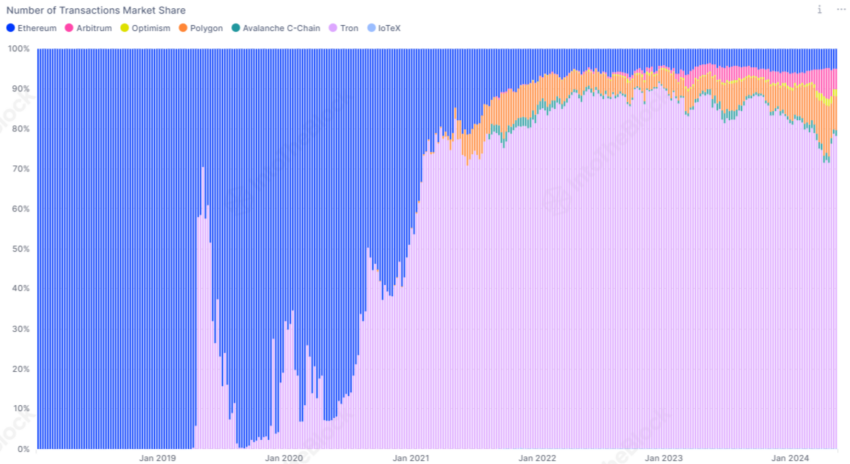
TRON leads in transaction volume with a dominant 78% share. The chart below highlights its superiority compared to other blockchain networks.
This prominence is primarily due to TRON’s low transaction costs and high availability for deposits and withdrawals on major centralized exchanges, making it the preferred option for cross-border Tether’s USDT transactions. Surprisingly, the runner-up isn’t Ethereum but Polygon, which has over 8% of the total USDT transactions.
Transaction Volume Comparison
Examining the stablecoin’s volume market share reveals that Ethereum’s transaction volume far exceeds its number of transactions, highlighting its role in facilitating higher-value transfers. In contrast, chains like Polygon, Optimism, and Avalanche have a higher number of transactions but contribute less to the overall volume, indicating their use for smaller, more frequent transactions.
Holding vs. Transacting
The average holding time of USDT on each chain further supports this finding. Data shows that Ethereum users typically keep USDT for 228 days, nearly three times longer than holders on Optimism. TRON addresses also maintain USDT for an extended period, averaging 183 days.
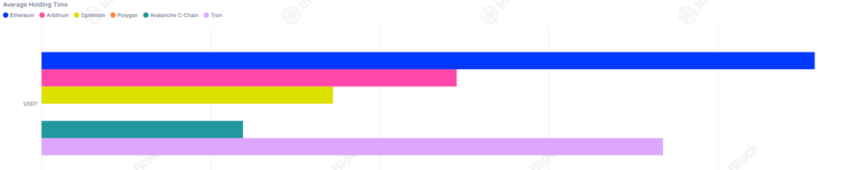
These insights indicate that on Ethereum and TRON, USDT is primarily held to mitigate market volatility, serving as a stable store of value. Conversely, on chains like Optimism and Arbitrum, USDT is frequently used for transactions, likely in DeFi-related applications where quick access to liquidity and transfer speed are crucial.
The Future of USDT
Stablecoins, particularly USDT, play a vital role in the blockchain industry by providing stability and enhancing the utility of digital assets. The recent growth of USDT across various blockchain networks solidifies its position in the cryptocurrency market. As the industry widens, the importance of stablecoins will likely grow, driven by their role in DeFi, trading, and bridging the gap between traditional finance and blockchain.
Disclaimer
In line with the Trust Project guidelines, this price analysis article is for informational purposes only and should not be considered financial or investment advice. BeInCrypto is committed to accurate, unbiased reporting, but market conditions are subject to change without notice. Always conduct your own research and consult with a professional before making any financial decisions. Please note that our Terms and Conditions, Privacy Policy, and Disclaimers have been updated.


According to a new report, 15 firms and individuals from the crypto industry donated more than $100,000 to President Trump’s Inauguration, totaling over $85 million.
Almost all of these companies apparently received direct or indirect benefits from Trump’s administration. This includes dropped legal proceedings, lucrative business partnerships, participation in Trump’s Crypto Summit, and more.
Crypto Industry Went All-In on Trump’s Inauguration
Since promising to bring friendlier regulations on the campaign trail, Donald Trump attracted a reputation as the Crypto President.
Trump’s Inauguration festivities included a “Crypto Ball,” and several prominent firms made donations for these events. Today, a report has compiled all crypto-related contributions of over $100,000, revealing some interesting facts.

Since taking office, President Trump and his family have been allegedly involved in prominent crypto controversies, and these donations may be linked to several of them.
For example, eight of the donors, Coinbase, Crypto.com, Uniswap, Yuga Labs, Kraken, Ripple, Robinhood, and Consensys, had SEC investigations or lawsuits against them closed since Trump’s term began.
The commission might have dropped its probe against these companies anyway due to its changing stance on crypto enforcement. However, being in the President’s good books likely helped the process.
Further Alleged Benefits for Donors
In other words, nearly half the firms that made donations to Trump’s Inauguration have seen their legal problems cleared up quickly. This isn’t the only regulation-related benefit they allegedly received.
Circle, for example, recently made an IPO after openly stating that Trump’s Presidency made it possible. Galaxy Digital received SEC approval for a major reorganization, a key step for a NASDAQ listing.
Other donors, such as Crypto.com and ONDO, got more direct financial partnerships with businesses associated with the Trump family.
Previously, Ripple’s CEO, Brad Garlinghouse, anticipated a crypto bull market under Trump. Also, XRP, Solana, and Cardano were all unexpectedly included in the US Crypto Reserve announcement.
All three of these companies made major donations to Trump’s Inauguration.
It seems that most of the firms involved got at least some sort of noticeable benefit from these donations. Donors like Multicoin and Paradigm received invitations to Trump’s Crypto Summit, while much more prominent groups like the Ethereum Foundation got snubbed.
Meanwhile, various industry KOLs and community members have already alleged major corruption in Trump’s crypto connections.
While some allegations might lack substantial proof, the crypto space has changed dramatically under the new administration, for both good and bad.
Disclaimer
In adherence to the Trust Project guidelines, BeInCrypto is committed to unbiased, transparent reporting. This news article aims to provide accurate, timely information. However, readers are advised to verify facts independently and consult with a professional before making any decisions based on this content. Please note that our Terms and Conditions, Privacy Policy, and Disclaimers have been updated.
Reason to trust
![]()
Strict editorial policy that focuses on accuracy, relevance, and impartiality
Created by industry experts and meticulously reviewed
The highest standards in reporting and publishing
Strict editorial policy that focuses on accuracy, relevance, and impartiality
Morbi pretium leo et nisl aliquam mollis. Quisque arcu lorem, ultricies quis pellentesque nec, ullamcorper eu odio.
In a surprising move within the crypto market, XRP has surpassed Ethereum (ETH) in a key valuation metric: Fully Diluted Market Capitalization (FDMC). While Ethereum has been in a downtrend this bull cycle, XRP’s performance over the last six months has been nothing short of impressive, leading to it quietly overtaking the world’s second-largest cryptocurrency by market capitalization.
XRP Flips Ethereum In FDMC
Edward Farina, a crypto analyst and outspoken XRP supporter, took to X (formerly Twitter) on April 18 to announce that XRP has officially overtaken Ethereum in terms of Fully Diluted Market Capitalization. The FDMC represents the total potential value of a cryptocurrency if all of its tokens were in circulation.
Related Reading
This metric is usually calculated by multiplying a cryptocurrency’s current price by its maximum token supply. This contrasts with the more commonly referenced market capitalization metric, which only factors in circulating supply.
At the time of his post, Farina reported that XRP’s FDMC had reached $208.4 billion, surpassing Ethereum’s $192.5 billion by approximately $15.9 billion. This marks over six consecutive months of XRP outperforming Ethereum in terms of projected value, signaling a potential shift in altcoin dominance between the two leading cryptocurrencies.
Despite XRP’s FDMC milestone, it’s worth noting that Ethereum’s current market capitalization remains significantly higher. As of writing, ETH’s market cap is estimated at $199.14 billion, compared to XRP’s $124.3 billion, reflecting a difference of around $74.84 billion.
The key reason for this discrepancy between XRP’s market capitalization and FDMC lies in its unique token structure. A significant portion of XRP’s supply is held in escrow, meaning those tokens are not yet available in the open market. While they do not count toward the circulating supply, they are included in its Fully Diluted Market Capitalization.
The implication behind this distinction remains clear: if all of XRP’s tokens in escrow were unlocked and circulated today, its market value could exceed that of Ethereum. As the altcoin steadily gains momentum in valuation metrics and investor interest, it could pose a significant challenge to Ethereum’s position as the number one altcoin and second-largest cryptocurrency.
Bollinger Bands Signal Major Move In The Altcoin Price
The XRP price could be gearing up for a significant move upward as technical chart indicators point toward rising volatility. A recent analysis of the 4-hour chart by crypto analyst Ali Martínez shows Bollinger Bands tightening — a classic signal that often precedes a breakout.
Related Reading
Currently trading near the midline of the bands after a bounce from the lower support zone, XRP is now consolidating within a narrow range. The “squeeze” pattern reflects reduced volatility. While the target of the proposed price move remains uncertain, Martinez is confident that its next breakout is just around the corner.
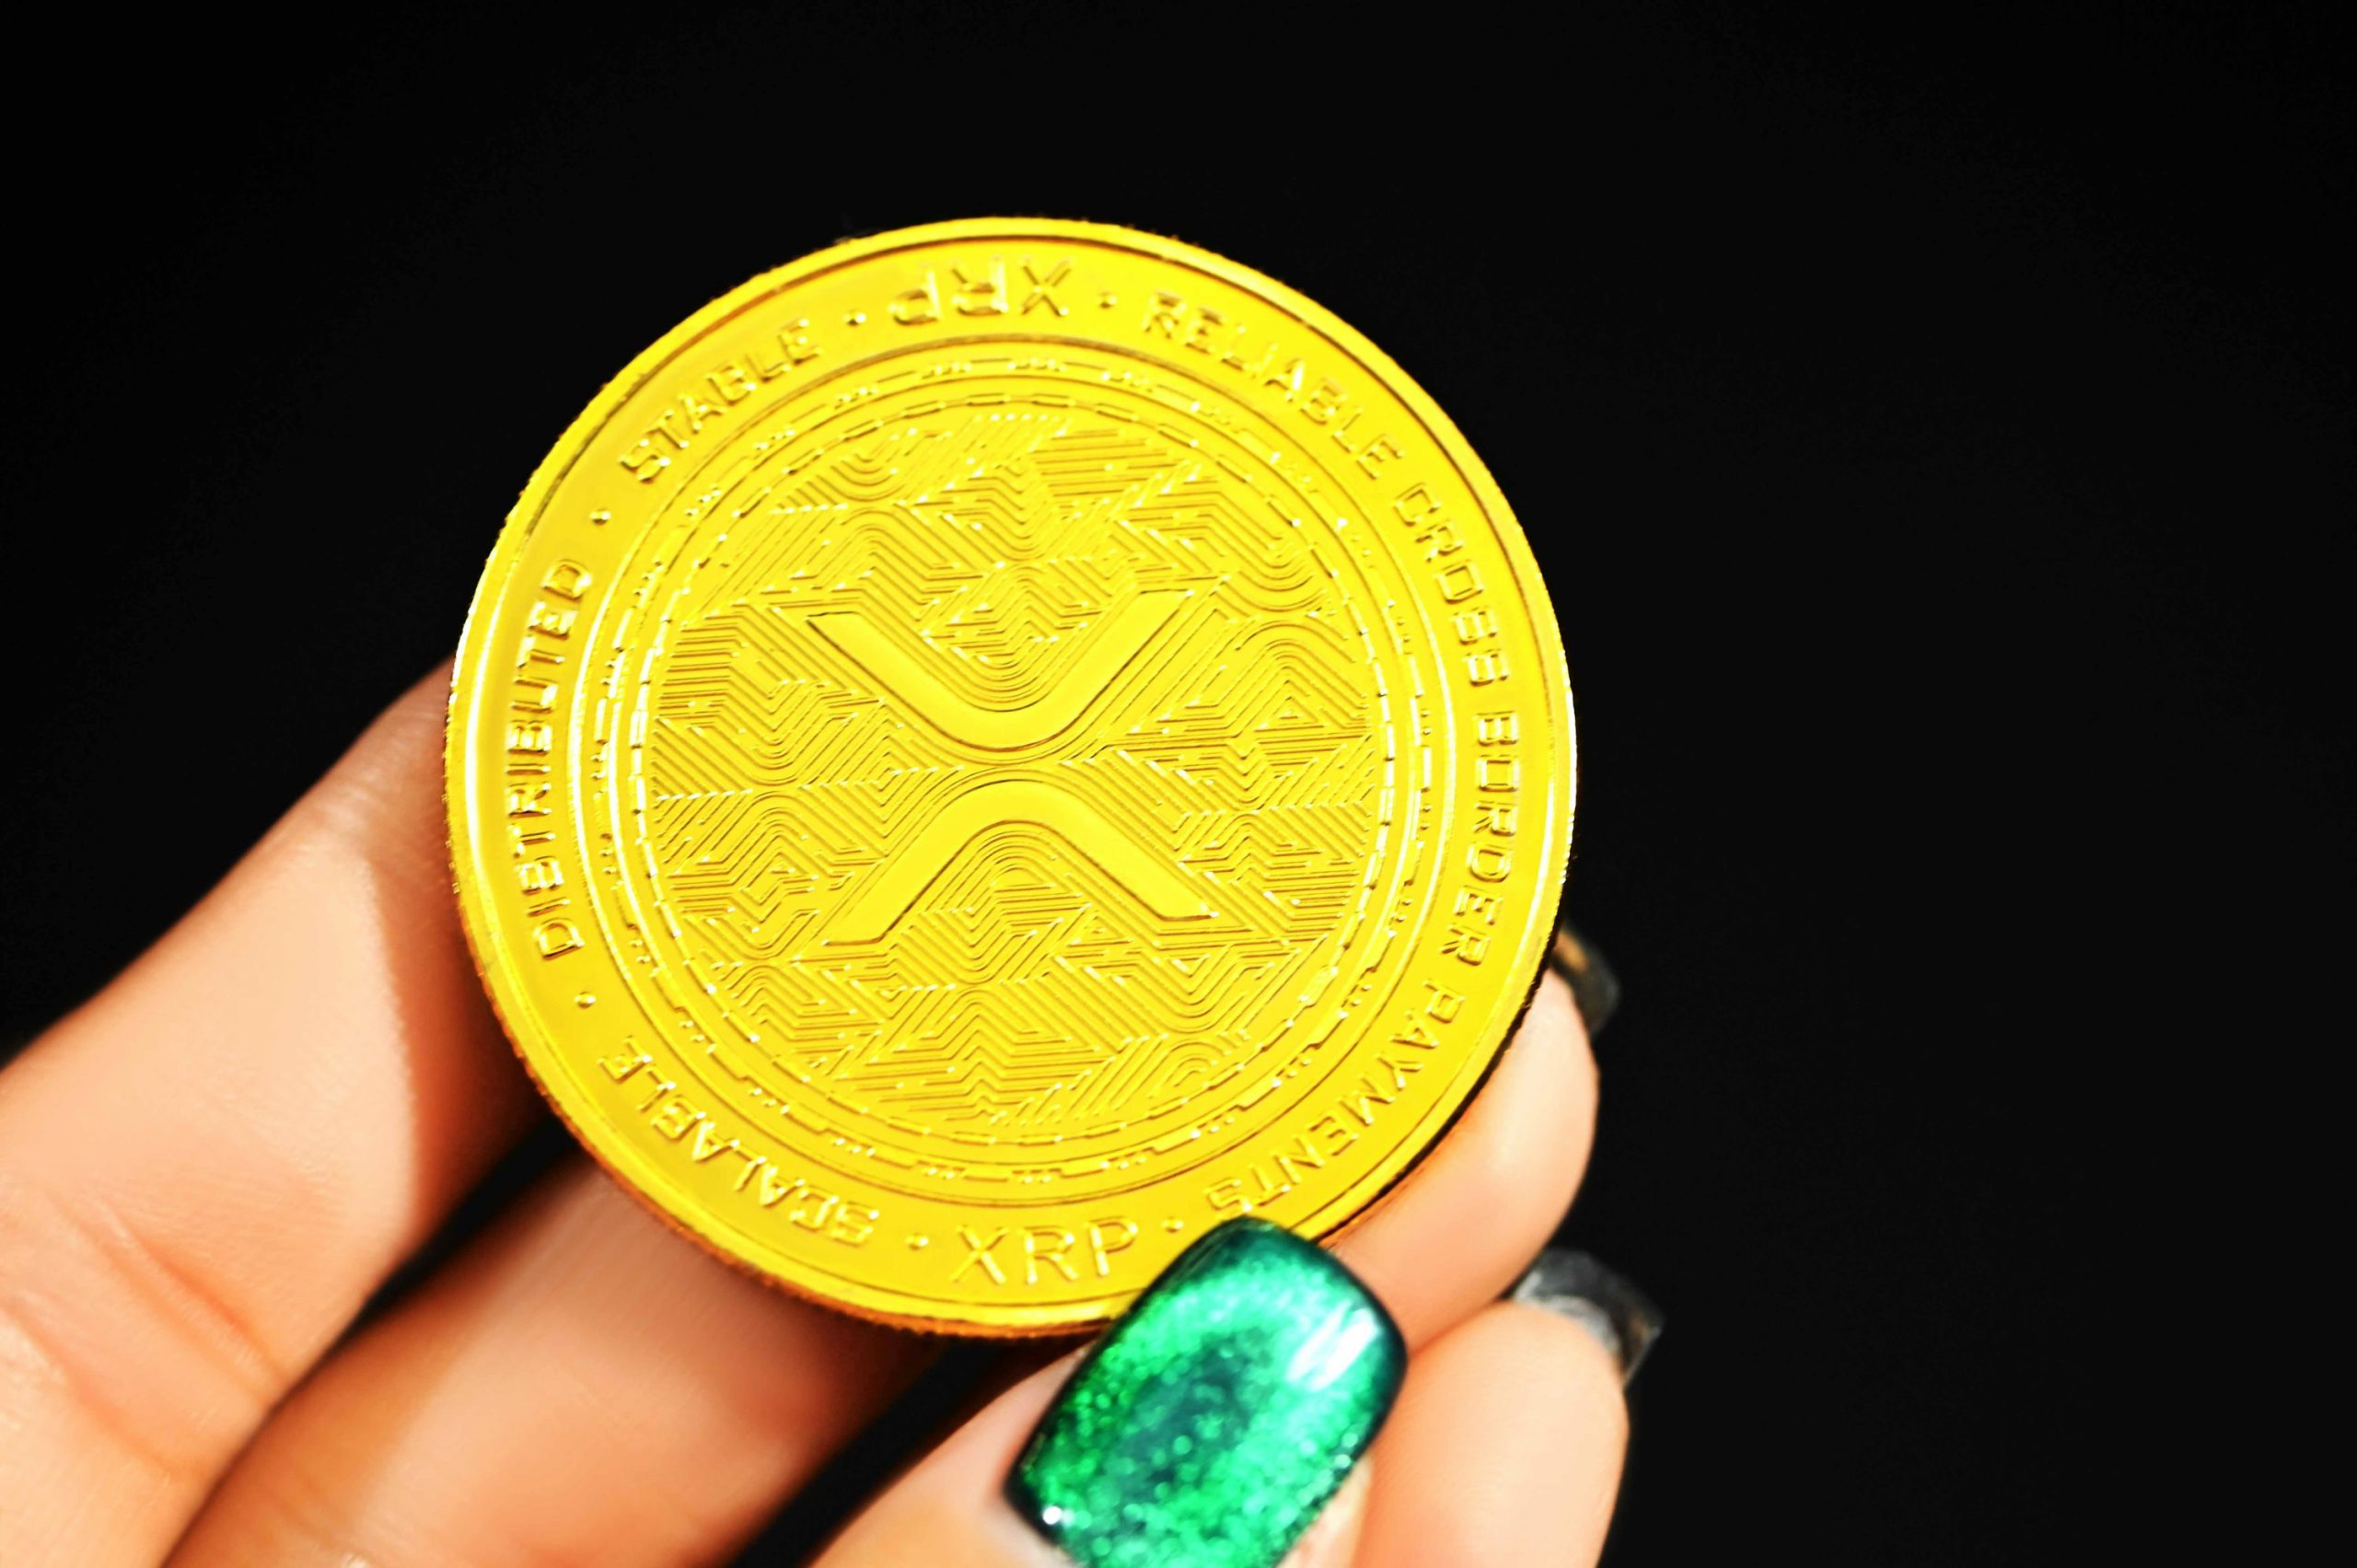
Featured image from Unsplash, chart from Tradingview.com

Cardano (ADA) is up 4% on Monday, trying to hit $0.65, showing signs of renewed bullish momentum. Technical indicators are beginning to align in favor of buyers, with the BBTrend turning positive for the first time in days and the DMI signaling strengthening upward pressure.
ADA is also nearing a potential golden cross formation on its EMA lines, which could further support a breakout if resistance levels are cleared. With momentum building and key levels in sight, Cardano is entering a critical zone that could define its short-term direction.
Cardano Shows Early Signs of Recovery as BBTrend Turns Positive
Cardano BBTrend has just flipped back into positive territory at 0.11, following four straight days in the negative zone. This shift, though subtle, may be the first sign of momentum stabilizing after recent weakness.
BBTrend, or Bollinger Band Trend, is a technical indicator that gauges the strength and direction of a trend based on how wide or narrow the Bollinger Bands are.
When the bands begin to expand and BBTrend moves into positive values, it often suggests growing volatility in favor of an emerging bullish trend. On the other hand, prolonged negative readings typically signal fading momentum and a lack of directional strength.
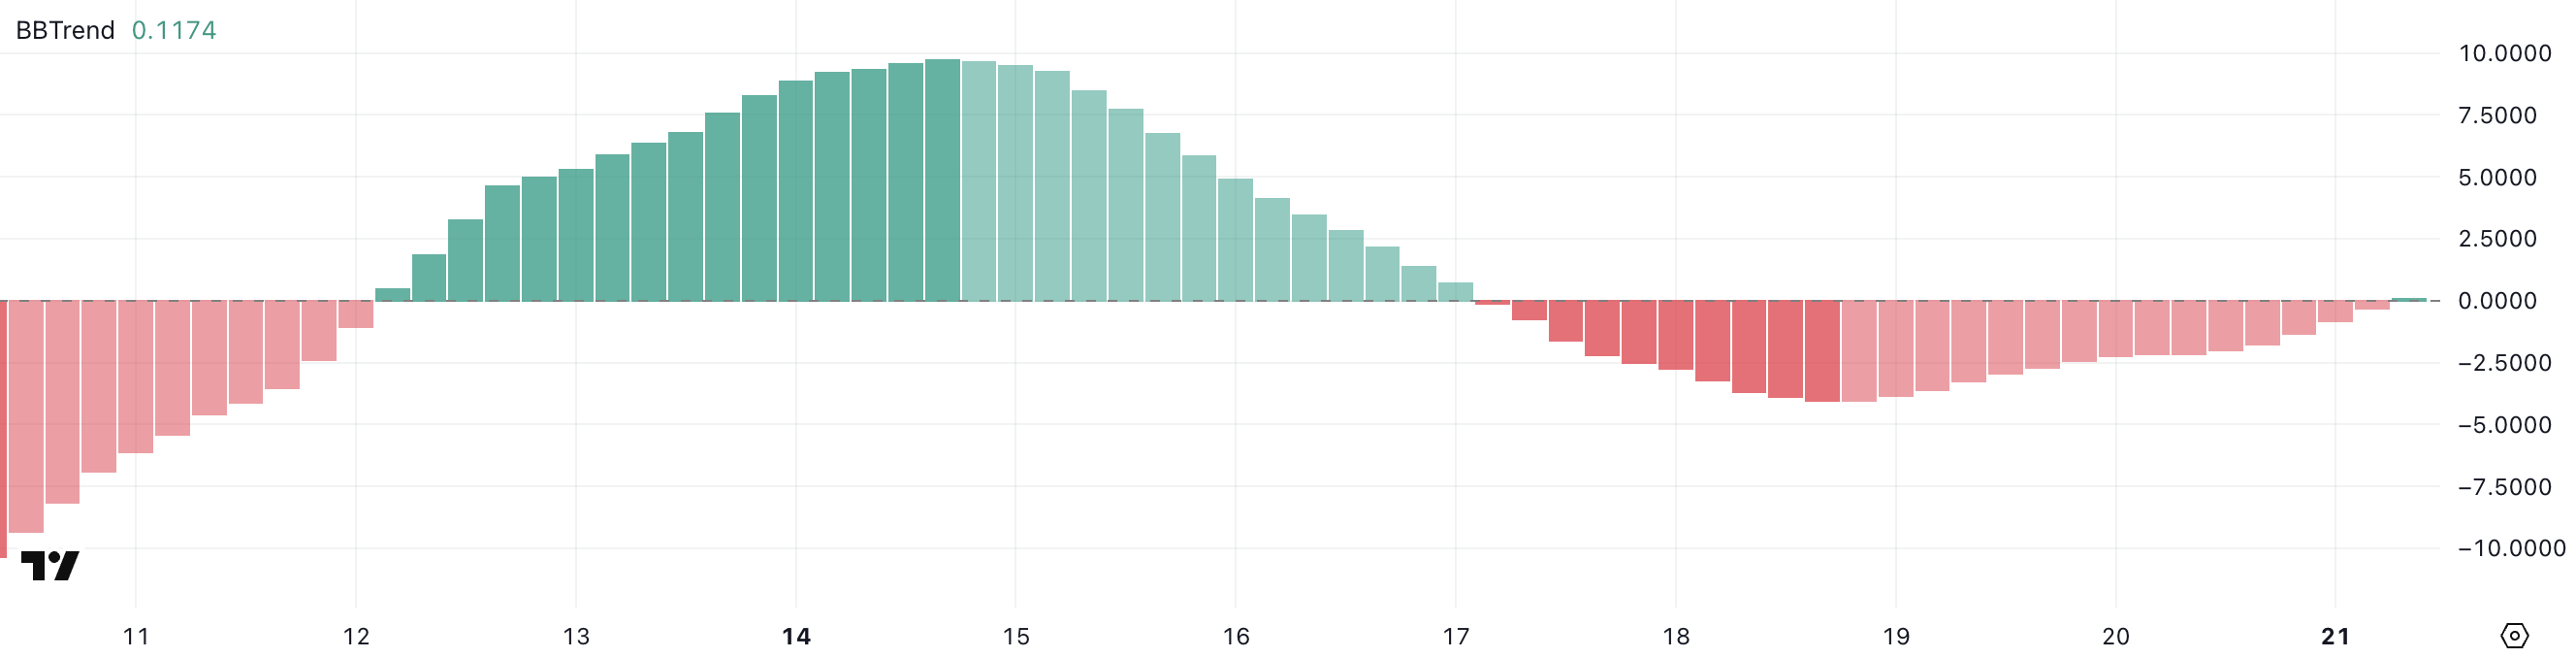
While a BBTrend of 0.11 is still low and not yet signaling a strong uptrend, the fact that it turned positive marks a potential inflection point.
It suggests that selling pressure may be fading and the price could be entering a recovery phase if buying activity increases. This early uptick in BBTrend often precedes a broader move.
Traders will likely be watching closely to see if this positive shift is sustained in the coming sessions, as continued gains in BBTrend could indicate the beginning of a more defined upward move for ADA.
Cardano Buyers Regain Control as Uptrend Shows Early Strength
Cardano Directional Movement Index (DMI) is showing a notable shift in momentum, with its Average Directional Index (ADX) climbing to 17.79, up from 13.77 yesterday.
The ADX measures the strength of a trend, regardless of its direction, on a scale from 0 to 100. Values below 20 suggest a weak or non-existent trend, while readings above 25 typically confirm that a trend is gaining strength.
ADA’s ADX is still below the 20 threshold but rising steadily—indicating that momentum is building and a stronger directional move could soon take shape.

Looking deeper, the +DI (positive directional indicator) has jumped to 26.38 from 16.30 just a day ago, signaling increased buying pressure. Although it has slightly pulled back from an earlier peak at 29.57, it remains firmly above the -DI (negative directional indicator), which has dropped significantly from 22.72 to 13.73.
This widening gap between the +DI and -DI suggests a clear shift in favor of bulls, with buyers regaining control after a brief period of selling pressure.
If the ADX continues to rise alongside a dominant +DI, it could confirm a strengthening uptrend for Cardano.
Cardano Nears Golden Cross as Bulls Eye Breakout—but Key Support Still in Play
Cardano price is approaching a potentially bullish technical development, as its EMA lines suggest a golden cross may form in the coming sessions.
A golden cross occurs when the short-term moving average crosses above the long-term moving average, often signaling the start of a stronger uptrend.
If this crossover is confirmed and ADA manages to break above the resistance at $0.668, the next upside targets sit at $0.709 and $0.77—levels not seen since late March.
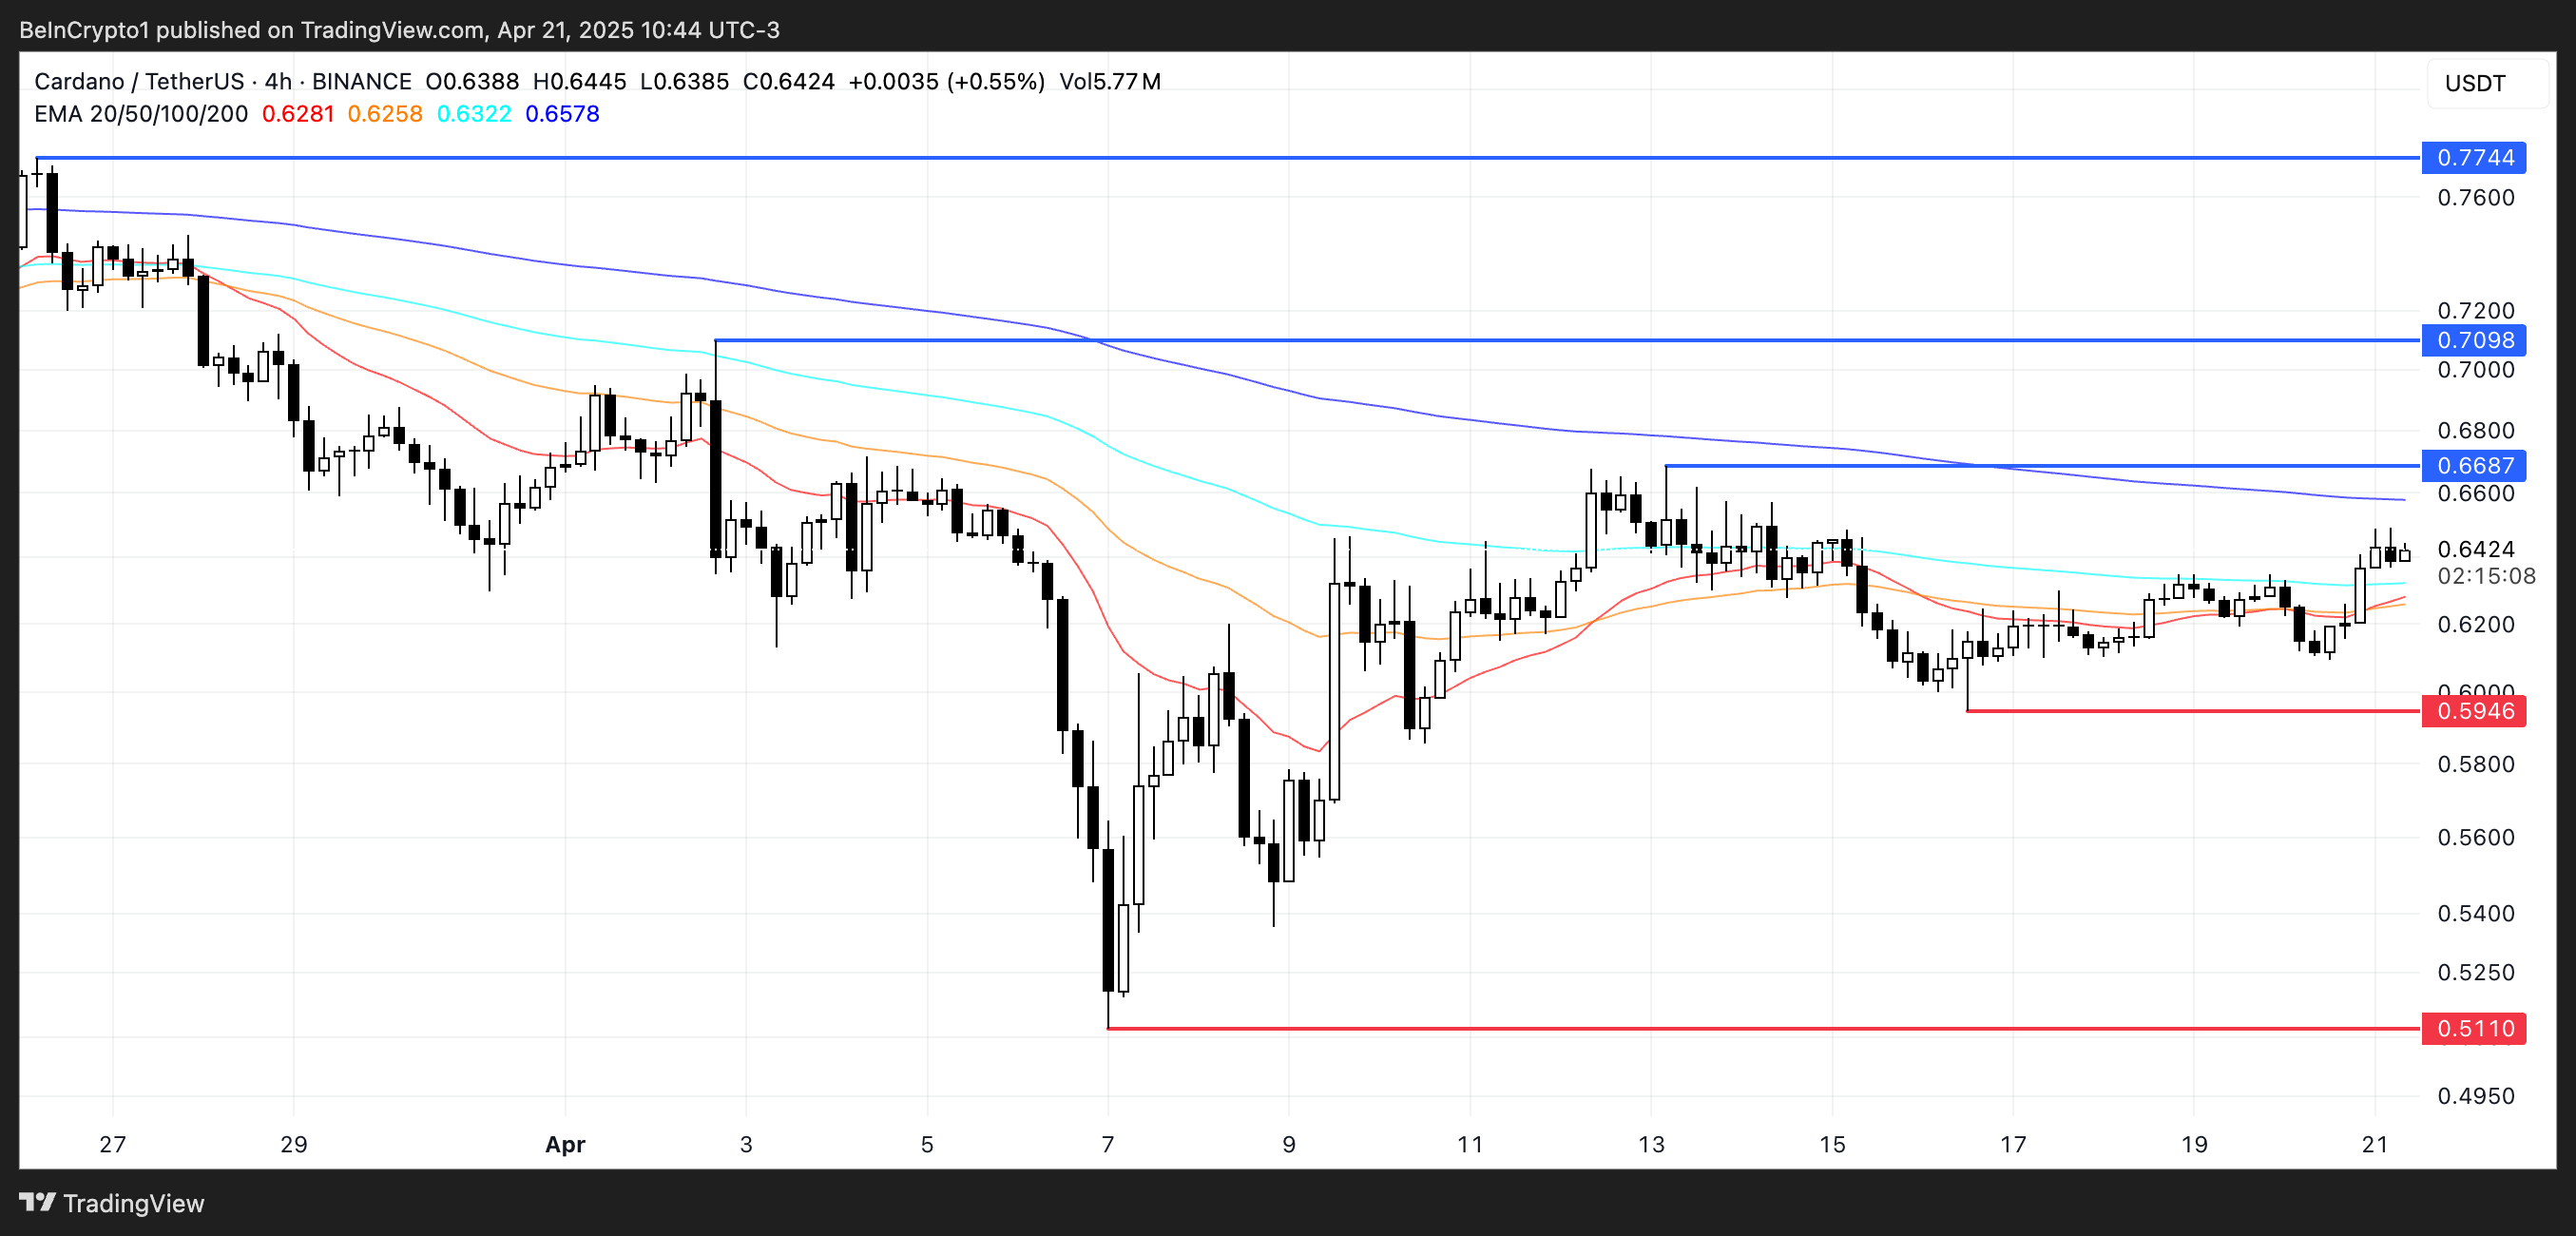
However, if ADA fails to maintain its upward trajectory and the momentum fades, downside risks remain in play.
A drop back toward the $0.594 support would be the first sign of weakness, and a breakdown below that level could expose the asset to deeper losses, with $0.511 as the next key support zone.
Price action around the $0.668 resistance will likely be the deciding factor.
Disclaimer
In line with the Trust Project guidelines, this price analysis article is for informational purposes only and should not be considered financial or investment advice. BeInCrypto is committed to accurate, unbiased reporting, but market conditions are subject to change without notice. Always conduct your own research and consult with a professional before making any financial decisions. Please note that our Terms and Conditions, Privacy Policy, and Disclaimers have been updated.

Crypto Firms Donated $85 million in Trump’s Inauguration

Ethereum to Emphasize Layer-1 Efficiency and UX in Upcoming Protocol Upgrades

XRP Surpasses Ethereum In This Major Metric After Outperforming For 6 Months

PumpFun Moves $13M SOL To Kraken as Solana Price Consolidates, What Next?

Cardano (ADA) Jumps 4% as Bullish Signals Emerge

Ark Invest Gains First Exposure to Solana With 3iQ ETF Bet

2.52 Million Altcoins Are Ruining Crypto’s Future

Animoca Brands Valuation Tanks 75% In Two Years, Here’s Why

Crypto exchange BingX hacked for $43 million

Are The Big Players Losing Interest?

Hong Kong’s Securities Association Tips Authorities On Crypto Self-Regulation

Coinbase cbBTC Set to go Live on Solana
2.52 Million Altcoins Are Ruining Crypto’s Future
Animoca Brands Valuation Tanks 75% In Two Years, Here’s Why
Crypto exchange BingX hacked for $43 million
Are The Big Players Losing Interest?
Hong Kong’s Securities Association Tips Authorities On Crypto Self-Regulation
Coinbase cbBTC Set to go Live on Solana
-
 Bitcoin19 hours ago
US Economic Indicators to Watch & Potential Impact on Bitcoin
-

 Market21 hours ago
Bitcoin Price Breakout In Progress—Momentum Builds Above Resistance
-

 Altcoin21 hours ago
Expert Says Solana Price To $2,000 Is Within Reach, Here’s How
-

 Market19 hours ago
Solana Rallies Past Bitcoin—Momentum Tilts In Favor of SOL
-
 Altcoin16 hours ago
Expert Reveals Why BlackRock Hasn’t Pushed for an XRP ETF
-

 Market18 hours ago
Vitalik Buterin Proposes to Replace EVM with RISC-V
-

 Market15 hours ago
Ethereum Price Clings to Support—Upside Break Could Trigger Rally
-

 Ethereum8 hours ago
Ethereum Analyst Sets $3,000 Target As Price Action Signals Momentum – Details