
Market
TRUMP Price Hits An All-Time Low As Traders Turn Bearish
The TRUMP cryptocurrency has plummeted to new lows, erasing most of its value within a month. This drawdown is the result of the ongoing tariff wars waged by the US President.
Bearish market conditions have intensified the downturn, preventing any meaningful rebound. As a result, traders are shifting their stance, now favoring short positions over long bets.
TRUMP Is Losing Traders’ Favor
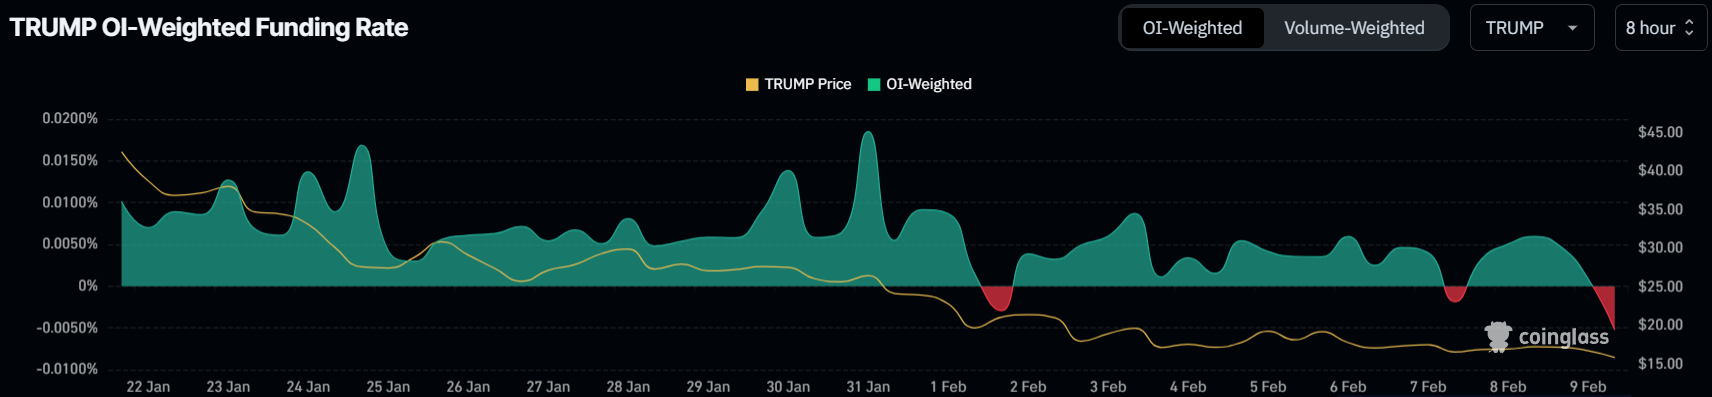
Funding rates for TRUMP have dropped to their lowest levels since mid-January, signaling a surge in short contracts. This shift suggests that traders are betting on further losses rather than a potential rebound. With fewer investors willing to enter long positions, selling pressure continues to dominate.
The lack of price stability has fueled bearish sentiment across the market. Traders are now capitalizing on the downtrend rather than waiting for a reversal. Without a change in market conditions, this negative outlook is likely to persist, keeping TRUMP’s price under pressure.
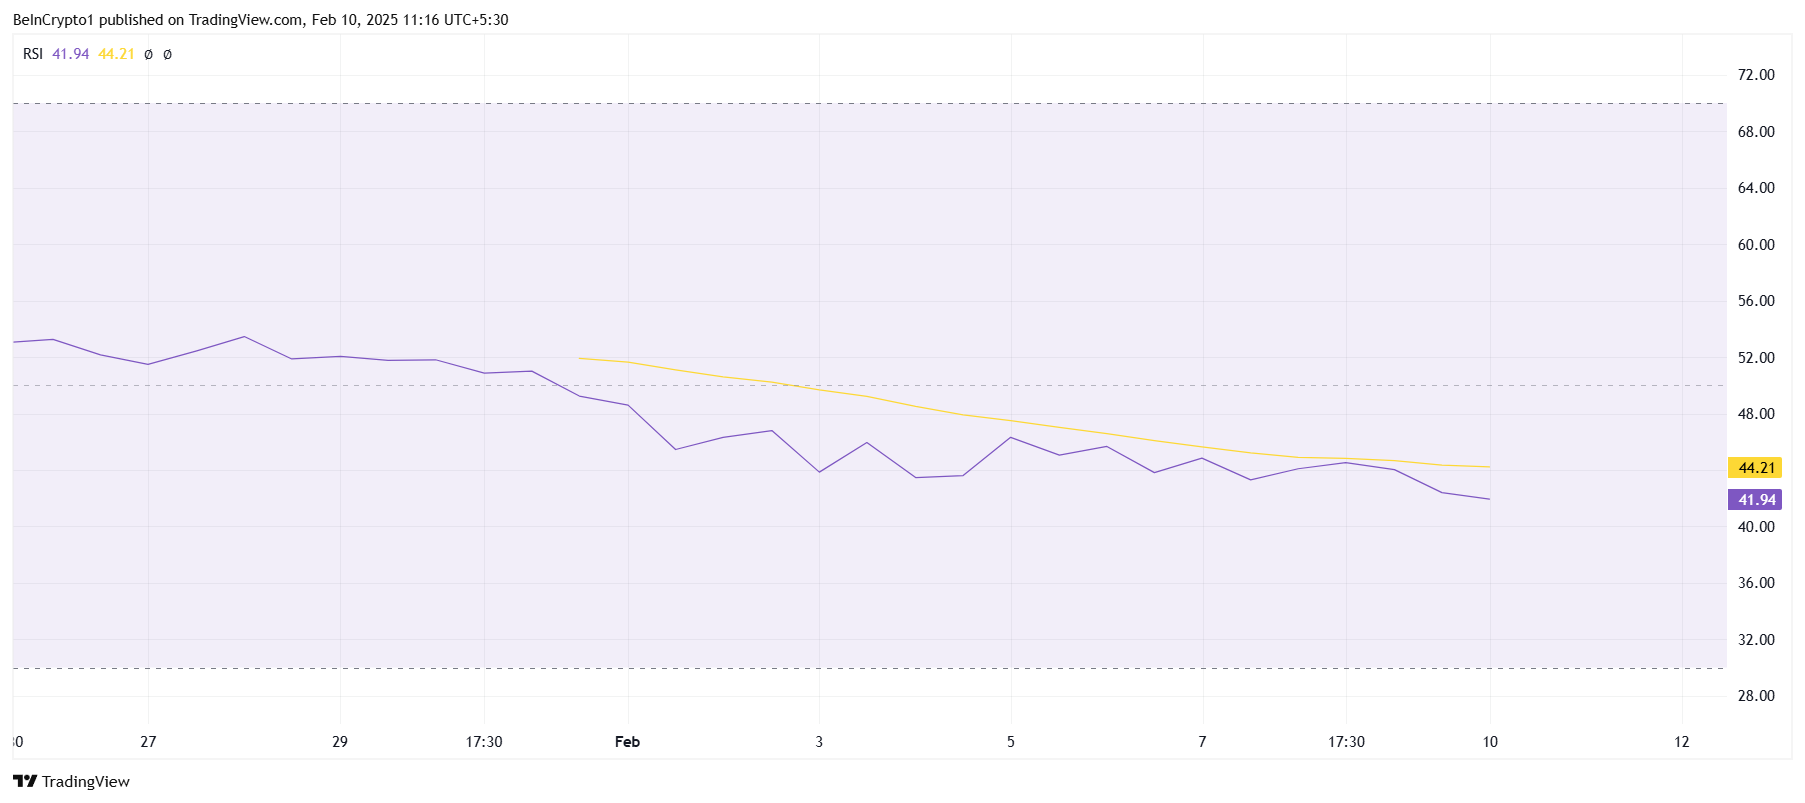
Technical indicators reflect the weakening momentum in TRUMP’s price action. The Relative Strength Index (RSI) has remained below the neutral 50.0 mark since early February, signaling continued bearish pressure. A deepening RSI suggests increasing selling activity with no immediate signs of relief.
A prolonged stay in the bearish zone often leads to extended downturns. TRUMP’s current trajectory shows no divergence, meaning the selling trend remains intact. Until the RSI moves above neutral territory, the probability of recovery remains low, and further declines could be expected.
TRUMP Price Prediction: New Lows Ahead
TRUMP’s price hit a new all-time low (ATL) of $14.29 today, marking an 11% drop in the last 24 hours. The sharp decline was triggered by the loss of $16.00 as support, which acted as a crucial level for maintaining stability. Without a swift recovery, further downside remains possible.
If TRUMP continues its downward trend, the price could soon slip below the $10 mark. A break under this psychological level would erase almost all of its value since its listing day. Such a move could intensify liquidation risks, pushing the price further into uncharted territory.
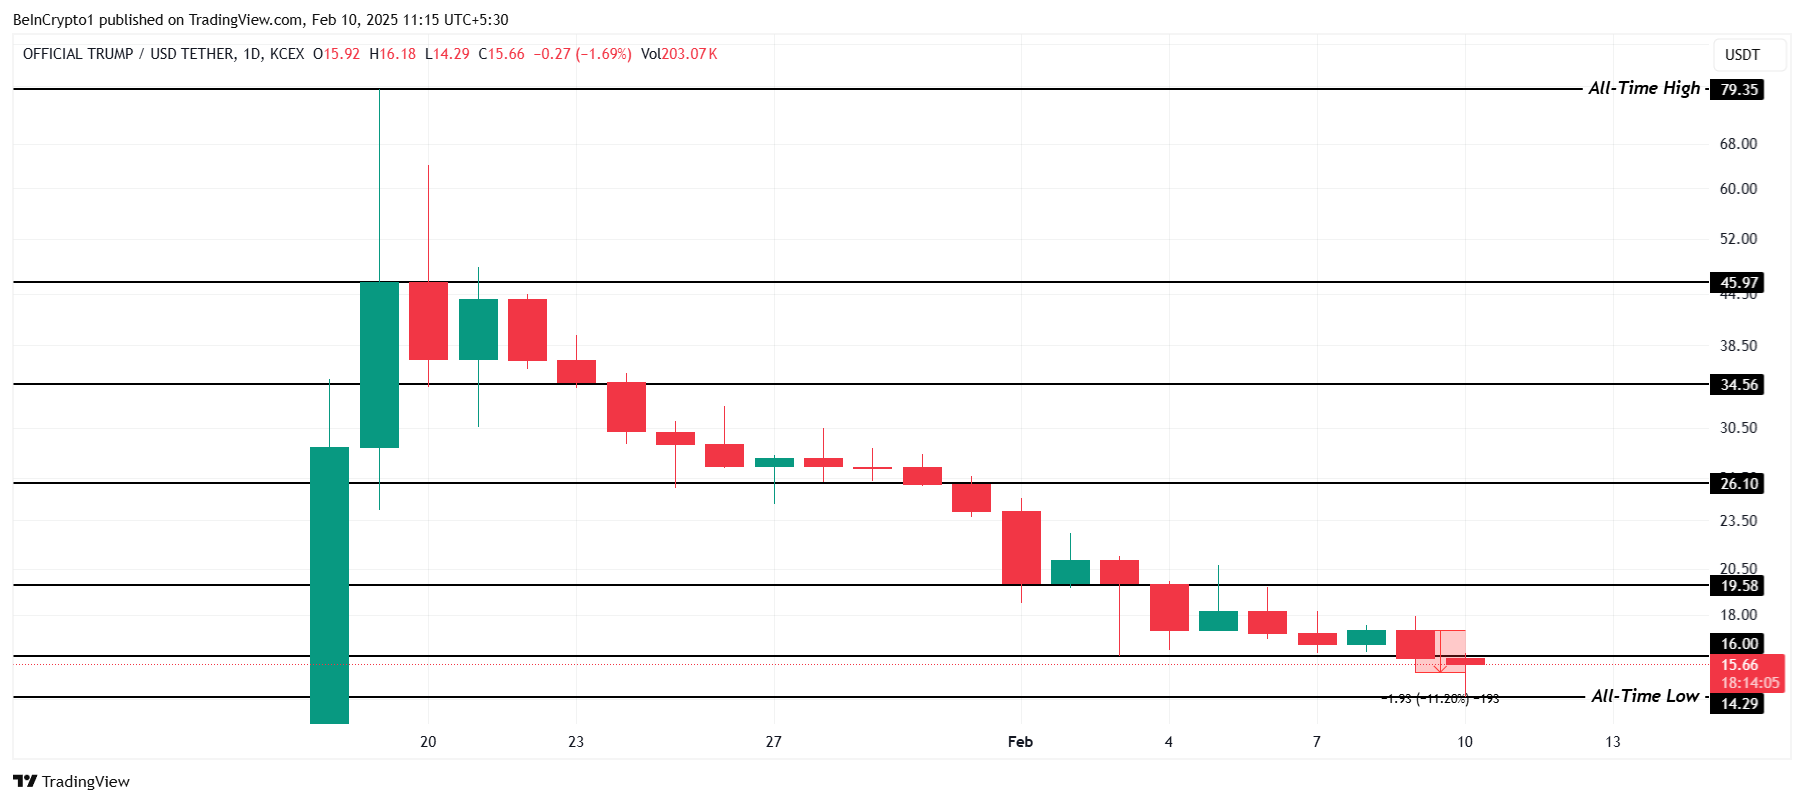
The only way to invalidate the bearish thesis is for TRUMP to reclaim the $19.58 support level. If buyers return, the price could rise toward $26, partially recovering recent losses. However, given the current sentiment, a strong, bullish reversal appears unlikely without a major shift in market conditions.
Disclaimer
In line with the Trust Project guidelines, this price analysis article is for informational purposes only and should not be considered financial or investment advice. BeInCrypto is committed to accurate, unbiased reporting, but market conditions are subject to change without notice. Always conduct your own research and consult with a professional before making any financial decisions. Please note that our Terms and Conditions, Privacy Policy, and Disclaimers have been updated.


Reason to trust
![]()
Strict editorial policy that focuses on accuracy, relevance, and impartiality
Created by industry experts and meticulously reviewed
The highest standards in reporting and publishing
Strict editorial policy that focuses on accuracy, relevance, and impartiality
Morbi pretium leo et nisl aliquam mollis. Quisque arcu lorem, ultricies quis pellentesque nec, ullamcorper eu odio.
Ethereum price started a fresh decline from the $1,690 zone. ETH is now consolidating and might decline further below the $1,580 support zone.
- Ethereum started a fresh decline after it failed to clear $1,700 and $1,720.
- The price is trading below $1,620 and the 100-hourly Simple Moving Average.
- There was a break below a new connecting bullish trend line with support at $1,625 on the hourly chart of ETH/USD (data feed via Kraken).
- The pair could start a fresh increase if it clears the $1,640 resistance zone.
Ethereum Price Faces Rejection
Ethereum price formed a base above $1,550 and started a fresh increase, like Bitcoin. ETH gained pace for a move above the $1,600 and $1,620 resistance levels.
The bulls even pumped the price above the $1,650 zone. A high was formed at $1,690 and the price recently corrected gains. There was a move below the $1,640 support zone. Besides, there was a break below a new connecting bullish trend line with support at $1,625 on the hourly chart of ETH/USD.
The price tested the 50% Fib retracement level of the upward move from the $1,472 swing low to the $1,690 high. Ethereum price is now trading below $1,625 and the 100-hourly Simple Moving Average.
On the upside, the price seems to be facing hurdles near the $1,620 level. The next key resistance is near the $1,640 level. The first major resistance is near the $1,650 level. A clear move above the $1,650 resistance might send the price toward the $1,690 resistance.

An upside break above the $1,690 resistance might call for more gains in the coming sessions. In the stated case, Ether could rise toward the $1,750 resistance zone or even $1,800 in the near term.
More Losses In ETH?
If Ethereum fails to clear the $1,640 resistance, it could start another decline. Initial support on the downside is near the $1,580 level. The first major support sits near the $1,555 zone and the 61.8% Fib retracement level of the upward move from the $1,472 swing low to the $1,690 high.
A clear move below the $1,555 support might push the price toward the $1,525 support. Any more losses might send the price toward the $1,450 support level in the near term. The next key support sits at $1,420.
Technical Indicators
Hourly MACD – The MACD for ETH/USD is gaining momentum in the bearish zone.
Hourly RSI – The RSI for ETH/USD is now below the 50 zone.
Major Support Level – $1,580
Major Resistance Level – $1,640

Semler Scientific (SMLR), a US-based medical technology company, has revealed plans to acquire more Bitcoin (BTC) despite facing a 5.0% unrealized loss on its previous BTC investments.
The firm has filed a Form S-3 registration with the US Securities and Exchange Commission (SEC) to raise up to $500 million through a securities offering. The proceeds would be allocated for general corporate purposes, including expanding its Bitcoin portfolio.
Semler Scientific Files S-3 to Fund Bitcoin Investments
According to the official filing, the firm plans to issue common stock, preferred stock, debt securities, and warrants as part of the securities offering. The SEC filing does not specify the exact amount allocated for Bitcoin purchases. Nonetheless, Semler’s recent activity suggests a strong focus on cryptocurrency.
“We have not determined the amount of net proceeds to be used specifically for such purposes. As a result, management will retain broad discretion over the allocation of the net proceeds of any offering,” the filing read.
This move follows Semler’s previous acquisition of 871 BTC for $88.5 million at an average price of $101,616 per Bitcoin. The purchases were made between January 11 and February 3.
The acquisition increased Semler’s total Bitcoin holdings to 3,192 BTC. The holdings worth $266.1 million represent 80.6% of the company’s total market capitalization of 330.1 million. This indicates that a significant portion of its value is tied to its Bitcoin investments.
“From January 1, 2025, to February 3, 2025, Semler Scientific’s BTC Yield was 21.9%. From July 1, 2024 (the first full quarter after Semler Scientific adopted its bitcoin treasury strategy) to February 3, 2025, Semler Scientific’s BTC Yield was 152.2%,” the firm revealed.
However, the tides have shifted since then. According to Bitcoin Treasuries, Semler’s average BTC acquisition cost is $87,850 per coin. As of the latest data from BeInCrypto, Bitcoin’s market price stood at $83,397, placing Semler at a 5.0% loss on its investment.

Previously, BeInCrypto noted that the losses surged to 14.7% as BTC fell below the $80,000 mark. Despite this, Semler’s leadership appears committed to its Bitcoin strategy, viewing the cryptocurrency as a long-term store of value.
Semler’s strategic push into Bitcoin mirrors those of other firms, such as Strategy (formerly MicroStrategy) and Metaplanet. Earlier this week, the firms acquired BTC worth $285 million and $26.3 million, respectively.
However, Semler’s decision to double down on Bitcoin comes amid financial and legal challenges. On April 15, the company announced a preliminary $29.75 million settlement with the US Department of Justice (DOJ) to resolve allegations of violating federal anti-fraud laws related to marketing its QuantaFlo product.
The settlement is pending final approval. Yet, it adds pressure to Semler’s balance sheet as it navigates its ambitious fundraising and Bitcoin investment plans.
Disclaimer
In adherence to the Trust Project guidelines, BeInCrypto is committed to unbiased, transparent reporting. This news article aims to provide accurate, timely information. However, readers are advised to verify facts independently and consult with a professional before making any decisions based on this content. Please note that our Terms and Conditions, Privacy Policy, and Disclaimers have been updated.

Cardano price started a fresh decline from the $0.680 zone. ADA is consolidating near $0.620 and remains at risk of more losses.
- ADA price started a recovery wave from the $0.5850 zone.
- The price is trading below $0.640 and the 100-hourly simple moving average.
- There is a connecting bearish trend line forming with resistance at $0.6350 on the hourly chart of the ADA/USD pair (data source from Kraken).
- The pair could start another increase if it clears the $0.640 resistance zone.
Cardano Price Faces Resistance
In the past few sessions, Cardano saw a fresh decline from the $0.680 level, like Bitcoin and Ethereum. ADA declined below the $0.650 and $0.640 support levels.
A low was formed at $0.6040 and the price is now consolidating losses. There was a minor move above the $0.6120 level. The price tested the 23.6% Fib retracement level of the recent decline from the $0.6481 swing high to the $0.6040 low.
Cardano price is now trading below $0.640 and the 100-hourly simple moving average. On the upside, the price might face resistance near the $0.6260 zone and the 50% Fib retracement level of the recent decline from the $0.6481 swing high to the $0.6040 low.
The first resistance is near $0.6350. There is also a connecting bearish trend line forming with resistance at $0.6350 on the hourly chart of the ADA/USD pair. The next key resistance might be $0.6480.

If there is a close above the $0.6480 resistance, the price could start a strong rally. In the stated case, the price could rise toward the $0.680 region. Any more gains might call for a move toward $0.70 in the near term.
Another Drop in ADA?
If Cardano’s price fails to climb above the $0.6350 resistance level, it could start another decline. Immediate support on the downside is near the $0.6040 level.
The next major support is near the $0.60 level. A downside break below the $0.60 level could open the doors for a test of $0.580. The next major support is near the $0.5550 level where the bulls might emerge.
Technical Indicators
Hourly MACD – The MACD for ADA/USD is gaining momentum in the bearish zone.
Hourly RSI (Relative Strength Index) – The RSI for ADA/USD is now below the 50 level.
Major Support Levels – $0.6040 and $0.580.
Major Resistance Levels – $0.6350 and $0.6480.

Ethereum Price Dips Again—Time to Panic or Opportunity to Buy?

Did Ethereum Survive The Storm? Analyst Eyes Breakout Next

Bitcoin & Others Slip As Trump Imposes Up To 245% Tariff On China

Semler Doubles Down on Bitcoin Investments Despite Losses

China Liquidates Seized Crypto to Boost Struggling Treasury

Expert Reveals Current Status Of 9 Ripple ETFs

2.52 Million Altcoins Are Ruining Crypto’s Future

Animoca Brands Valuation Tanks 75% In Two Years, Here’s Why

Crypto exchange BingX hacked for $43 million

Are The Big Players Losing Interest?

Hong Kong’s Securities Association Tips Authorities On Crypto Self-Regulation

Coinbase cbBTC Set to go Live on Solana
2.52 Million Altcoins Are Ruining Crypto’s Future
Animoca Brands Valuation Tanks 75% In Two Years, Here’s Why
Crypto exchange BingX hacked for $43 million
Are The Big Players Losing Interest?
Hong Kong’s Securities Association Tips Authorities On Crypto Self-Regulation
Coinbase cbBTC Set to go Live on Solana
-

 Market24 hours ago
Can Pi Network Avoid a Similar Fate?
-
 Altcoin24 hours ago
Binance Delists This Crypto Causing 40% Price Crash, Here’s All
-

 Market23 hours ago
Ethereum Price Consolidation Hints at Strength—Is a Move Higher Coming?
-

 Altcoin19 hours ago
Whispers Of Insider Selling As Mantra DAO Relocates Nearly $27 Million In OM To Binance
-

 Market18 hours ago
Trump Family Plans Crypto Game Inspired by Monopoly
-

 Bitcoin23 hours ago
Bolivia Reverses Crypto-for-Fuel Plan Amid Energy Crisis
-

 Market22 hours ago
Pi Network Price Rise To $1 is Now In The Hands Of Bitcoin
-

 Market19 hours ago
Forget XRP At $3, Analyst Reveals How High Price Will Be In A Few Months
