
Market
Top Analyst Reveals Timing For $10-$20 Price Milestone
XRP, the cryptocurrency associated with Ripple, has been locked in a lengthy period of consolidation, trading between $0.300 and $0.600 for the past seven years.
Despite a brief surge during the 2021 bull run that saw XRP reach a three-year high of $1.9 in April, the token has since returned to its range, lacking the bullish momentum to overcome upper resistance levels.
However, some crypto analysts are now predicting a major uptrend for XRP in the coming months, potentially propelling it to new heights.
Analysts Anticipate XRP Breakout
A technical analyst using the pseudonym “U-COPY” on the social media site X (formerly Twitter) suggests that XRP could experience significant movement between May 15 and August.
U-COPY points out that XRP has been slowly moving up from its previous low at $0.46 and is nearing the end of a long triangle formation, which has been in accumulation since 2018.
The analyst believes that XRP’s real potential will be revealed in the fully formed bull cycle, with the token possibly experiencing substantial growth by the end of the year.
Related Reading
Supporting this bullish outlook, another analyst, Armando Pantoja, proposes that the crypto bull run could begin in September or October 2025, with XRP potentially reaching a price of $0.75.
Pantoja further suggests that if former US President Trump wins the election and the Securities and Exchange Commission (SEC) eases its stance on cryptocurrencies, XRP could be propelled to higher levels.
This change in regulatory dynamics, combined with the ongoing legal battle between Ripple and the SEC, may increase the likelihood of XRP gaining approval for an exchange-traded fund (ETF) similar to Bitcoin.
Pantoja outlines a price range of $1-2 for an XRP ETF announcement in early 2025. If interest rates are cut multiple times during the same period, XRP could potentially reach $5-10. Ultimately, Pantoja predicts the possibility of XRP hitting $10-$20 by the fourth quarter of 2025 or the first quarter of 2026.
‘Buy the Dip’ Opportunity?
According to market intelligence platform Santiment, The XRP Ledger (XRPL) has recently witnessed a notable increase in the movement of dormant tokens, signaling a potential shift in market dynamics for the token.
Coinciding with the opening of May, the company’s Token Age Consumed metric reveals a spike in the transfer of old coins, reminiscent of a similar occurrence in April, just before a significant downturn in the market. During that period, XRP experienced a sharp decline in value, dropping by 16%.
However, in contrast to the previous event, Santiment suggests that there is a “compelling argument” that this current surge in old coin movement might be attributed to the interest of key stakeholders looking to “buy the dip.”
Related Reading
Furthermore, it is worth noting the growing open interest in exchanges, which has recently reached a three-week high. This uptick in open interest indicates increased active positions in XRP, potentially reflecting growing market participation and heightened trading activity.
Considering these factors together—the surge in dormant token activity, the potential buy-the-dip interest from key stakeholders, and the rising open interest on exchanges—there appears to be a shift in sentiment surrounding XRP.
At press time, the seventh-largest cryptocurrency trades at $0.5020, down over 7% in the past week alone and 1% in the past 24 hours.
Featured image from Shutterstock, chart from TradingView.com


Pi Network continues to struggle in the market as its price remains on a downward trajectory. Despite earlier optimism, investors have been increasingly skeptical of the coin, contributing to a prolonged downtrend.
The uncertainty around its value suggests Pi Network may be headed for a new all-time low (ATL).
Pi Network Witnesses Outflows
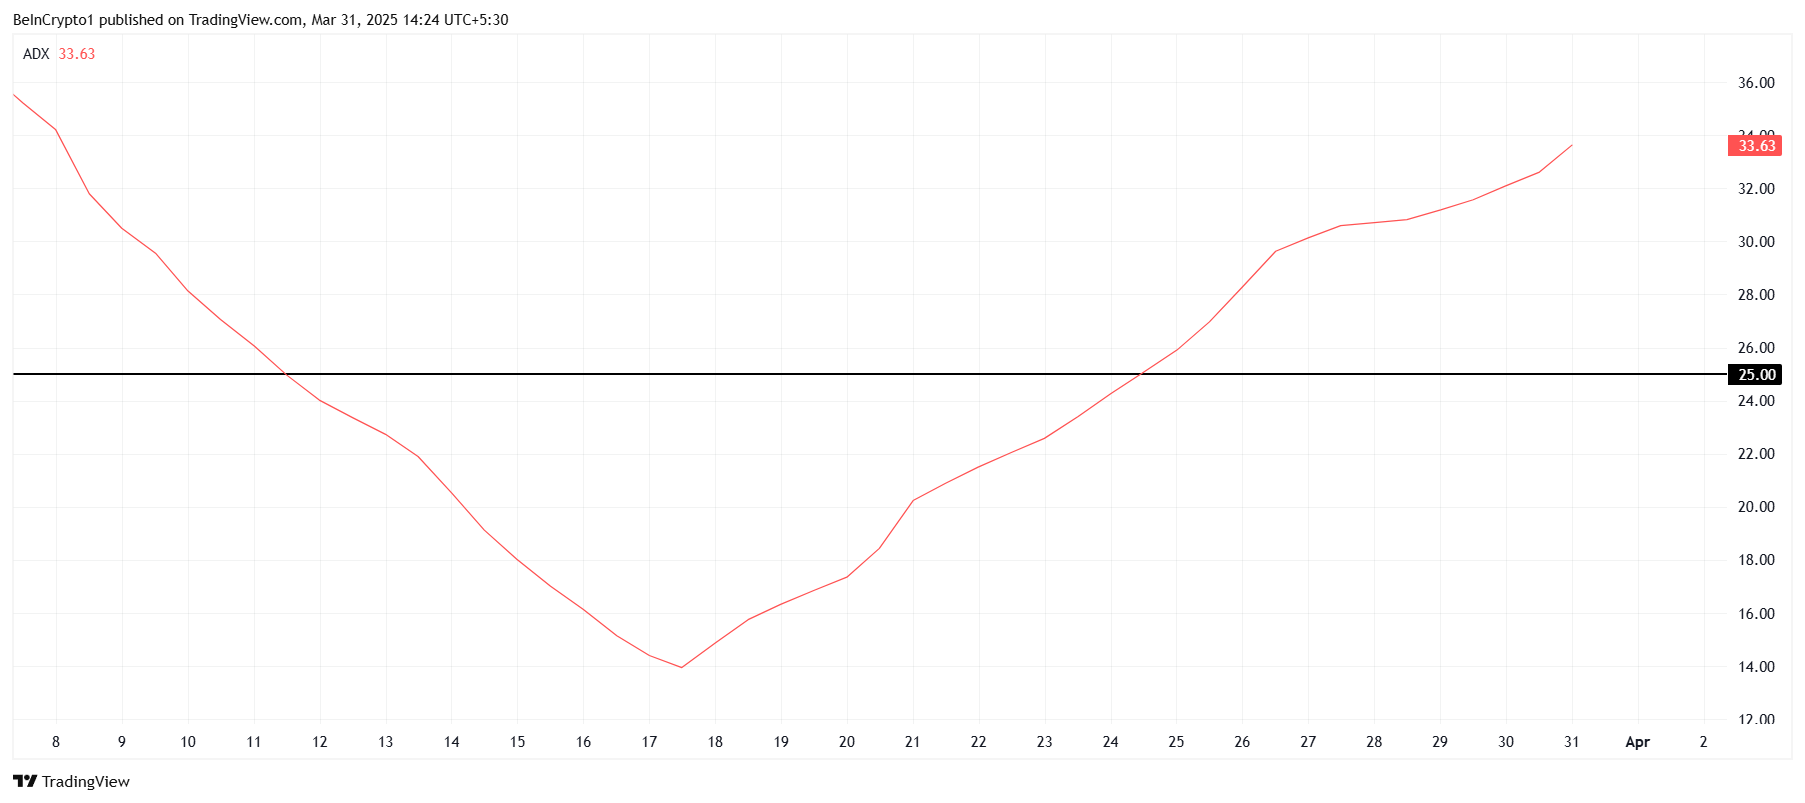
The ADX (Average Directional Index) has recently crossed the 25.0 threshold, indicating that the current bearish trend is gaining momentum. This is a concerning signal for Pi Network’s price, as the rising bearishness suggests that it will be increasingly difficult for the cryptocurrency to recover in the short term. With the ADX pointing towards sustained negative market forces, the pressure on Pi Network’s price will likely intensify as the token nears its previous ATL.
The growing strength of the bearish trend is compounded by investor uncertainty, with many questioning the token’s long-term viability. This uncertainty can lead to further selling and a lack of fresh buying support, making it even harder for Pi Network to find a solid foundation for recovery.
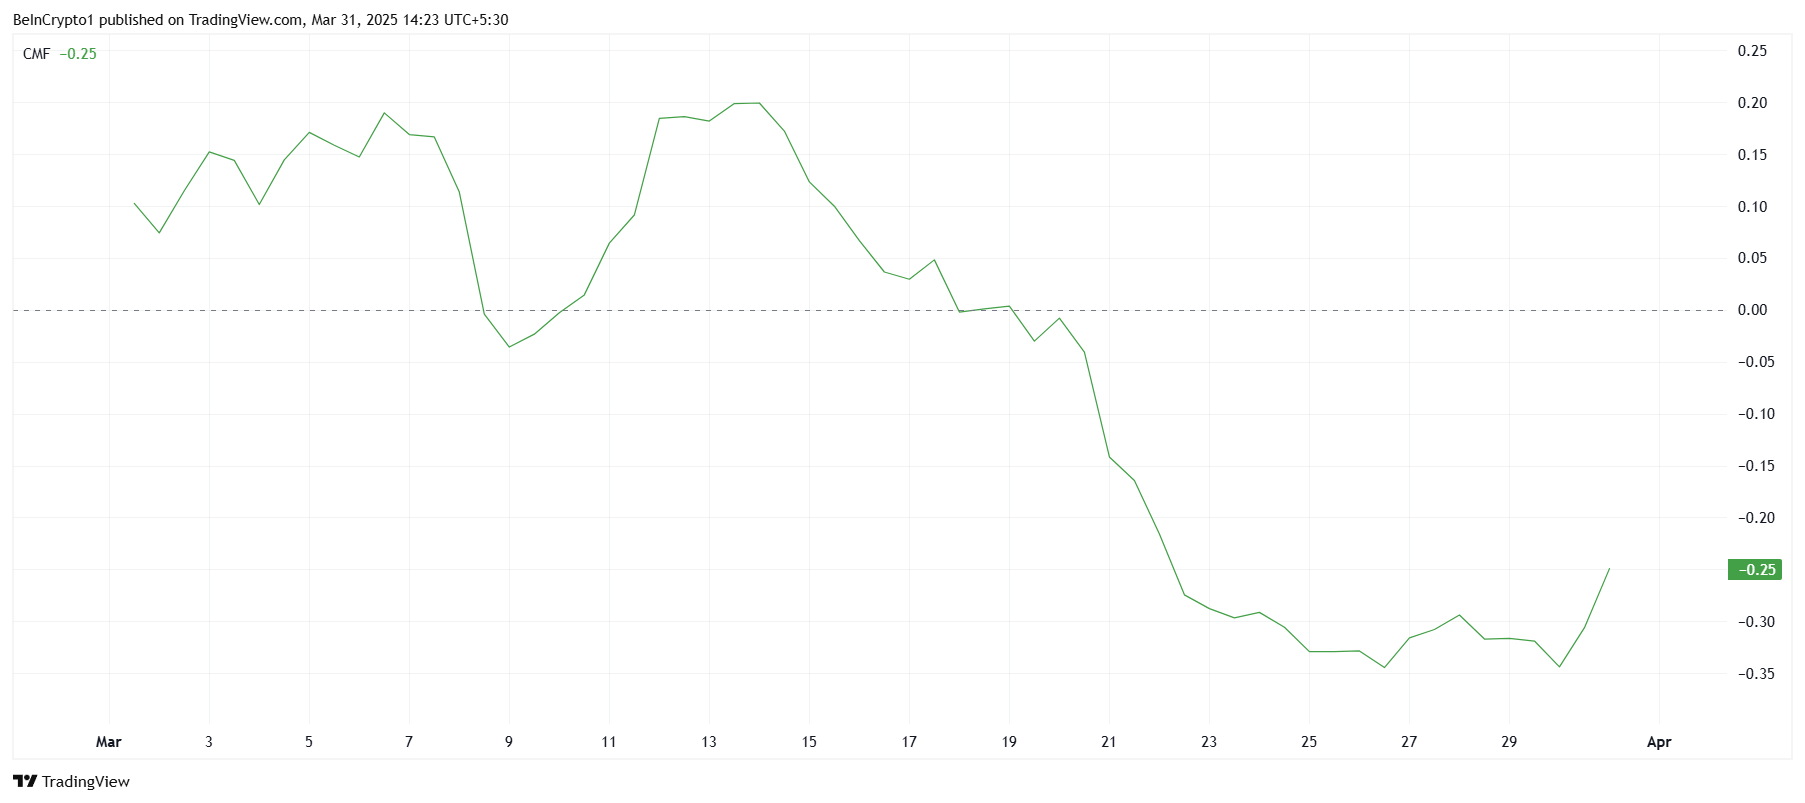
Pi Network’s macro momentum also paints a grim picture for the altcoin. The Chaikin Money Flow (CMF) indicator, which measures the volume of money flowing into and out of a coin, has been deeply negative. Although there has been a slight uptick, the indicator remains in the negative zone, signaling that investors are still reluctant to buy into the token.
The slight increase in CMF reflects minor capital inflows, but this could be short-lived if the skepticism persists. With investors hesitating and outflows continuing, Pi Network’s price faces significant challenges. The current trend suggests that more outflows could occur if the coin reaches a new ATL.
PI Price Nears New Low
Pi Network is currently trading at $0.70, just above its ATL of $0.62. The altcoin saw a 12.8% decline over the past 24 hours after failing to reclaim $0.87 as support. This failure to regain previous support levels shows the continued lack of investor confidence.
If the bearish trend persists, Pi Network is likely to fall through the $0.62 support level, potentially dropping to $0.50. A new ATL could be set as the market sentiment continues to weigh heavily on the price, leading to further losses for existing investors.
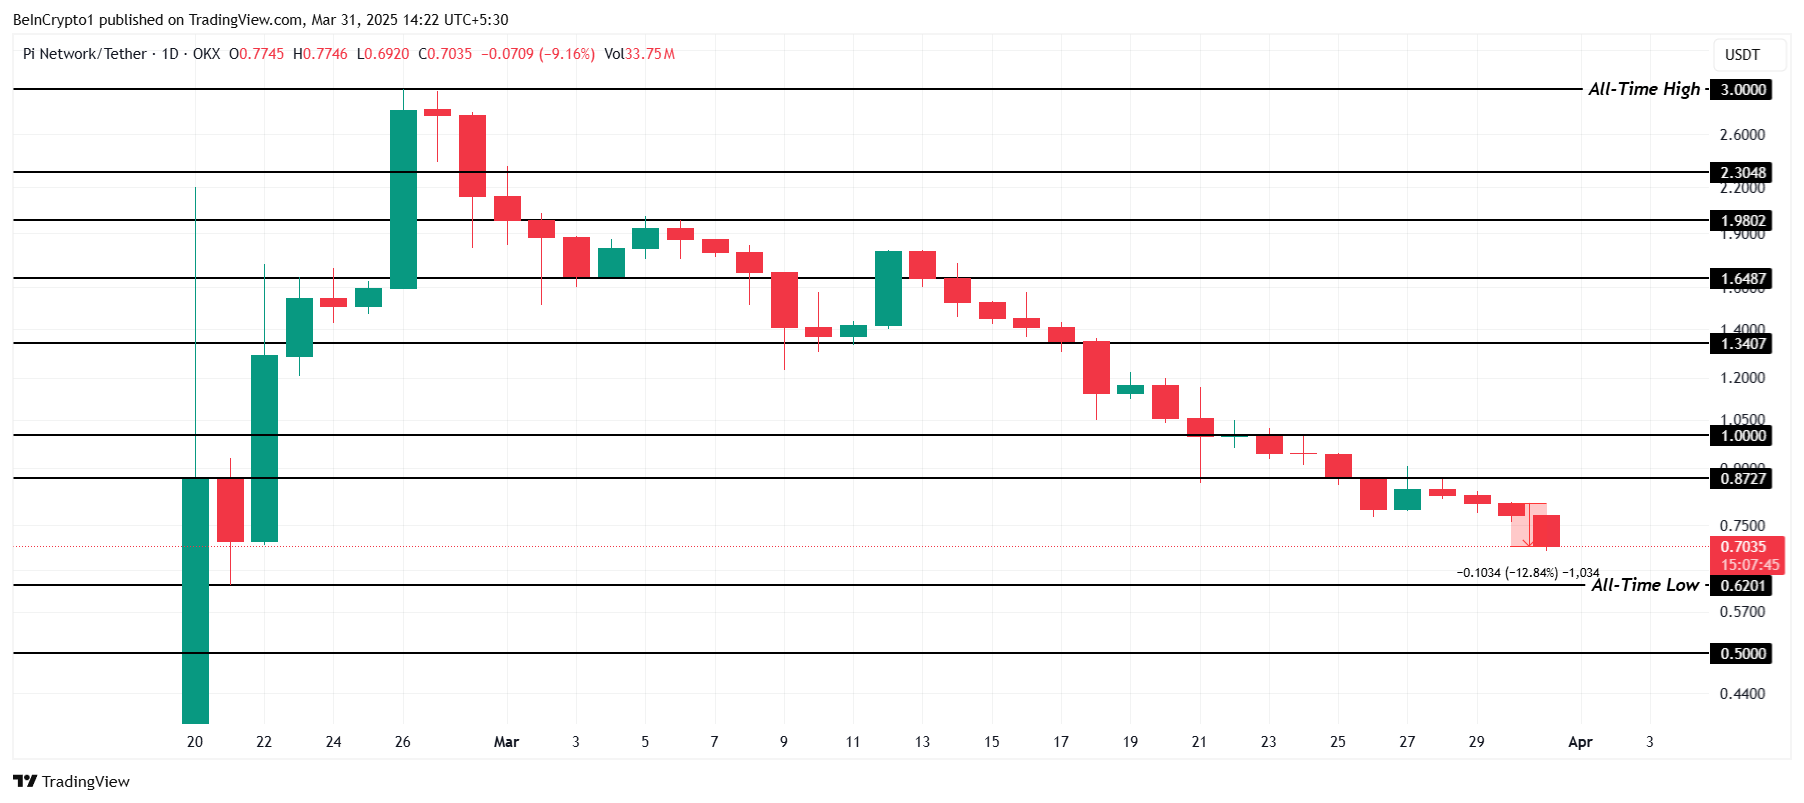
The only way to reverse the bearish outlook is for investors to change their approach and capitalize on low prices. Increased inflows could potentially drive Pi Network’s price back above $0.87, and if it surpasses the $1.00 level, it would reclaim critical support and signal a possible recovery for the altcoin.
Disclaimer
In line with the Trust Project guidelines, this price analysis article is for informational purposes only and should not be considered financial or investment advice. BeInCrypto is committed to accurate, unbiased reporting, but market conditions are subject to change without notice. Always conduct your own research and consult with a professional before making any financial decisions. Please note that our Terms and Conditions, Privacy Policy, and Disclaimers have been updated.

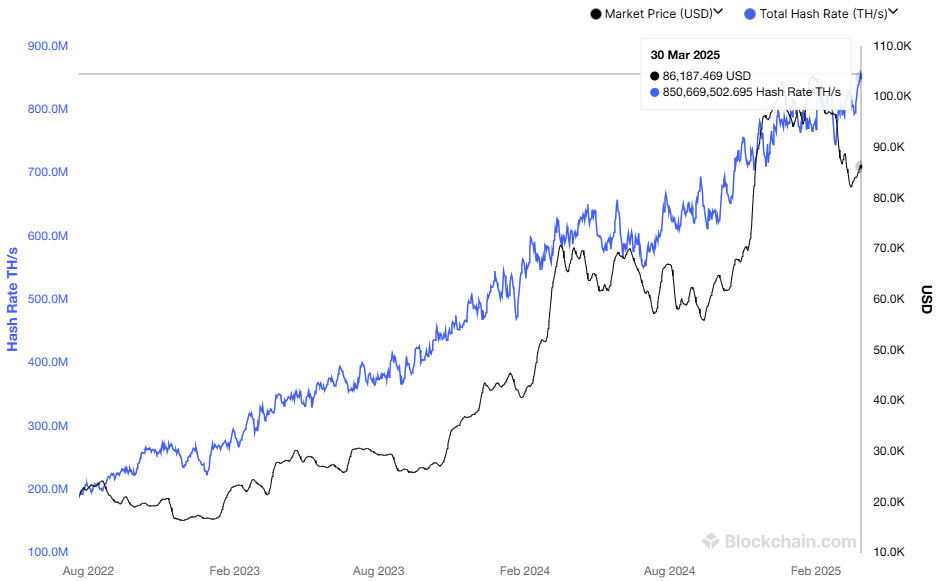
The Bitcoin mining industry is becoming increasingly competitive as the network’s hashrate reaches an all-time high (ATH). At the end of March 2025, Bitcoin’s hashrate hit 850 million TH/s.
However, alongside this impressive growth, the industry is struggling with rising production costs and new tariff barriers, particularly in the US. These factors are putting significant pressure on mining companies and could reshape the sector’s future.
Hashrate Surges, Mining Costs Soar
Bitcoin’s hashrate measures the total computing power used by miners to secure the network and validate transactions. It is expressed in terahashes per second (TH/s), representing the number of hash calculations the network performs every second.
According to Blockchain.com, Bitcoin’s hashrate surpassed 850 million TH/s in March. This increase reflects a rise in miners joining the network and growing confidence in Bitcoin’s value and security.
“Each time the network gets stronger, Bitcoin becomes harder to attack, harder to ignore, and more justified in commanding a higher valuation. This isn’t just code. It’s economic gravity. Bitcoin has become the most secure monetary network humanity has ever seen. And it’s only getting stronger.” — Thomas Jeegers, CFO & COO of Relai commented.
Despite this surge in hashrate, mining profits are not rising accordingly. According to a report from Macromicro, the cost of mining one Bitcoin has doubled since early 2024, now reaching $87,000. The main drivers behind this increase are rising electricity prices and the high operational costs of specialized mining hardware (ASICs).
With Bitcoin’s price fluctuating, many mining companies risk operating at a loss unless they optimize their efficiency. This challenge is particularly severe for smaller miners, who lack the scale advantages or access to cheap electricity that larger firms enjoy.
Tariff Challenges and Dependence on Chinese Hardware
Another major obstacle for Bitcoin miners is trade restrictions, particularly in the US. According to CoinMetrics, ASIC miners produced by Bitmain, a Chinese company, account for approximately 59%–76% of Bitcoin’s total hashrate.
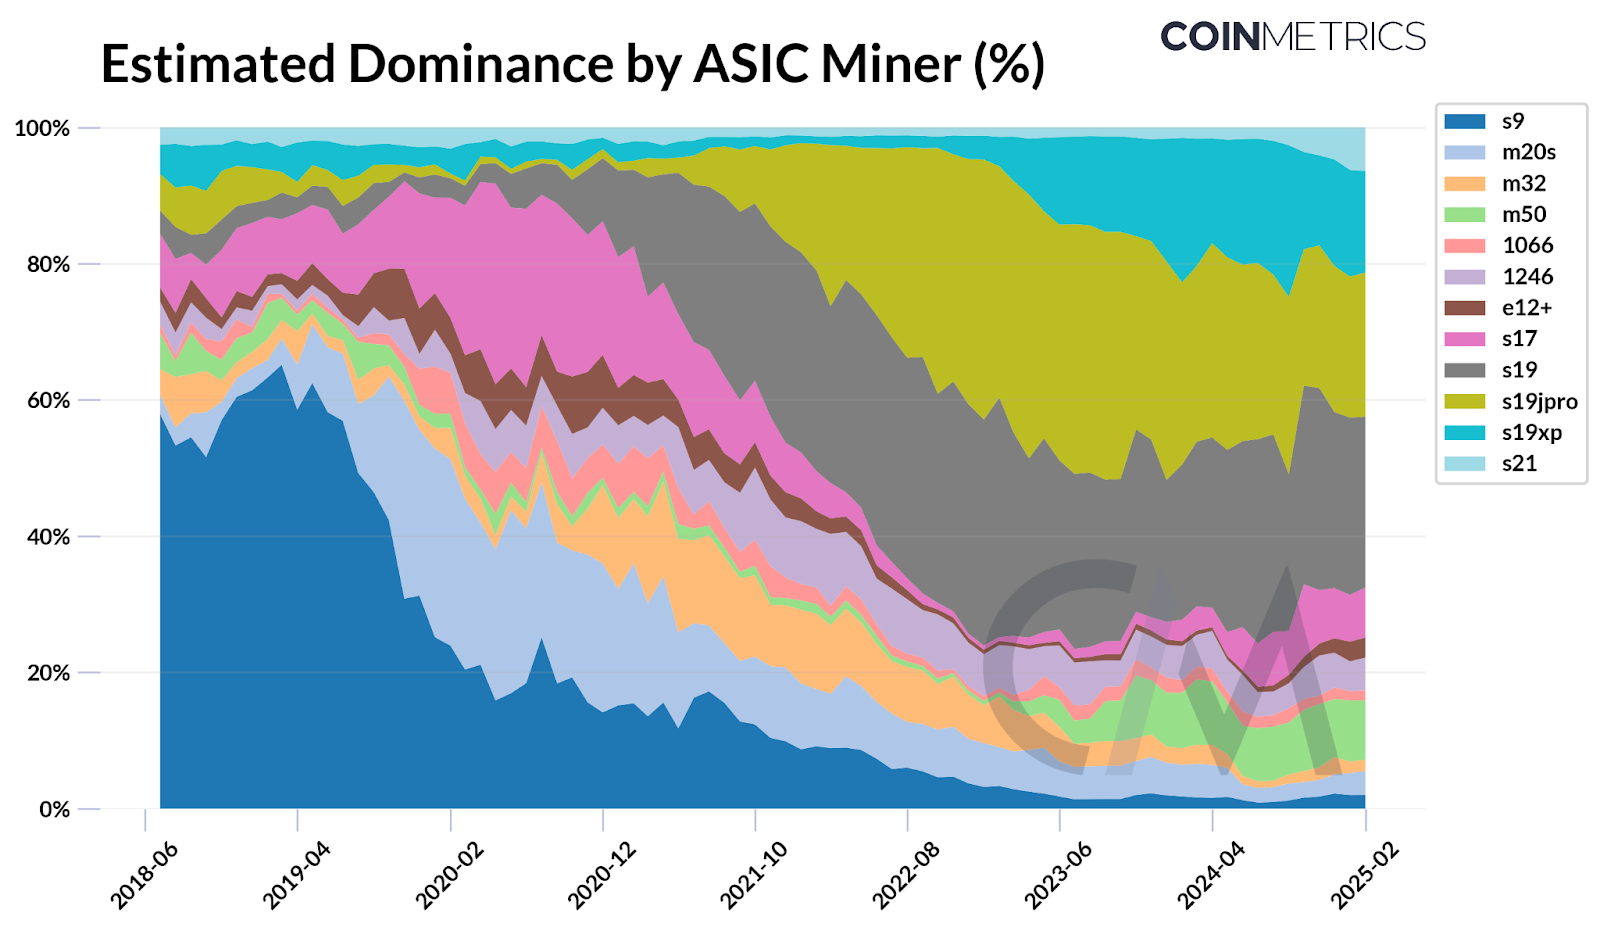
Bitmain has long been a dominant player in mining hardware, with popular models like the Antminer S19 and S21 known for their high efficiency. However, in early 2025, some US mining companies experienced delays in receiving Bitmain shipments due to tighter customs controls and new tariffs on Chinese imports.
“With Bitmain accounting for a majority of Bitcoin’s network hashrate, reliance on a single manufacturer, despite having distributed supply chains, presents a potential risk. Since Bitmain is primarily based in China, its dominance highlights how geopolitical dependencies can affect the stability of mining operations,” CoinMetrics reported.
These tariffs are not new. According to SCMP, the US has imposed duties of up to 27.6% on imported mining equipment from China since 2018.
However, recent measures indicate increasing regulatory scrutiny and trade pressures, further raising import costs for mining hardware. This inflates operational expenses for US-based miners and disrupts supply chains, limiting their ability to scale as global hashrate rises.
Recently, Hut 8 Corp., a Bitcoin mining and high-performance computing infrastructure firm, partnered with Eric Trump and Donald Trump Jr. to establish American Bitcoin Corp.
The company aims to become the largest and most efficient pure-play Bitcoin mining operation globally while building a strong strategic Bitcoin reserve. This move highlights the increasing interest from US institutional investors in the competitive mining industry.
Disclaimer
In adherence to the Trust Project guidelines, BeInCrypto is committed to unbiased, transparent reporting. This news article aims to provide accurate, timely information. However, readers are advised to verify facts independently and consult with a professional before making any decisions based on this content. Please note that our Terms and Conditions, Privacy Policy, and Disclaimers have been updated.

As the crypto market enters Q2 2025, both investors and traders are anticipating a shift from bearish to bullish momentum. This change is essential for altcoins to recover, as many are currently facing challenges in bouncing back. However, growth potential remains for select tokens in the short term.
BeInCrypto has analyzed three altcoins to watch closely as April begins, highlighting the catalysts that could influence their price movements.
THORChain (RUNE)
RUNE’s price is currently at $1.117, hovering just above the $1.110 support level. For a potential rebound, the altcoin needs to reclaim $1.198 as support. Investor sentiment will play a crucial role in whether this upward movement materializes, leading to possible gains for THORChain (RUNE).
THORChain’s 3.4.0 upgrade is scheduled to take place this week, bringing significant improvements to the network. The upgrade could drive positive market sentiment, helping RUNE reclaim $1.198 as support. This momentum may push RUNE towards $1.396, aiding in recovering recent losses and supporting continued price growth.
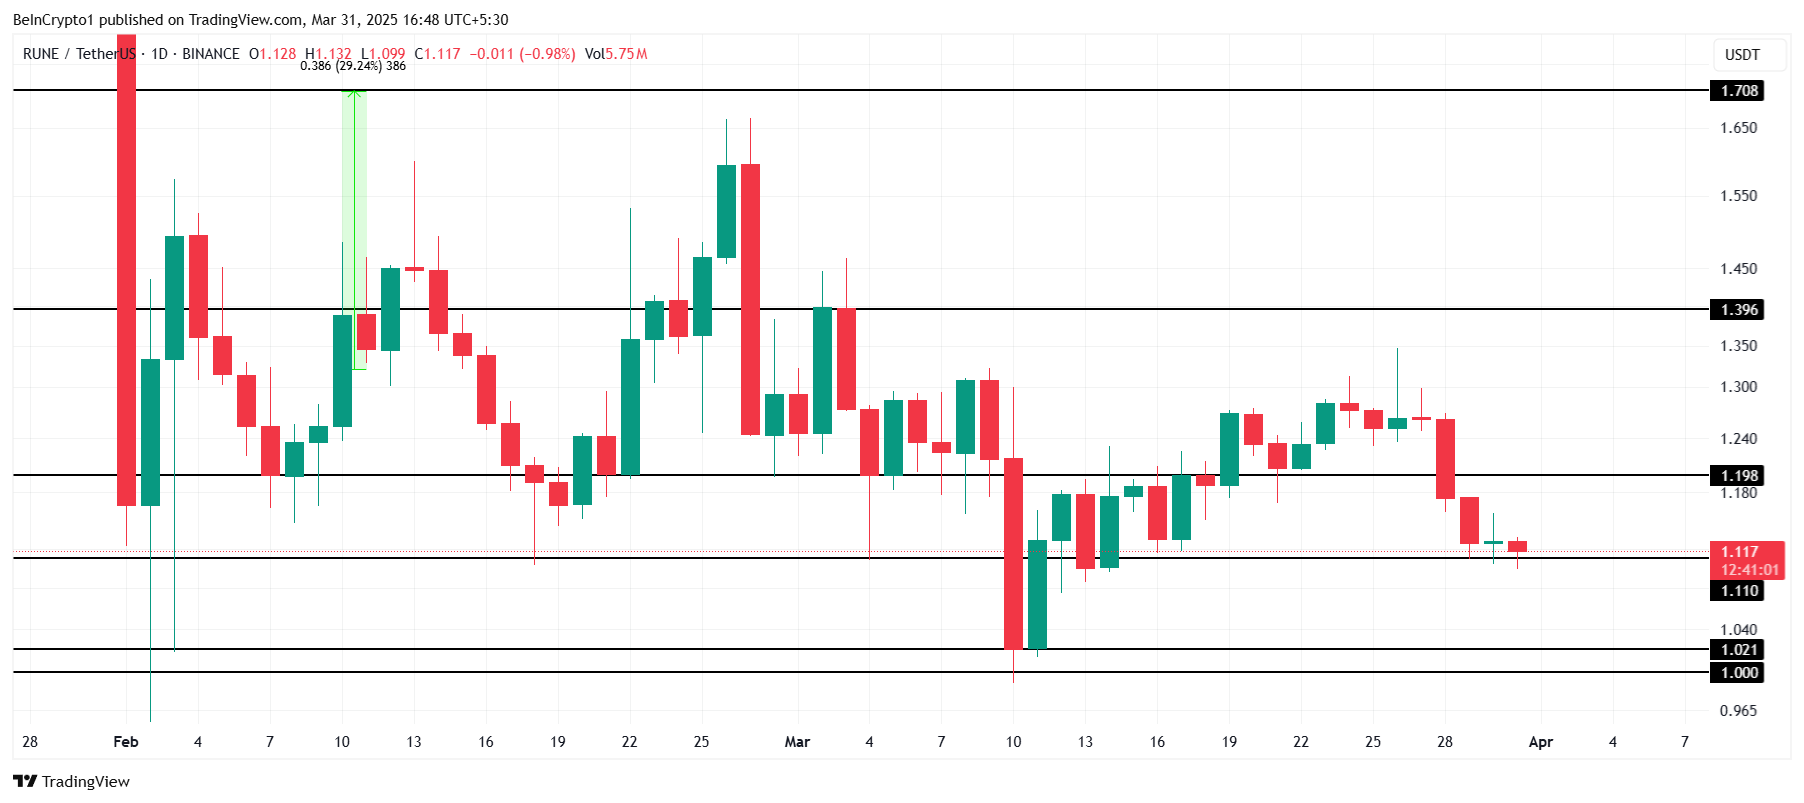
If the support at $1.110 is broken, RUNE may fall to $1.021, pushing it closer to losing the critical $1.000 level. A failure to maintain support could signal a bearish trend, invalidating the bullish outlook.
Artificial Superintelligence Alliance (FET)
FET price saw a 20% decline over the last five days, dropping to $0.452 after losing the support of $0.458. This decline puts the altcoin under pressure. However, the doors for potential recovery are open due to upcoming developments within the network.
The Artificial Superintelligence Alliance network is set for a mainnet upgrade this week, bringing new features to the ASI-1 Mini. This upgrade is expected to act as a catalyst for the price, pushing it toward the key resistance levels of $0.524 and $0.572 to recover recent losses.
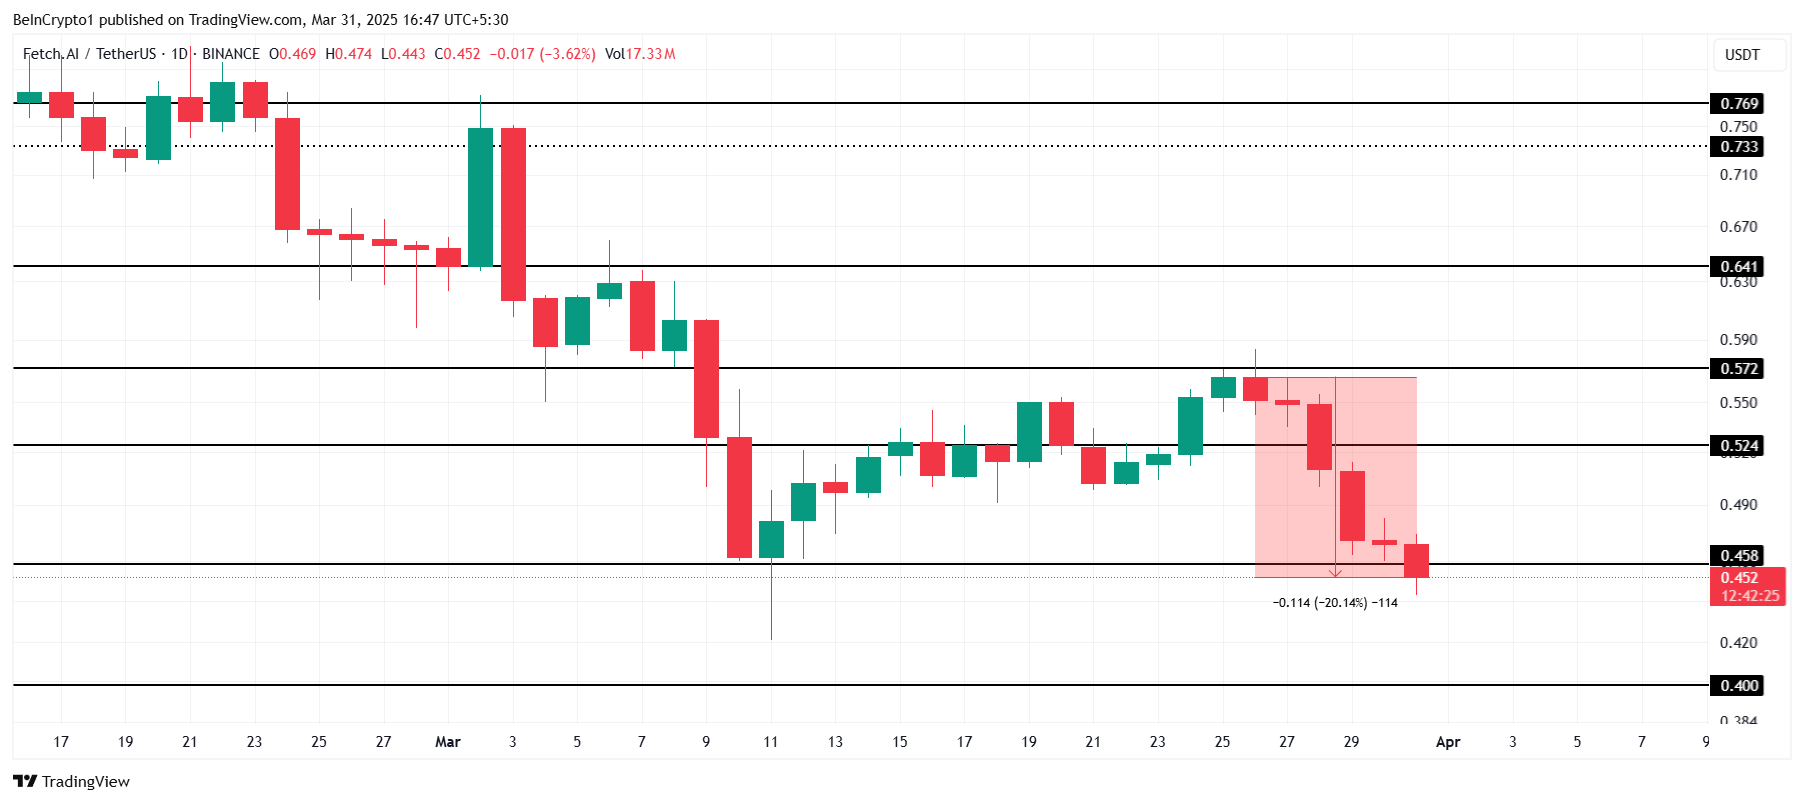
If the bearish trend continues, FET could fall further to $0.400, which would invalidate the bullish outlook and lead to extended losses. The price would need to hold above critical support levels to avoid deeper declines.
Ethereum (ETH)
Ethereum’s price is nearing a 17-month low of $1,745, following a 13.42% drop after failing to break through the $2,141 resistance. This recent price action suggests the altcoin king is struggling to regain momentum. The market conditions remain unfavorable for a quick recovery at this point.
Despite the current market downturn, Ethereum could see some recovery as investors look to capitalize on low prices. A short-term bounceback is possible if ETH successfully flips $1,862 into support, potentially pushing the price above $2,000. This would mark a significant recovery attempt from the recent drop.
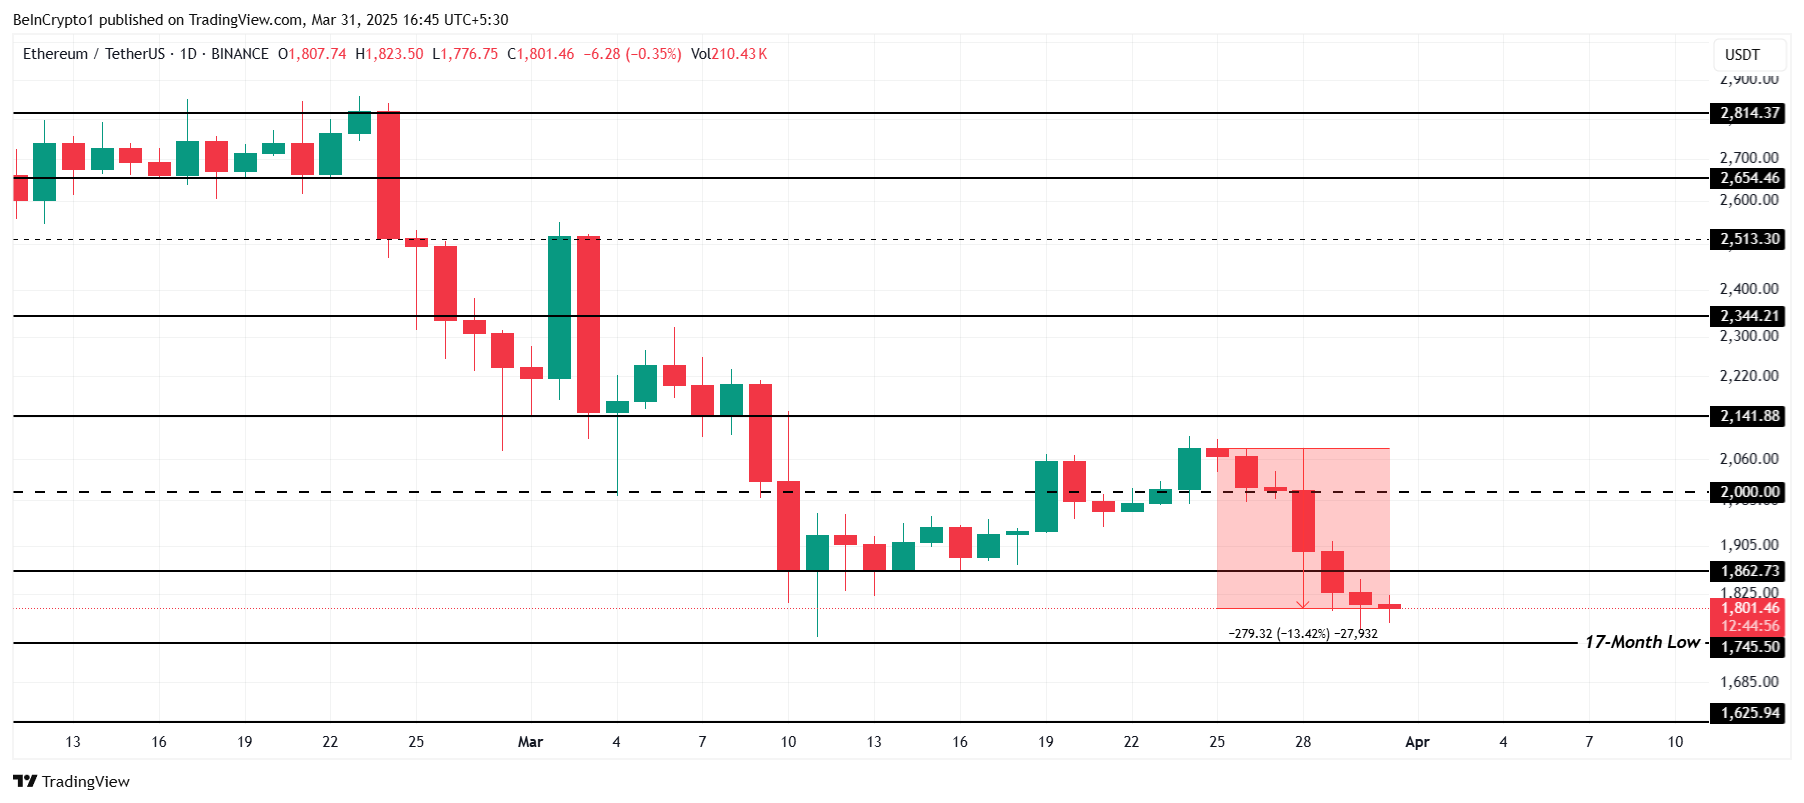
If bearish conditions continue, Ethereum’s price might fall below $1,745, testing the next support at $1,625. A failure to hold this level would invalidate the bullish outlook and open the door for further declines, extending the recent losses.
Disclaimer
In line with the Trust Project guidelines, this price analysis article is for informational purposes only and should not be considered financial or investment advice. BeInCrypto is committed to accurate, unbiased reporting, but market conditions are subject to change without notice. Always conduct your own research and consult with a professional before making any financial decisions. Please note that our Terms and Conditions, Privacy Policy, and Disclaimers have been updated.

Pi Network Struggles, On Track for New All-Time Low
USDC Issuer Circle Set To File IPO In April, Here’s All

Bitcoin Mining Faces Tariff Challenges as Hashrate Hits New ATH

3 Altcoins to Watch in the First Week of April 2025

BTC Price Rebound Likely as Long-Term Holders Reenter Market

Ethereum To $20K? Investor Says Real-World Adoption Is The Key

2.52 Million Altcoins Are Ruining Crypto’s Future

Animoca Brands Valuation Tanks 75% In Two Years, Here’s Why

Crypto exchange BingX hacked for $43 million

Are The Big Players Losing Interest?

Hong Kong’s Securities Association Tips Authorities On Crypto Self-Regulation

Coinbase cbBTC Set to go Live on Solana
2.52 Million Altcoins Are Ruining Crypto’s Future
Animoca Brands Valuation Tanks 75% In Two Years, Here’s Why
Crypto exchange BingX hacked for $43 million
Are The Big Players Losing Interest?
Hong Kong’s Securities Association Tips Authorities On Crypto Self-Regulation
Coinbase cbBTC Set to go Live on Solana
-
 Regulation23 hours ago
Japan Set To Classify Cryptocurrencies As Financial Products, Here’s All
-

 Market23 hours ago
Top 3 Made in USA Coins to Watch This Week
-

 Market22 hours ago
Solana (SOL) Price Risks Dip Below $110 as Bears Gain Control
-
 Altcoin16 hours ago
Cardano Price Eyes Massive Pump In May Following Cyclical Patern From 2024
-

 Market12 hours ago
Bitcoin Bears Tighten Grip—Where’s the Next Support?
-

 Market11 hours ago
Ethereum Price Weakens—Can Bulls Prevent a Major Breakdown?