
Market
Top Altcoin Gainers and Losers in the Second Week of June 2024

This past week, the cryptocurrency market has experienced mixed sentiments. While some assets have soared to new highs, others have plummeted to new lows.
Over the past week, Oasis (ROSE) and Toncoin (TON) have emerged as top-performing altcoins. In contrast, Floki (FLOKI) and Wormhole (W) have experienced the most declines during the same period.
Oasis (ROSE) Climbs to a Two-Month High
The price per Oasis (ROSE) token has risen by 8% in the last week. The altcoin currently trades at $0.12, its highest price since April 8.
Currently, the altcoin is above its 20-day Exponential Moving Average (EMA). This moving average tracks the token’s average price over the past 20 days.
When an asset’s price rests above this level, it signals a spike in buying pressure. It is a bullish signal which suggests that the asset’s current value is higher than its average price in the past 20 days.
ROSE’s Aroon Up Line was 85.71%, confirming the current uptrend. This indicator identifies an asset’s trend strength and potential price reversal points.
When an asset’s Aroon Up line is close to 100, it indicates that the uptrend is strong and that the most recent high was reached relatively recently.
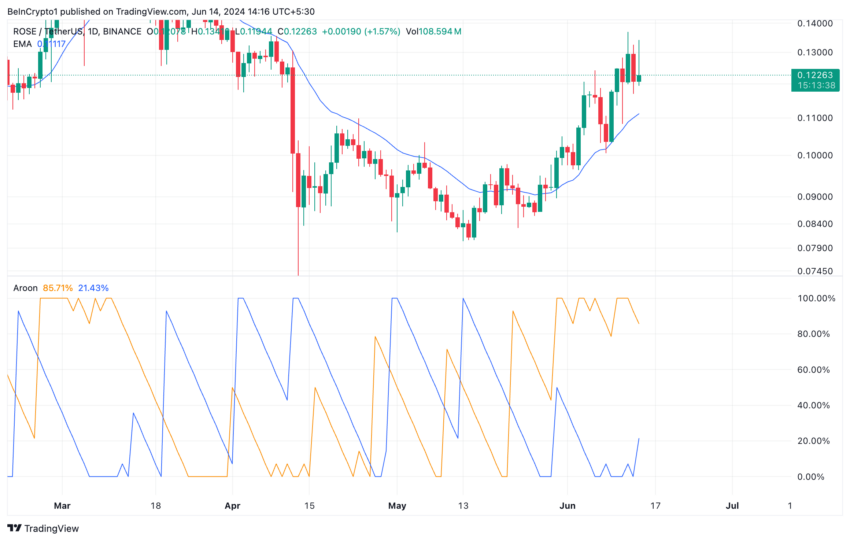
If this trend is maintained, ROSE’s value may surge by 8% to trade at $0.13.
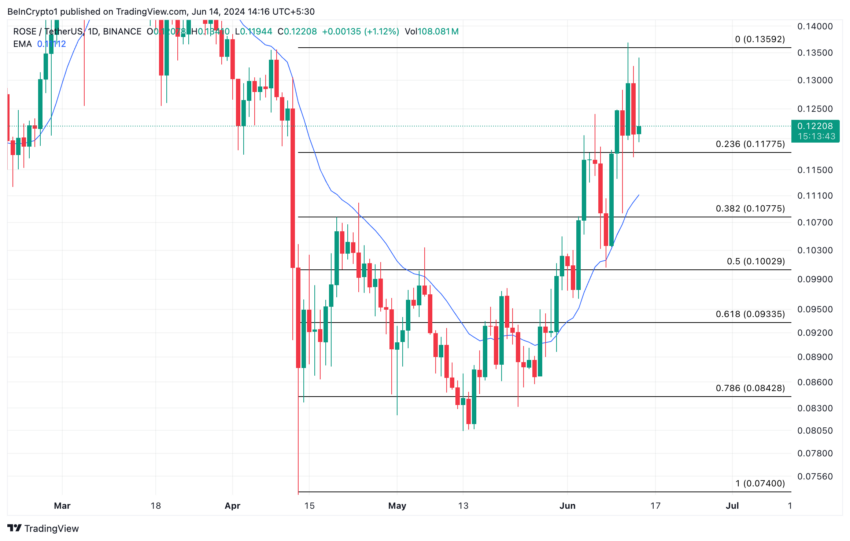
However, if invalidated, it will dip to sell at $0.11
Toncoin (TON) Bulls Take Charge
The price of Toncoin (TON), the cryptocurrency linked to the popular messaging app Telegram, has soared by 5% in the past seven days. TON’s daily trading volume has also spiked during the period under review.
As of this writing, TON’s trading volume totals $517 million. The last time the altcoin’s daily trading volume was this high was May 16.
According to TON’s Directional Movement Index (DMI), the bullish sentiment trailing the altcoin is significant. Readings from this indicator show its positive directional index (green) resting above its negative index (red).
An asset’s DMI identifies the direction and strength of a trend. When the positive index lies above the negative index, it confirms the market’s uptrend and suggests that buying momentum exceeds token sell-offs.
TON’s positive Elder-Ray Index confirms its bullish bias. This indicator identifies the direction of an asset’s price trends and potential buying or selling opportunities in the market.
When its value is positive, it is a bullish signal, which suggests that token accumulation outpaces distribution.
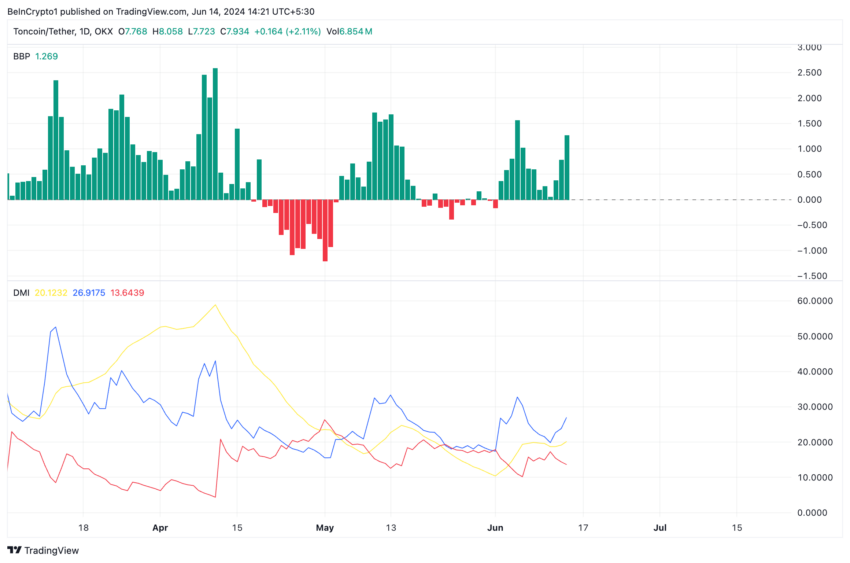
If bullish sentiment continues to grow, TON’s price might rally above $8.05.
Read More: What Are Telegram Bot Coins?
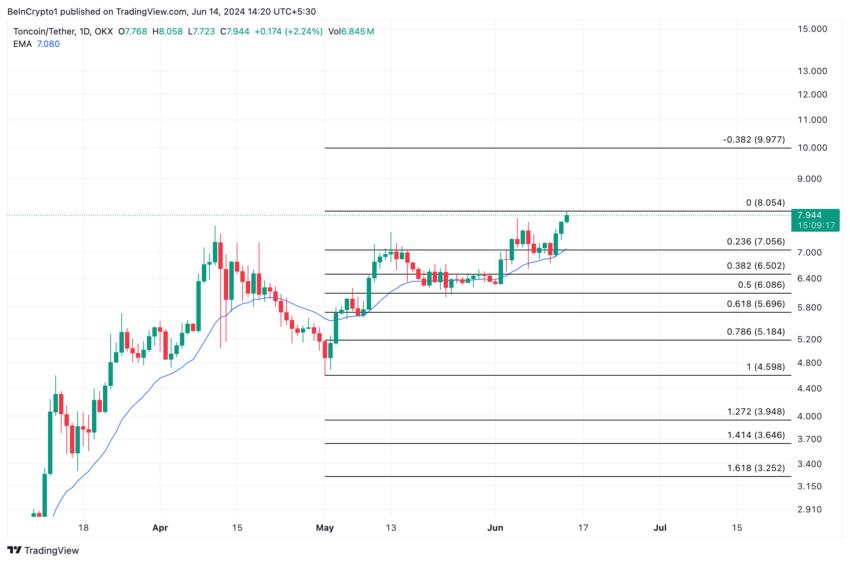
However, if traders begin to take profit and TON sell-off spikes, its price might plummet to $7.05.
Floki (FLOKI) Leads From Behind
Popular meme coin Floki (FLOKI) is the top altcoin with the most losses in the last week. Exchanging hands at $0.00021 as of this writing, the price of the dog-themed token has dropped by 32% in the past seven days.
Its price fall is partly due to the significant whale outflows it witnessed last week. For context, on June 12, FLOKI’s large holder outflow totaled 253 billion FLOKI, valued at $53 million at current market prices.
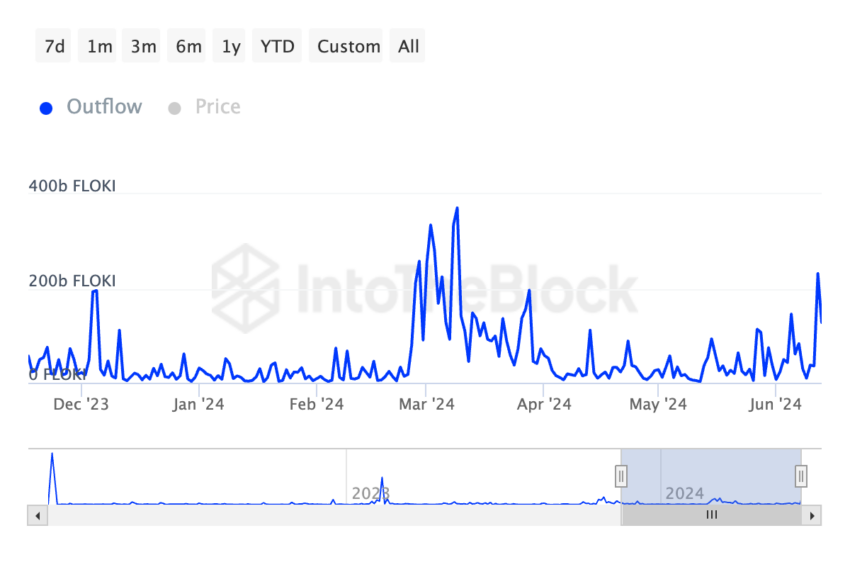
The meme coin last recorded outflows this high on March 9.
If the demand for FLOKI continues to dip, its value may fall to $0.00020.
Read More: What Are Meme Coins?
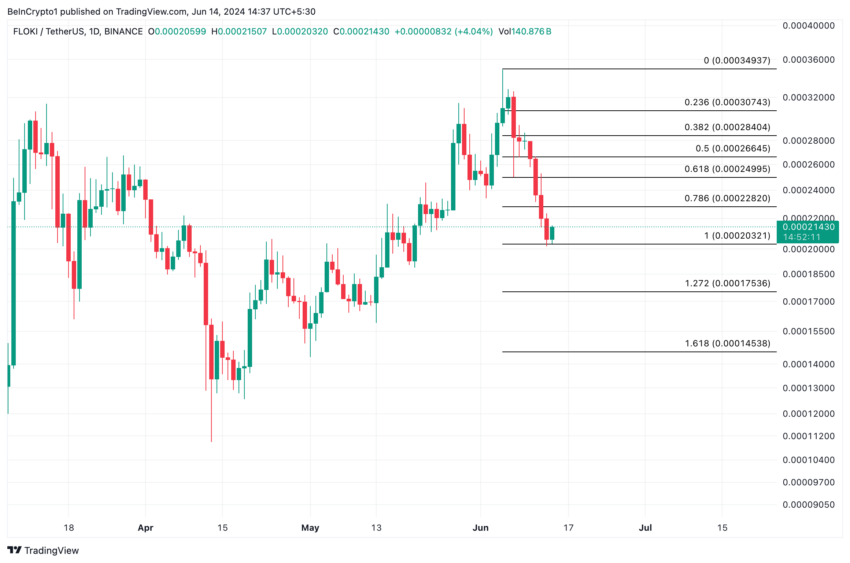
However, if whale activity sees a resurgence and the general sentiment toward the altcoin turns positive, its price might climb to $0.00022.
Wormhole (W) Puts a 30% Hole in Investors’ Profits
W, the native token of the cross-chain bridge Wormhole, has seen its value drop by 30% in the past seven days. It currently trades at $0.48.
At its current price, the altcoin trades below its 20-day EMA (blue) and its 50-day Small Moving Average (orange).
When an asset’s price trades below these moving averages, it confirms the market downtrend and suggests that the overall trend for the past few months has been negative. Traders often consider this a sign to sell their holdings or open short positions.
If traders intensify their W distribution efforts, its price may drop to $0.46.
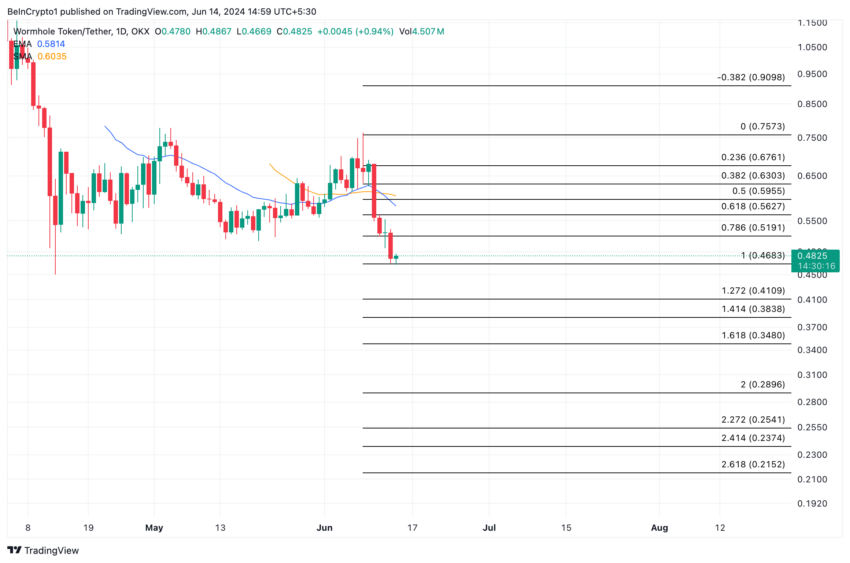
If the trend is reversed and buying momentum increases, the altcoin may rally to $0.51
Disclaimer
In line with the Trust Project guidelines, this price analysis article is for informational purposes only and should not be considered financial or investment advice. BeInCrypto is committed to accurate, unbiased reporting, but market conditions are subject to change without notice. Always conduct your own research and consult with a professional before making any financial decisions. Please note that our Terms and Conditions, Privacy Policy, and Disclaimers have been updated.


Welcome to the US Morning Crypto News Briefing—your essential rundown of the most important developments in crypto for the day ahead.
Grab a coffee to see what experts say about Bitcoin’s (BTC) price amid recovery efforts. The status of Bitcoin as a hedge against inflation and economic uncertainty is progressively becoming questionable, with institutional influence adding to the concerns.
Can Strategy’s $555 Million BTC Purchase Send Bitcoin Past $90,000?
Michael Saylor, the chairman of Strategy (formerly MicroStrategy), revealed the firm’s latest Bitcoin purchase, comprising 6,556 BTC tokens worth approximately $555.8 million. With this, the firm has attained a Bitcoin yield of 12.1% year-to-date (YTD) in 2025.
“MSTR has acquired 6,556 BTC for ~$555.8 million at ~$84,785 per bitcoin and has achieved BTC Yield of 12.1% YTD 2025. As of 4/20/2025, Strategy holds 538,200 BTC acquired for ~$36.47 billion at ~$67,766 per bitcoin,” Saylor shared.
Strategy uses the Bitcoin Yield YTD to measure the BTC holdings per share increase. This model has been a key part of their financial strategy firm since their first Bitcoin purchase in August 2020.
This acquisition aligns with a bullish market sentiment for Bitcoin, which is steadily nearing the $90,000 milestone, as the recent US Crypto News indicated.

Despite a mild recovery in Bitcoin prices this week, up by over 3% in the last 24 hours, it is worth noting that Bitcoin is highly sensitive to economic indicators.
Similarly, the global market is highly sensitive to monetary policies set by major economies, particularly the US. BeInCrypto contacted Paybis founder and CEO Innokenty Isers for insights on the current market outlook, particularly for Bitcoin.
“Given the strong concentration of investors in technology stocks, shifts in trade policies and government interventions that influence key indices like the Nasdaq Composite create ripple effects across financial markets,” Isers told BeInCrypto.
According to the Pybis executive, since the US Presidential inauguration, the outlook of Bitcoin has changed from a trusted hedge against inflation to a more risk-on asset.
“With its relatively higher volatility, risk-averse investors may favor alternative inflation hedges instead of Bitcoin,” he added.
Iners expressed cognizance of the longer stretch of the trade war and the potential inflation that will emerge. Based on this, he noted that capital allocation to Bitcoin as a hedge against economic instability might be reduced.
Strategy’s Stock Premium Narrows as Bitcoin Hype Cools
Meanwhile, Strategy has seen a significant shift in its stock valuation dynamics over the past year. Saylor recently revealed that as of Q1 2025, over 13,000 institutions and 814,000 retail accounts held MSTR directly.
“An estimated 55 million beneficiaries have indirect exposure through ETFs, mutual funds, pensions, and insurance portfolios,” Saylor added.
According to data on Bitcointreasuries.net, the premium investors once paid for exposure to its Bitcoin holdings has notably narrowed.
Specifically, the NAV multiplier, a measure of how much the stock trades above the value of Strategy’s Bitcoin assets, has decreased compared to last year. This indicates that MSTR is now trading closer to the actual value of its Bitcoin reserves.
In 2024, investors were willing to pay a substantial premium for MSTR shares, driven by Bitcoin’s hype and MicroStrategy’s aggressive accumulation strategy.
“I don’t know if buying strategy equity is a good idea for the government. The stock would just pump, and it’s likely trading at a premium over NAV with a higher risk profile. Also, I believe the gov will find it difficult to find institutions that would be willing to sell their BTC in large quantities,” an analyst said recently.
The shrinking NAV multiplier suggests a more cautious market sentiment. Analysts believe this reflects a shift toward valuing MicroStrategy based on its fundamentals rather than speculative Bitcoin enthusiasm.
This suggests a maturing market approach to the company’s unique investment strategy.
Chart of the Day
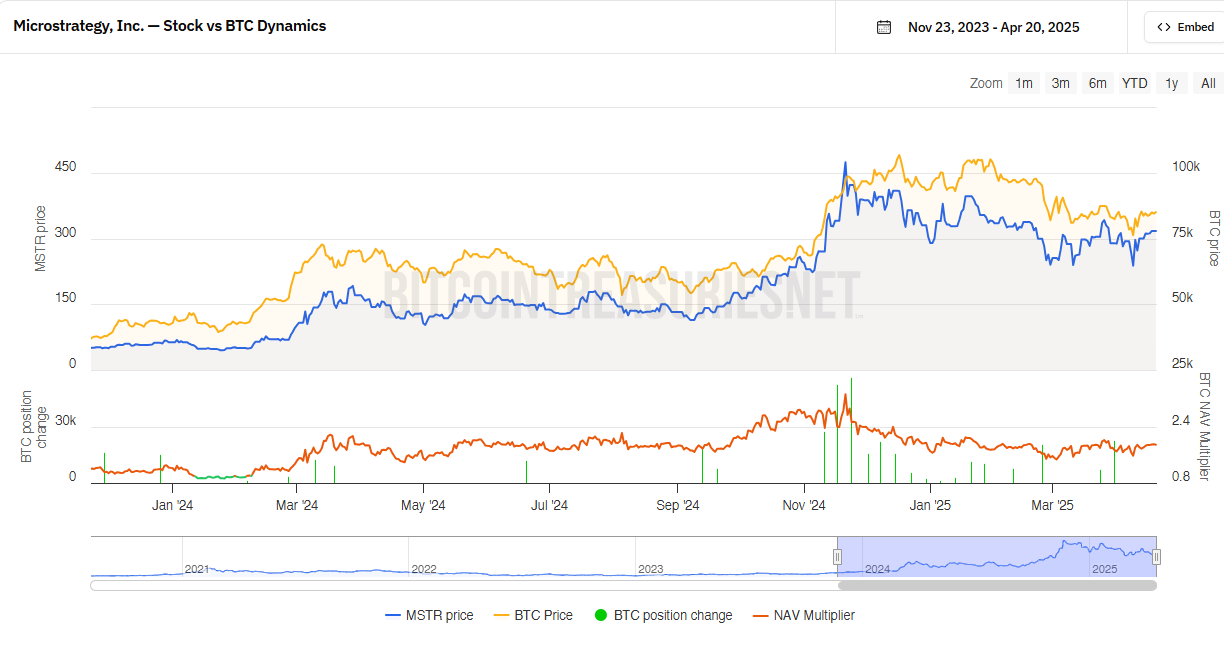
This chart shows how Strategy’s stock price (blue) moves with Bitcoin price (orange). When Bitcoin goes up, MicroStrategy usually follows, but it swings even more.
However, the NAV multiplier has narrowed compared to last year, meaning MicroStrategy’s stock is now trading closer to the actual value of its Bitcoin holdings.
Last year, investors paid a bigger premium for exposure to MSTR, but that gap has shrunk. This suggests a more cautious sentiment or a shift toward valuing the company based on fundamentals rather than just Bitcoin hype.
Byte-Sized Alpha
- Bitcoin ETFs saw modest $15 million inflows, a shift from the previous $713 million outflows, but the smallest influx of 2025, signaling cautious investor sentiment.
- XRP’s futures market shows a bullish shift with long positions exceeding short bets, signaling potential price increases.
- Accumulation signals from whale activity and consolidation at $0.60 indicate a possible rally for Pi Network, despite concerns about the lack of exchange listings and use cases.
- Solana surpasses Ethereum in staking market cap with $53.15 billion, driven by higher staking yield and 65% of supply staked.
- Bitcoin whales accumulated 53,652 BTC worth $4.7 billion in a month, pushing the price to $87,463, but long-term holder profits hit a two-year low.
- PlanB criticizes Ethereum as centralized and pre-mined, citing PoS, tokenomics, and a flexible supply as key red flags.
- Decentraland’s (MANA) price has surged over 10% in 24 hours, hitting a two-month high of $0.31.
Crypto Equities Pre-Market Overview
| Company | At the Close of April 17 | Pre-Market Overview |
| Strategy (MSTR) | $317.20 | $323.49 (+1.98%) |
| Coinbase Global (COIN) | $175.03 | $175.85 (+0.46%) |
| Galaxy Digital Holdings (GLXY.TO) | $15.36 | $15.12 (-1.41%) |
| MARA Holdings (MARA) | $12.66 | $12.83 (+1.34%) |
| Riot Platforms (RIOT) | $6.49 | $6.52 (+0.54%) |
| Core Scientific (CORZ) | $6.61 | $6.59 (-0.27%) |
Disclaimer
In adherence to the Trust Project guidelines, BeInCrypto is committed to unbiased, transparent reporting. This news article aims to provide accurate, timely information. However, readers are advised to verify facts independently and consult with a professional before making any decisions based on this content. Please note that our Terms and Conditions, Privacy Policy, and Disclaimers have been updated.

PI has been on a steady downtrend since February 26, shedding 72% of its value as bearish sentiment continues to weigh on the token.
Bearish pressure continues to mount on the PI token, suggesting that it may be poised to enter a new phase of decline.
PI Network Risks Fresh Decline
An assessment of the PI/USD one-day chart reveals that token holders remain steadfast in their distribution. At press time, PI’s Balance of Power (BoP) is negative, reflecting the selling pressure in the market.
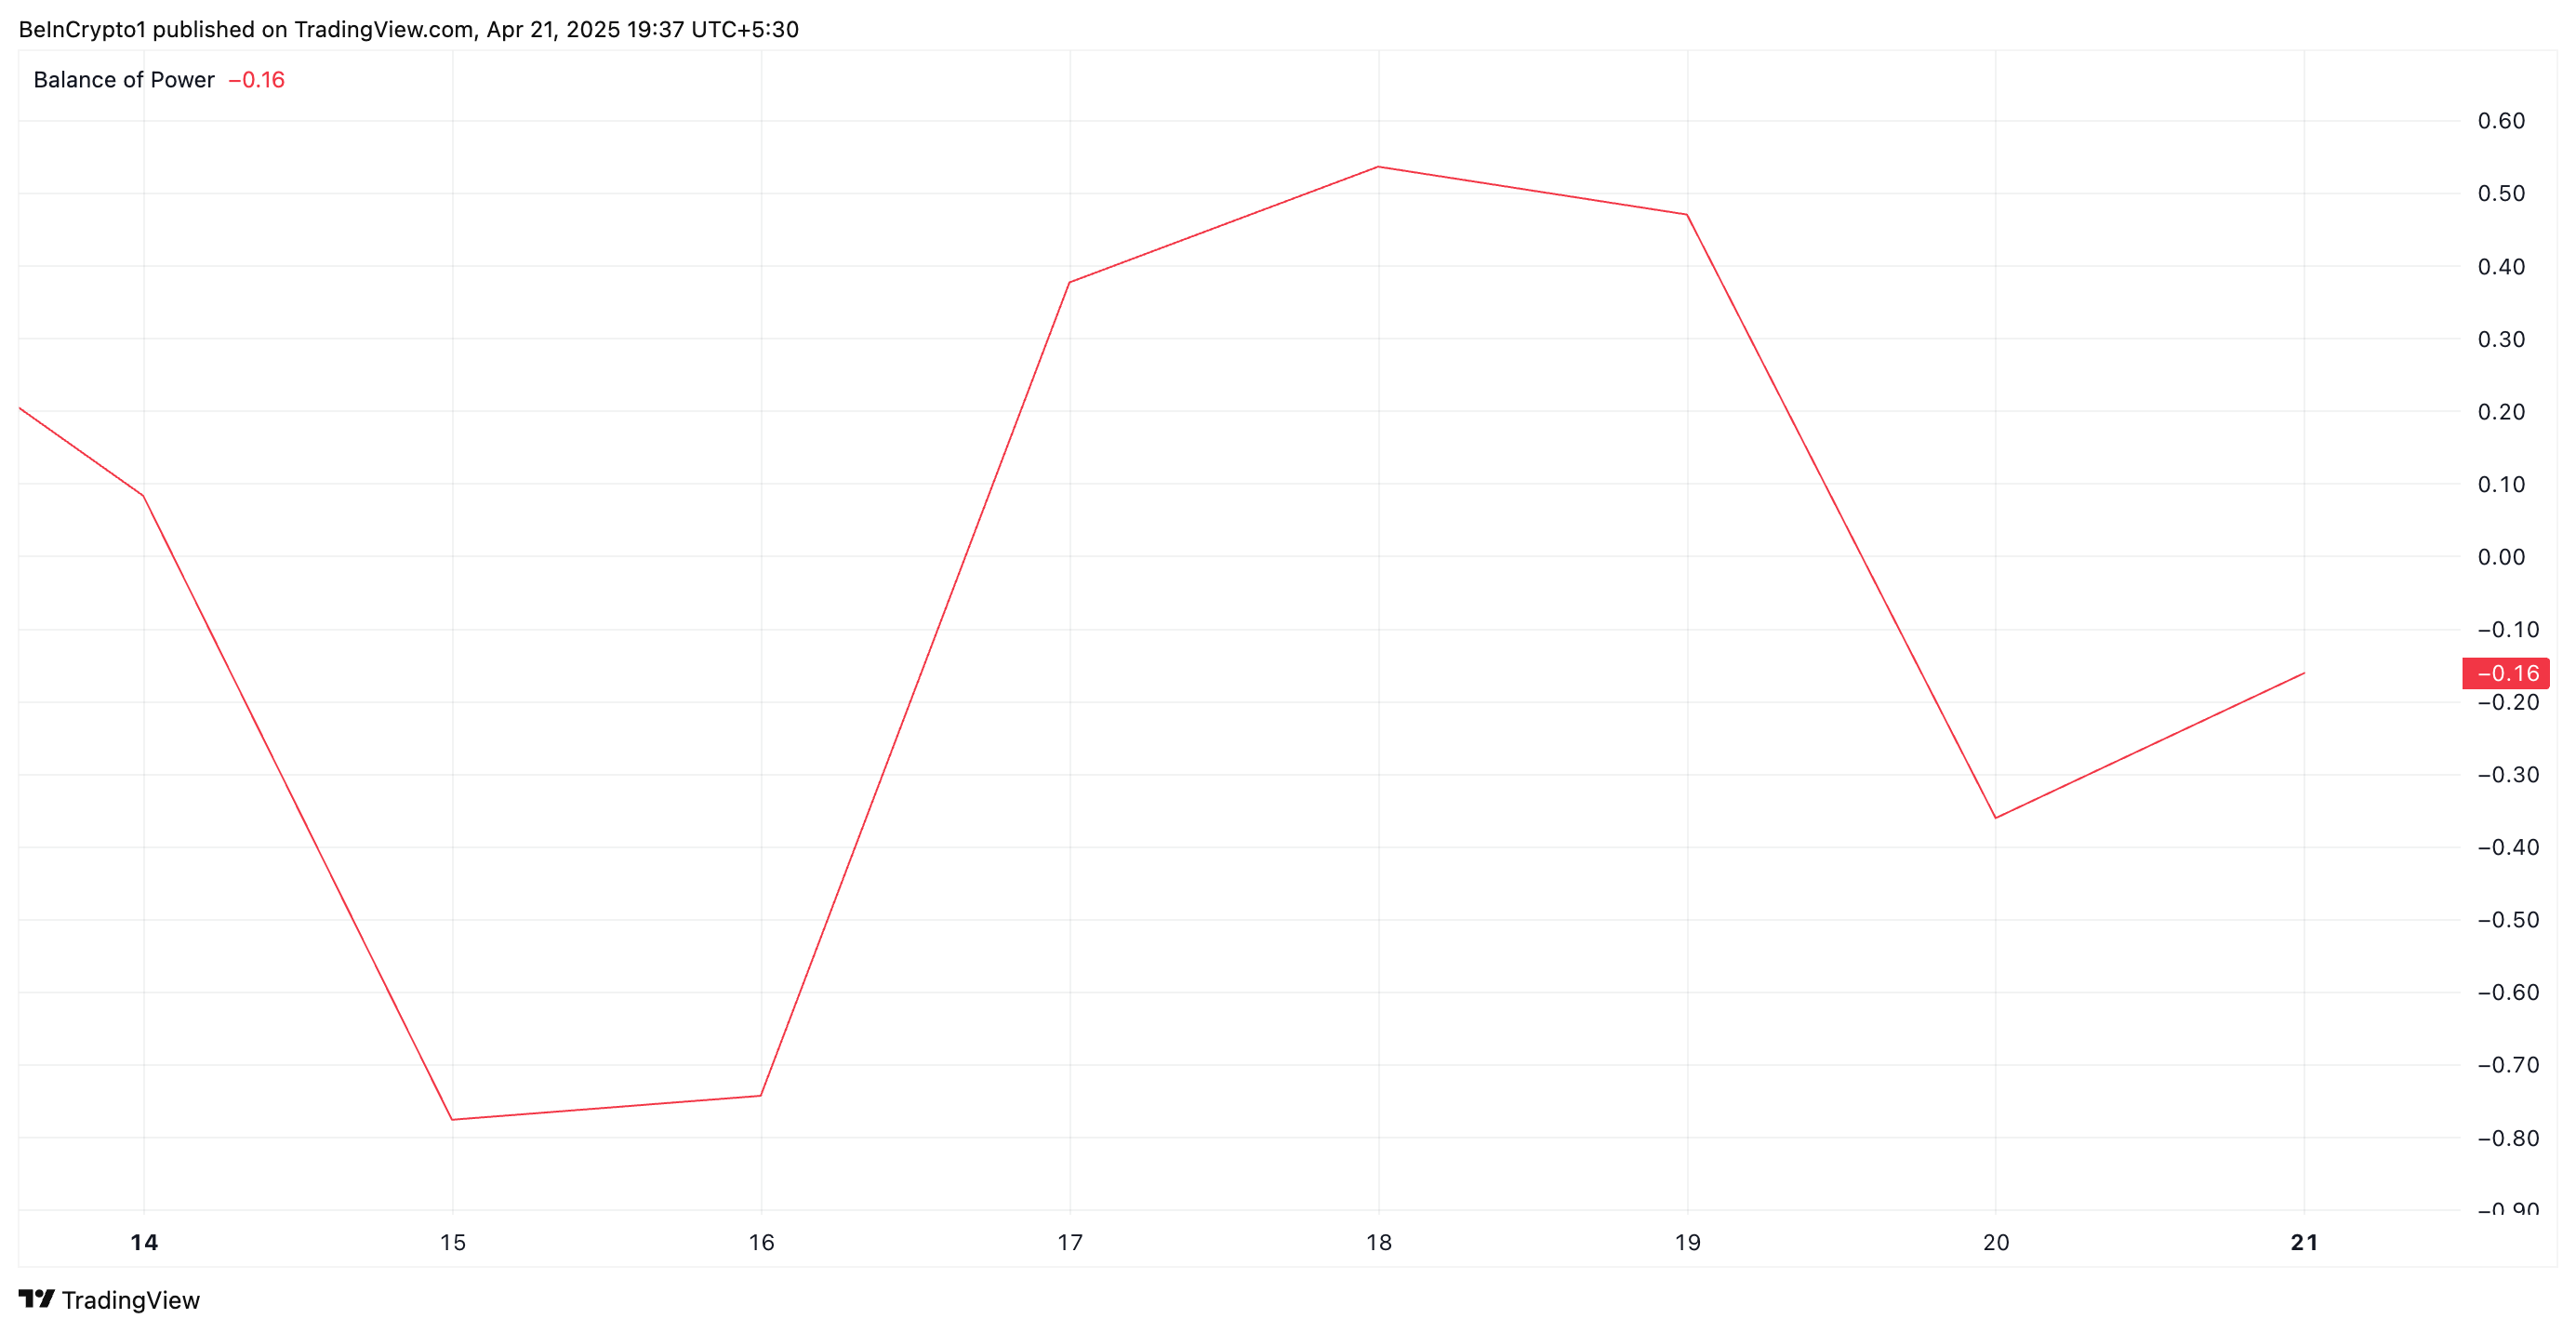
The BoP indicator measures the strength of buying versus selling pressure by comparing the close price to the trading range within a given period. When BOP is negative like this, it indicates that sellers are dominating the market, suggesting downward pressure on the asset’s price.
Further, the setup of PI’s Chaikin Money Flow (CMF) supports this bearish outlook. At press time, this is below the central line at -0.12.
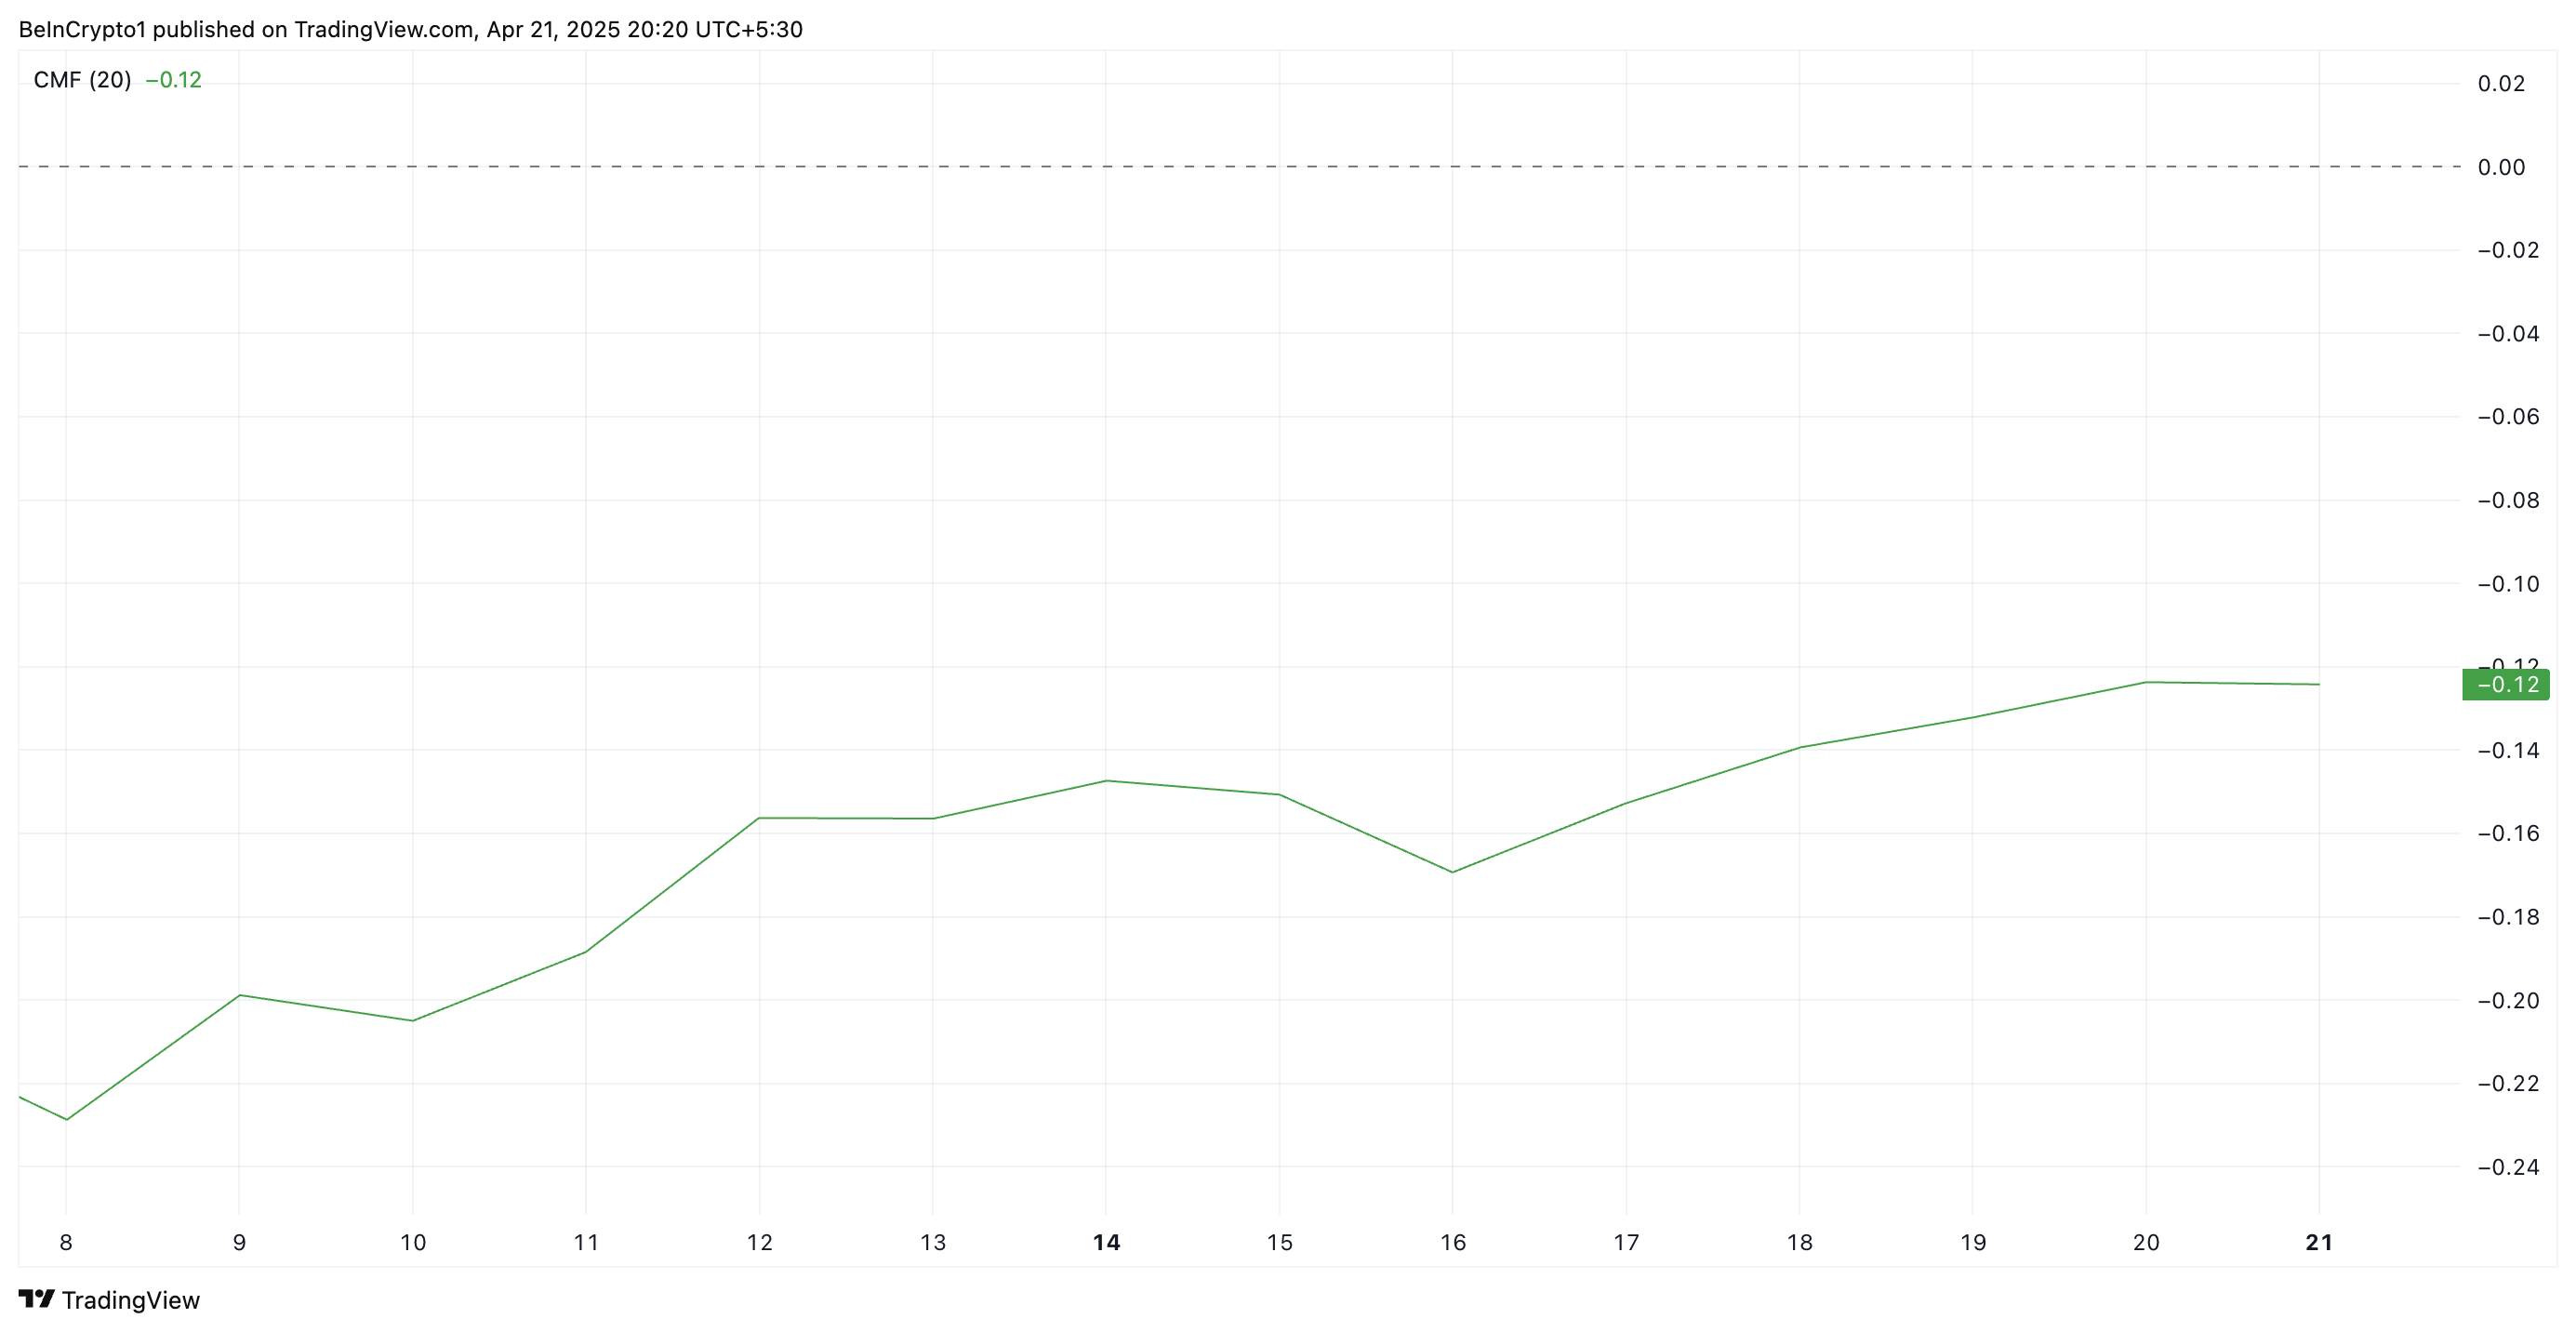
The CMF indicator measures an asset’s buying and selling pressure. A negative CMF reading suggests that the asset is experiencing more selling pressure than buying pressure. This means PI traders are distributing rather than accumulating. This signals bearish sentiment and confirms the downward momentum in the token’s price.
Sellers Tighten Grip on PI, But Recovery to $1.01 Still on the Table
At press time, PI trades at $0.63, below the dynamic support formed above it at $0.93 by its Super Trend indicator.
The Super Trend indicator helps traders identify the market’s direction by placing a line above or below the price chart based on the asset’s volatility.
When an asset’s price trades below the Super Trend line like this, it signals a bearish trend and hints at potential decline. If PI’s decline strengthens, it could revisit its all-time low of $0.40.
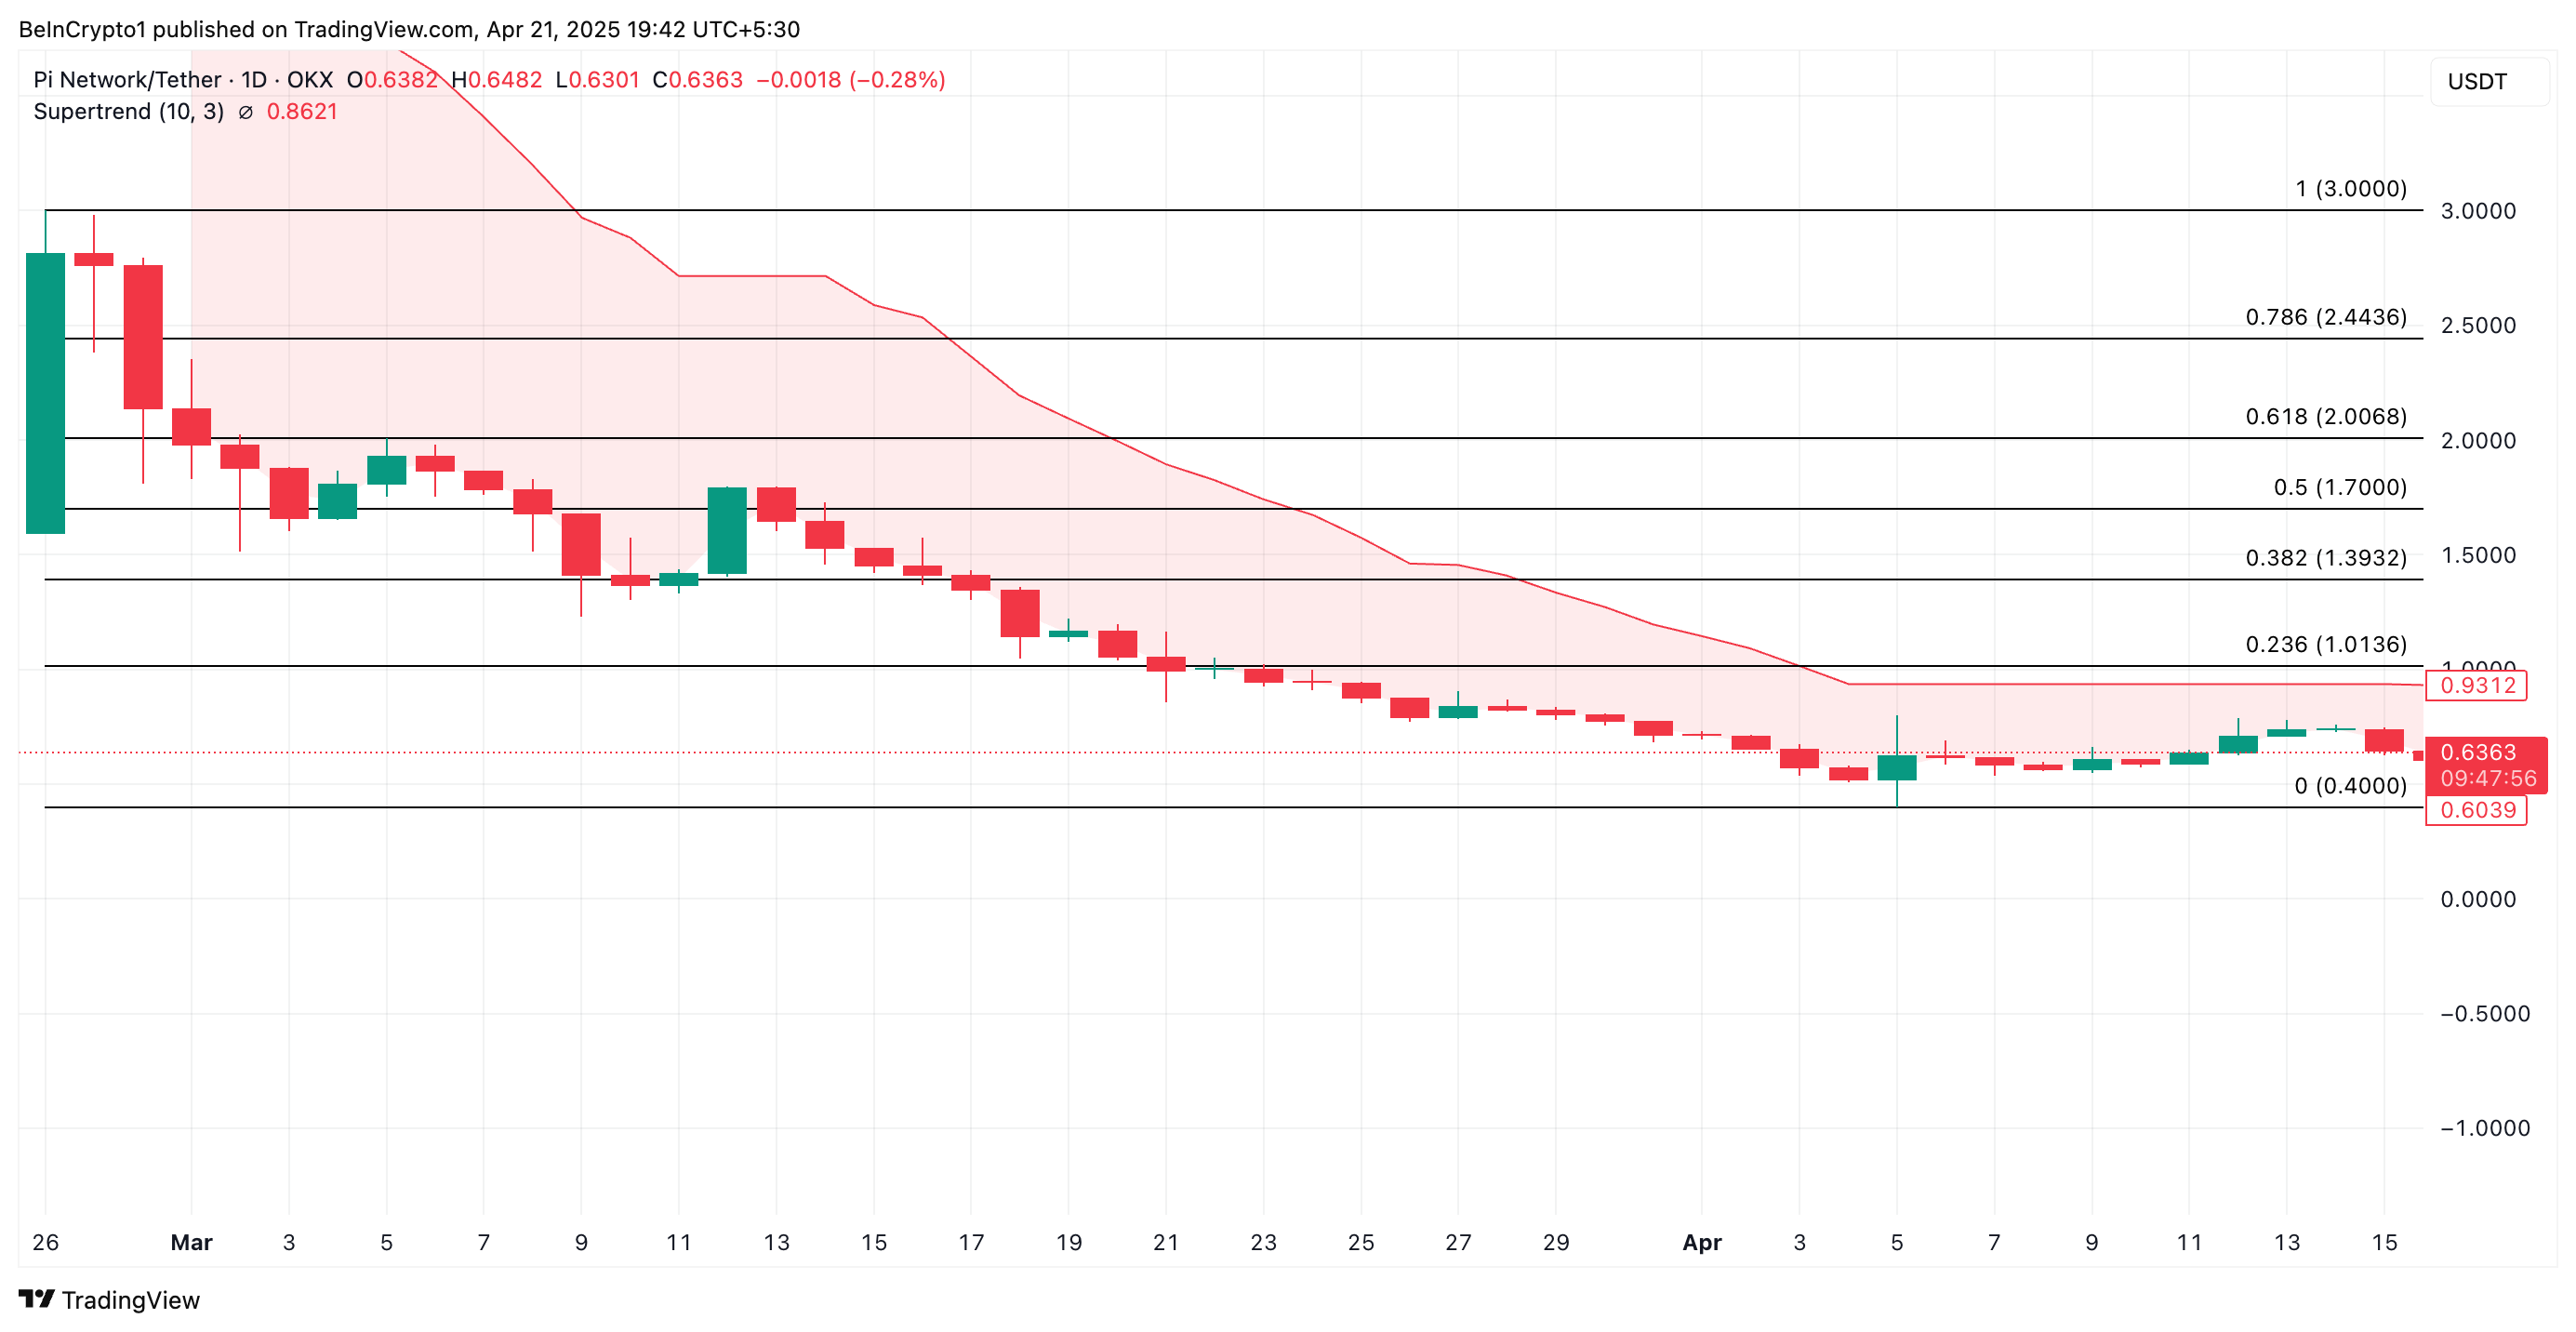
However, if demand returns to the PI market, its price could break above the resistance at $0.86 and surge to $1.01.
Disclaimer
In line with the Trust Project guidelines, this price analysis article is for informational purposes only and should not be considered financial or investment advice. BeInCrypto is committed to accurate, unbiased reporting, but market conditions are subject to change without notice. Always conduct your own research and consult with a professional before making any financial decisions. Please note that our Terms and Conditions, Privacy Policy, and Disclaimers have been updated.


With support from Trump’s White House and easing regulations, firms like Circle and BitGo are pursuing becoming full-fledged financial institutions.
Reports indicate a new wave of crypto companies knocking on the once-closed doors of the American banking system. This time, someone is listening.
Crypto Firms Seek Bank Charters as Wall Street’s Doors Reopen
After years of being sidelined, crypto companies are coming back, this time through the front door of the US banking system.
Citing sources familiar with the matter, the Wall Street Journal revealed that several major players, including Circle and BitGo, are preparing to apply for bank charters or financial licenses.
Traditional banks are also responding to the shift. US Bancorp is re-launching its crypto custody program via NYDIG, while Bank of America (BofA) said it would issue its stablecoin once the legal framework is in place.
Even global giants are watching closely. A consortium including Deutsche Bank and Standard Chartered is evaluating how to expand crypto operations into the US.
While details remain scarce, the interest signals that crypto is no longer just a niche but a competitive frontier.
These firms reportedly aim to operate with the same legitimacy and access as traditional lenders. This includes holding deposits, issuing loans, and launching stablecoins under regulatory supervision.
The timing is not random. A sharp pivot in federal policy, driven by President Trump’s pledge to make the US a Bitcoin superpower, has reopened regulatory pathways once shut after the FTX collapse.
In parallel, Congress is advancing stablecoin legislation requiring issuers to secure federal or state licenses.
The push for bank status comes amid a broader effort to legitimize crypto within US finance. Earlier this year, regulators rolled back key restrictions. Among them, the SEC’s controversial SAB 121, which had blocked banks from holding crypto on behalf of clients.
Meanwhile, Federal Reserve (Fed) Chair Jerome Powell affirmed that banks could serve crypto customers provided proper risk management strategies exist.
In another regulatory green light, the Office of the Comptroller of the Currency (OCC) clarified that banks can offer stablecoin and custody services. However, this is provided they comply with established banking rules.
These signals have emboldened crypto firms previously kept at arm’s length. Anchorage Digital, the only US crypto-native firm with a federal bank charter, says the regulatory lift is massive but worth it.
“It hasn’t been easy… the whole gamut of regulatory and compliance obligations that banks have can be intertwined with the crypto industry,” Anchorage CEO Nathan McCauley reportedly admitted.
McCauley cited tens of millions in compliance costs. Nevertheless, Anchorage has since collaborated with BlackRock, Cantor Fitzgerald, and Copper for high-profile custody and lending programs.
BitGo, which will reportedly custody reserves for Trump-linked stablecoin USD1, is nearing a bank charter application.
Circle, the issuer of USDC, is also pursuing licenses while fending off competition, just like Tether. This is a traditional finance (TradFi) venture into stablecoins.
The firm delayed its IPO this month, citing market turmoil and financial uncertainty. However, insiders say regulatory clarity remains a top priority.
Firms like Coinbase and Paxos are exploring similar routes, considering industrial banks or trust charters to expand their financial offerings legally.
At the policy level, venture firm a16z has called on the SEC to modernize crypto custody rules for investment firms, reflecting the industry’s hunger for clarity and parity.
Disclaimer
In adherence to the Trust Project guidelines, BeInCrypto is committed to unbiased, transparent reporting. This news article aims to provide accurate, timely information. However, readers are advised to verify facts independently and consult with a professional before making any decisions based on this content. Please note that our Terms and Conditions, Privacy Policy, and Disclaimers have been updated.

Strategy’s 12% YTD Yield and $555M Acquisition

PI Token Price Faces Bearish Pressure, Risking a Drop to $0.40
Top Solana Price Levels to Watch in the Short Term

Circle, BitGo, and Others Eye Bank Charters in US
Will Cardano Price Break Out Soon? Triangle Pattern Hints at 27% ADA Surge

BNB Springs Back From $531 With Unshaken Bullish Conviction

2.52 Million Altcoins Are Ruining Crypto’s Future

Animoca Brands Valuation Tanks 75% In Two Years, Here’s Why

Crypto exchange BingX hacked for $43 million

Are The Big Players Losing Interest?

Hong Kong’s Securities Association Tips Authorities On Crypto Self-Regulation

Coinbase cbBTC Set to go Live on Solana
2.52 Million Altcoins Are Ruining Crypto’s Future
Animoca Brands Valuation Tanks 75% In Two Years, Here’s Why
Crypto exchange BingX hacked for $43 million
Are The Big Players Losing Interest?
Hong Kong’s Securities Association Tips Authorities On Crypto Self-Regulation
Coinbase cbBTC Set to go Live on Solana
-

 Market24 hours ago
Tokens Big Players Are Buying
-

 Market23 hours ago
Dogecoin Defies Bullish Bets During Dogeday Celebration
-
 Altcoin23 hours ago
Expert Predicts Pi Network To Reach $5 As Whales Move 41M Pi Coins Off Exchanges
-

 Market21 hours ago
Will XRP Break Support and Drop Below $2?
-
 Bitcoin11 hours ago
US Economic Indicators to Watch & Potential Impact on Bitcoin
-

 Bitcoin20 hours ago
Bitcoin LTH Selling Pressure Hits Yearly Low — Bull Market Ready For Take Off?
-

 Bitcoin17 hours ago
Here Are The Bitcoin Levels To Watch For The Short Term
-

 Market14 hours ago
Bitcoin Price Breakout In Progress—Momentum Builds Above Resistance