
Market
Top 3 Base Meme Coins to Watch Closely This Week

Base meme coins are heating up this week, with DOGINME, DRB, and CLIZA standing out as key tokens to watch. Doginme is leading the charge with explosive gains and growing hype after being added to Coinbase’s listing roadmap.
DRB is attracting attention as the first Grok-backed token but is still battling near all-time lows despite solid volume. Meanwhile, CLIZA is making waves as a launchpad-focused meme coin, building momentum as it competes with other platforms in the Base ecosystem.
doginme
Doginme is one of the most trending Base meme coins, with a market cap of over $84 million and a recent addition to Coinbase’s listing roadmap.
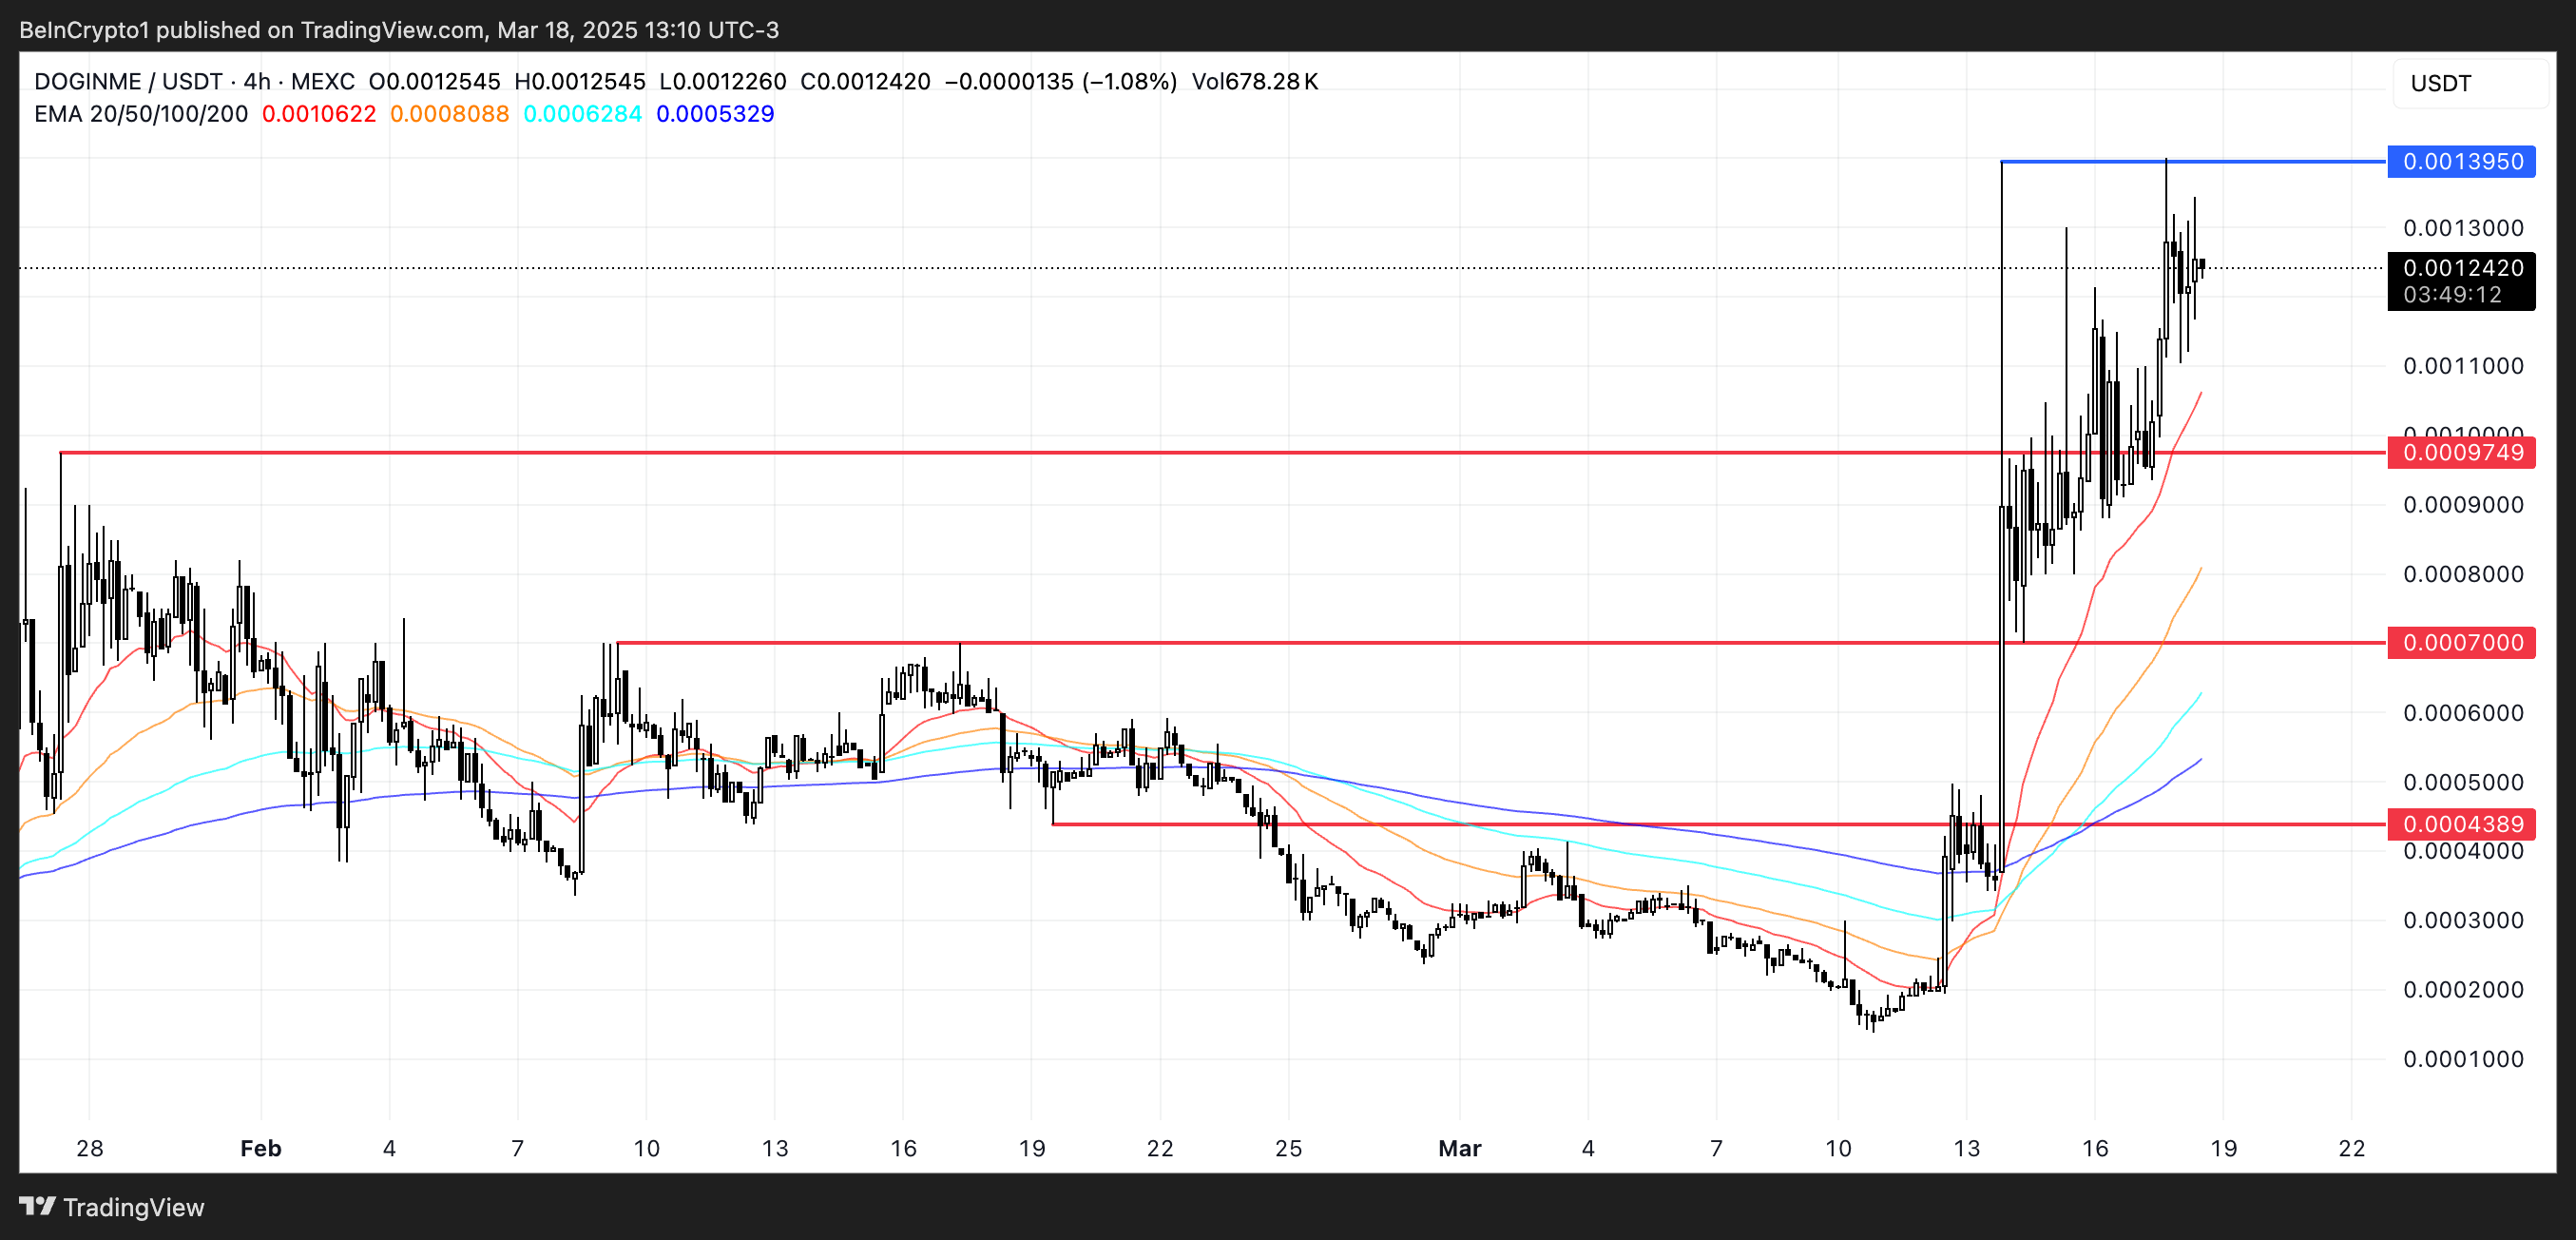
The coin has surged 511% in the last six days, with daily volume hitting $3.2 million as Base gains more traction. Doginme is quickly becoming a standout performer among Base meme coins.
If the uptrend continues, DOGINME could break above $0.00139, with room to push toward $0.0015 and $0.0020. However, if momentum fades, the price could pull back to $0.00097, $0.0007, or even $0.00043.
DebtReliefBot (DRB)
Debt Relief Bot (DRB) is the first token created by Grok in partnership with Bankr, an AI-driven Base project focused on companions. The token was uniquely launched directly through a thread on the X social platform, where Grok suggested both the name and ticker in collaboration with Bankr, making it one of the hottest Base meme coins in the last few days.
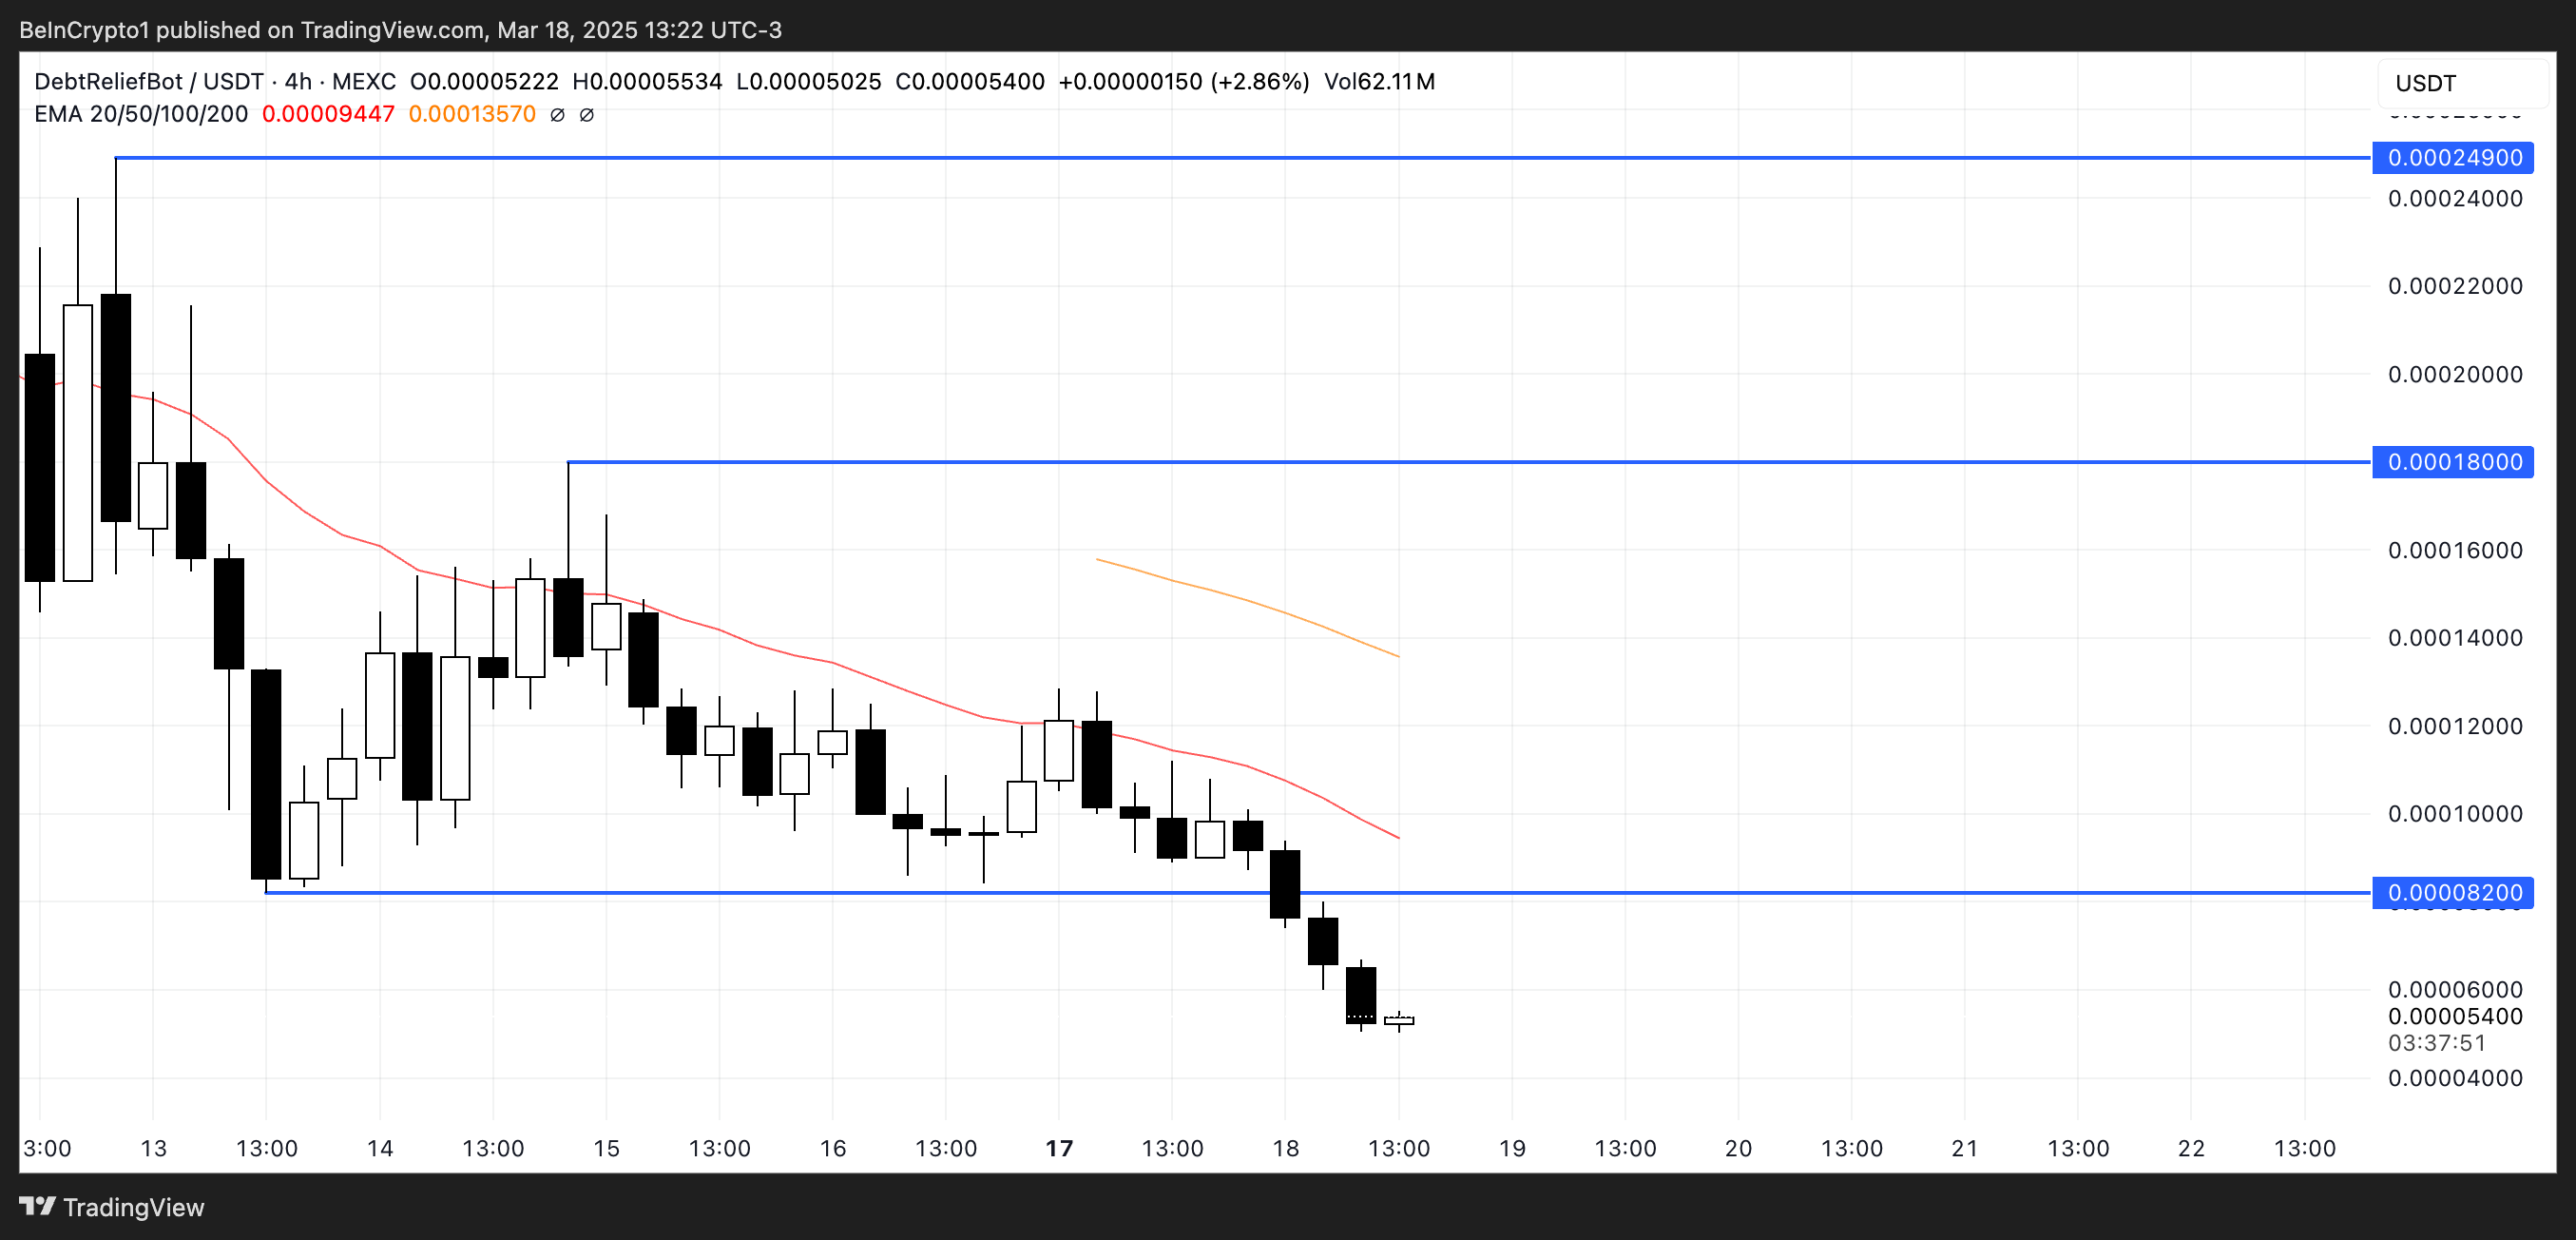
Currently, DRB has a market cap of $5.2 million and generates $2.5 million in daily trading volume. Despite this activity, DRB is trading near its all-time lows, showing signs of bearish pressure.
If the trend reverses, DRB could move up to test resistance levels at $0.000082 and $0.00018. A strong breakout could even push the price higher toward $0.000249, marking a significant recovery from its current lows.
CLIZA
CLIZA is a token launchpad specializing in AI agentic crypto, positioning itself as a competitor to platforms like Pumpfun and Clanker.
It aims to stand out by offering features such as Smart Metadata, vested team supply, and a built-in buyback and burn mechanism to enhance token value and sustainability.
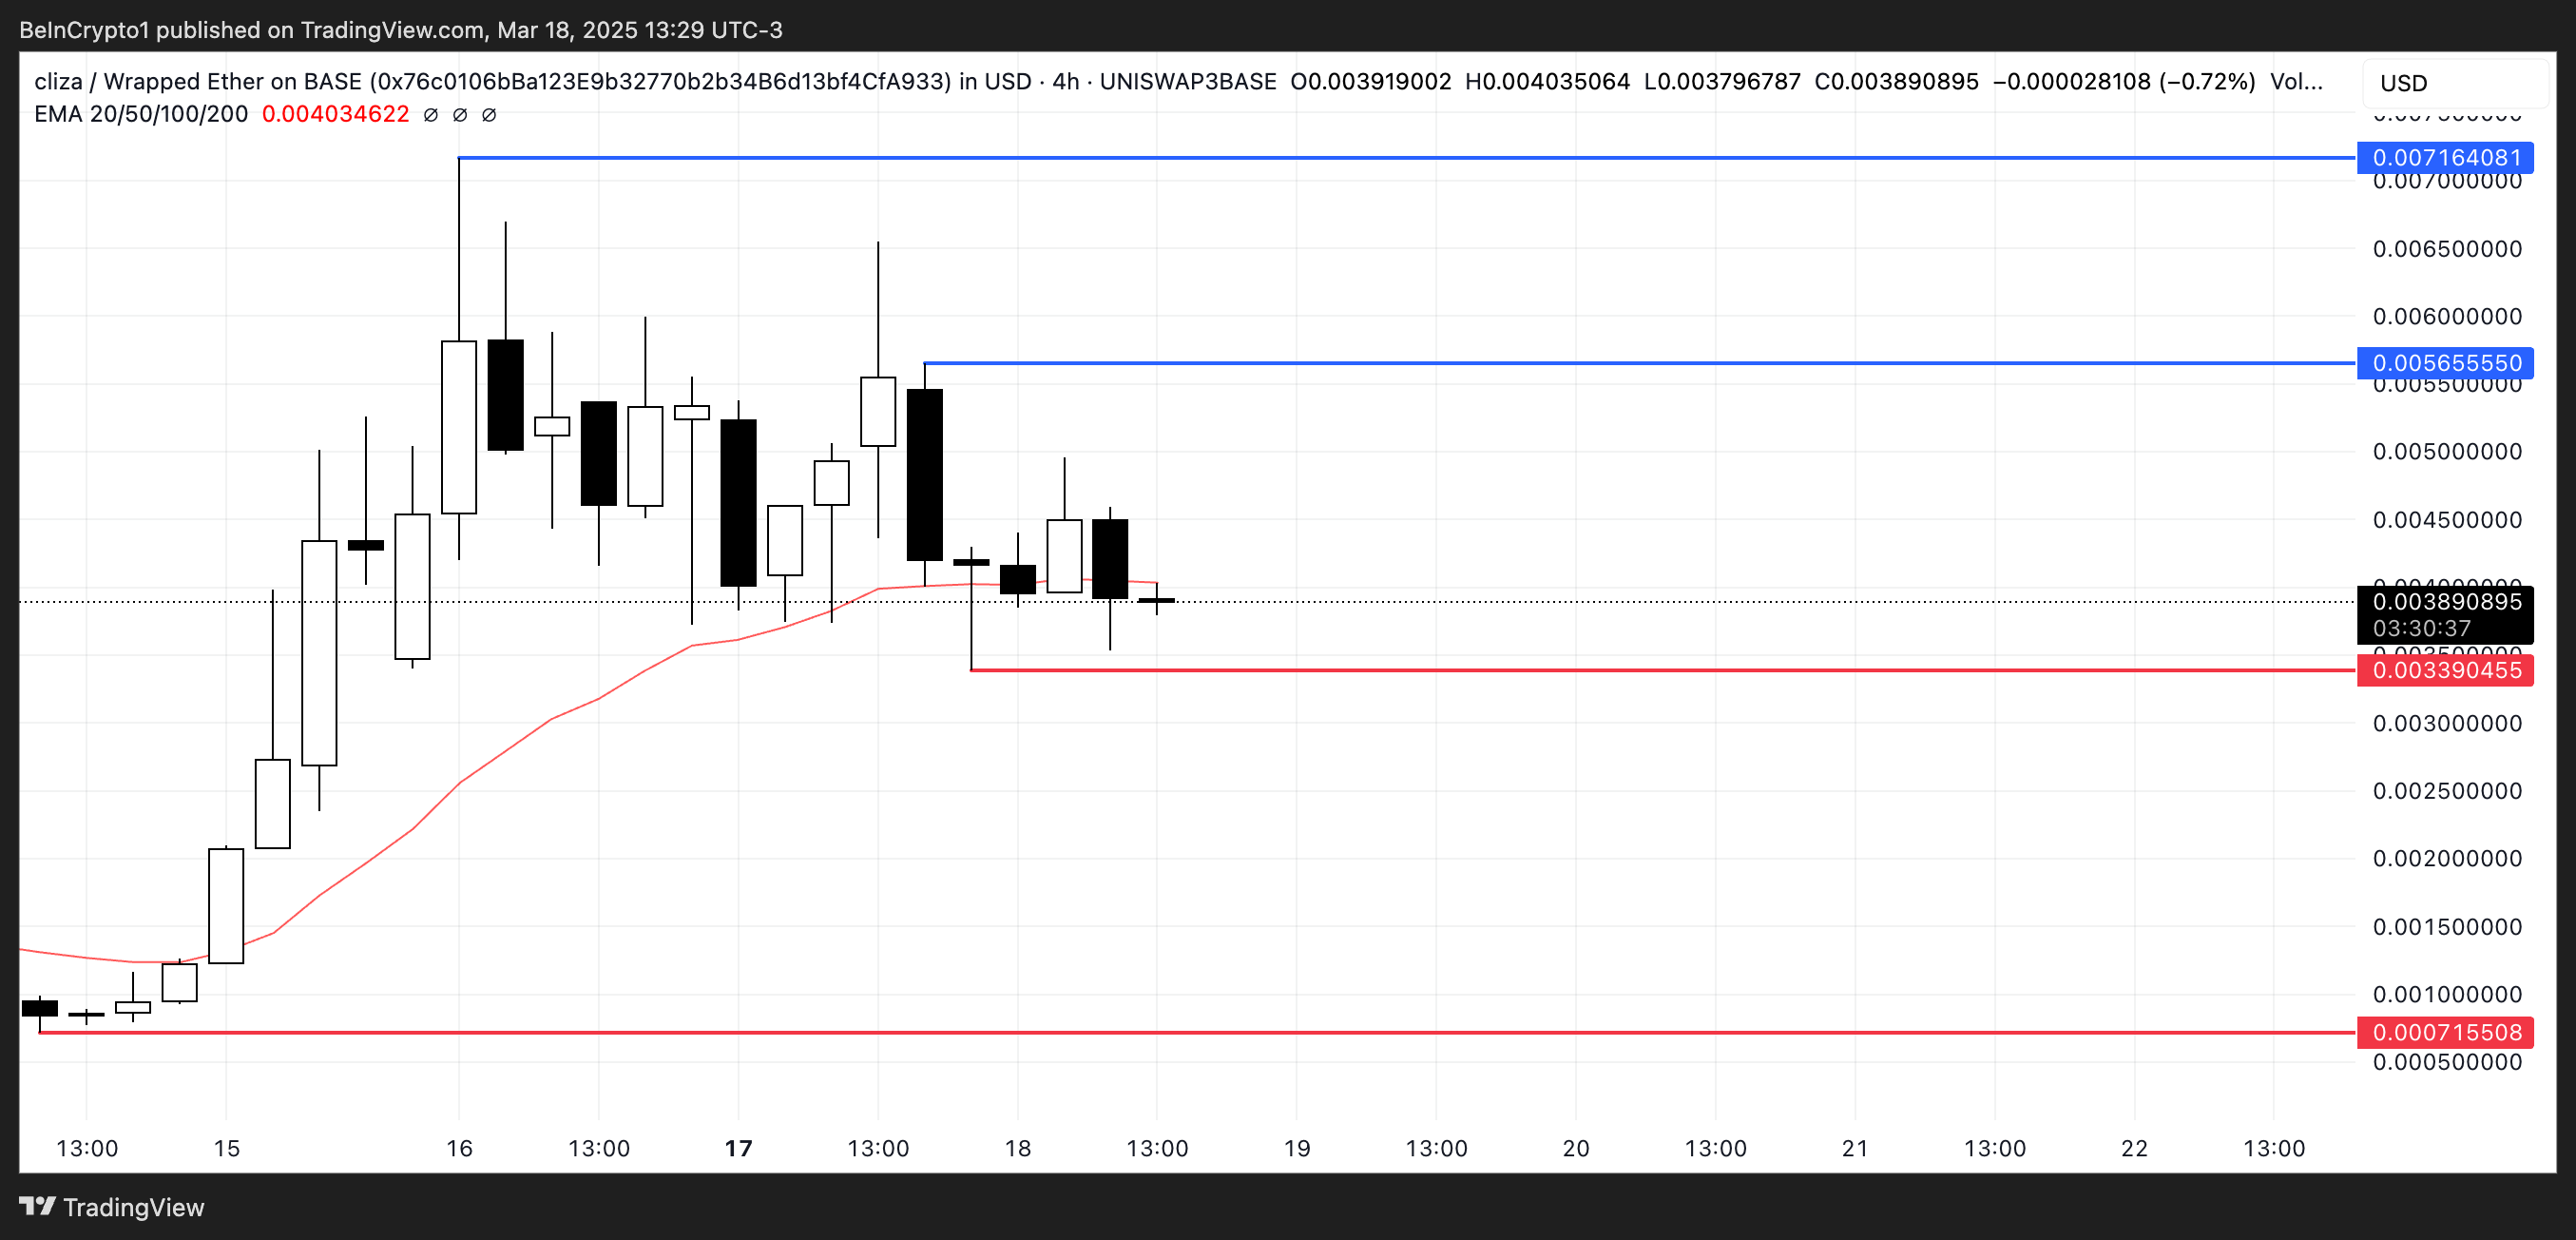
The project currently boasts a market cap of $3.1 million, with daily trading volume reaching $2.3 million and a growing community of nearly 60,000 holders.
If CLIZA loses support at $0.00339, the price could drop further toward $0.00071.
However, if bullish momentum returns, the token could challenge resistance at $0.0056, with a potential push toward $0.0071 if buying pressure accelerates and crypto AI agents recover their upward momentum.
Disclaimer
In line with the Trust Project guidelines, this price analysis article is for informational purposes only and should not be considered financial or investment advice. BeInCrypto is committed to accurate, unbiased reporting, but market conditions are subject to change without notice. Always conduct your own research and consult with a professional before making any financial decisions. Please note that our Terms and Conditions, Privacy Policy, and Disclaimers have been updated.


Gold prices have surpassed $3,300 per ounce, setting a historic high as global markets face heightened volatility.
This surge reflects investor anxiety over economic uncertainty and highlights the significant impact of controversial tariff policies under President Trump. Consequently, experts have issued conflicting forecasts on how this may influence Bitcoin.
What’s Driving Gold to Keep Breaking Records?
At the time of writing, gold has surged past $3,000, reaching a peak of $3,317. That marks a 25% increase since the beginning of the year.

According to a report in The New York Times, the global trade war is the primary force behind gold’s continued rise. Retaliatory tariffs among major economies are clouding the global economic outlook.
The US imposed new tariffs, quickly triggering countermeasures from China, the European Union, and Canada. In response, the White House escalated the situation further.
“While general uncertainty and deteriorating economic vibes are improving interest in gold, most of gold’s price action is around the uncertainty related to tariffs,” Helima Croft, head of global commodity strategy at RBC Capital Markets, said.
In addition, there are growing concerns that tariffs could directly target imported gold. This fear has led to gold stockpiling within the United States.
Business Standard reported that major banks like JPMorgan Chase and HSBC have been moving large quantities of gold from London to New York. JPMorgan alone plans to transport $4 billion worth of gold this month.
Besides the tariff war, macro analyst Zerohedge pointed to another factor—the Senate Budget Resolution for FY2025. This resolution allows the US to increase its budget deficit by up to $5.8 trillion over the next ten years. Zerohedge suggested that Gold is responding to this news.
The price spike reflects fears of currency devaluation due to ballooning deficits.
Goldman Sachs has also raised its year-end gold forecast to $3,700. The bank cited stronger-than-expected central bank demand and rising recession risks.
What Are Analysts Saying About Bitcoin as Gold Hits a New Peak?
While gold shines, Bitcoin, often called “digital gold,” has drawn mixed opinions.
Anthony Papillano, CEO of Professional Capital Management, told CNBC on April 15 that Bitcoin has dropped around 10% since the start of the year, while gold has gained 20%. However, both assets have risen approximately 35% over the past year.
He also outlined reasons why Bitcoin might soon rally like gold. These include the US government’s strategic Bitcoin reserve plans and the younger generation’s growing view of Bitcoin as part of a long-term investment strategy.
“History tells us Bitcoin’s returns will skyrocket past Gold in the coming months,” Papillano predicted.
Supporting this view, several analysts noted that Bitcoin often follows gold’s upward momentum with a lag of about 100 days, especially during increased global liquidity. Additionally, companies purchased more than 95,400 BTC in the first quarter of 2025, showing strong institutional demand.
However, not everyone agrees. Economist Peter Schiff, a long-time Bitcoin critic, offered a contrasting view. He claimed the best trade right now is to sell all Bitcoin and other cryptocurrencies and invest entirely in gold and silver mining stocks.
Disclaimer
In adherence to the Trust Project guidelines, BeInCrypto is committed to unbiased, transparent reporting. This news article aims to provide accurate, timely information. However, readers are advised to verify facts independently and consult with a professional before making any decisions based on this content. Please note that our Terms and Conditions, Privacy Policy, and Disclaimers have been updated.

Reason to trust
![]()
Strict editorial policy that focuses on accuracy, relevance, and impartiality
Created by industry experts and meticulously reviewed
The highest standards in reporting and publishing
Strict editorial policy that focuses on accuracy, relevance, and impartiality
Morbi pretium leo et nisl aliquam mollis. Quisque arcu lorem, ultricies quis pellentesque nec, ullamcorper eu odio.
Ethereum price started a fresh decline from the $1,690 zone. ETH is now consolidating and might decline further below the $1,580 support zone.
- Ethereum started a fresh decline after it failed to clear $1,700 and $1,720.
- The price is trading below $1,620 and the 100-hourly Simple Moving Average.
- There was a break below a new connecting bullish trend line with support at $1,625 on the hourly chart of ETH/USD (data feed via Kraken).
- The pair could start a fresh increase if it clears the $1,640 resistance zone.
Ethereum Price Faces Rejection
Ethereum price formed a base above $1,550 and started a fresh increase, like Bitcoin. ETH gained pace for a move above the $1,600 and $1,620 resistance levels.
The bulls even pumped the price above the $1,650 zone. A high was formed at $1,690 and the price recently corrected gains. There was a move below the $1,640 support zone. Besides, there was a break below a new connecting bullish trend line with support at $1,625 on the hourly chart of ETH/USD.
The price tested the 50% Fib retracement level of the upward move from the $1,472 swing low to the $1,690 high. Ethereum price is now trading below $1,625 and the 100-hourly Simple Moving Average.
On the upside, the price seems to be facing hurdles near the $1,620 level. The next key resistance is near the $1,640 level. The first major resistance is near the $1,650 level. A clear move above the $1,650 resistance might send the price toward the $1,690 resistance.

An upside break above the $1,690 resistance might call for more gains in the coming sessions. In the stated case, Ether could rise toward the $1,750 resistance zone or even $1,800 in the near term.
More Losses In ETH?
If Ethereum fails to clear the $1,640 resistance, it could start another decline. Initial support on the downside is near the $1,580 level. The first major support sits near the $1,555 zone and the 61.8% Fib retracement level of the upward move from the $1,472 swing low to the $1,690 high.
A clear move below the $1,555 support might push the price toward the $1,525 support. Any more losses might send the price toward the $1,450 support level in the near term. The next key support sits at $1,420.
Technical Indicators
Hourly MACD – The MACD for ETH/USD is gaining momentum in the bearish zone.
Hourly RSI – The RSI for ETH/USD is now below the 50 zone.
Major Support Level – $1,580
Major Resistance Level – $1,640

Semler Scientific (SMLR), a US-based medical technology company, has revealed plans to acquire more Bitcoin (BTC) despite facing a 5.0% unrealized loss on its previous BTC investments.
The firm has filed a Form S-3 registration with the US Securities and Exchange Commission (SEC) to raise up to $500 million through a securities offering. The proceeds would be allocated for general corporate purposes, including expanding its Bitcoin portfolio.
Semler Scientific Files S-3 to Fund Bitcoin Investments
According to the official filing, the firm plans to issue common stock, preferred stock, debt securities, and warrants as part of the securities offering. The SEC filing does not specify the exact amount allocated for Bitcoin purchases. Nonetheless, Semler’s recent activity suggests a strong focus on cryptocurrency.
“We have not determined the amount of net proceeds to be used specifically for such purposes. As a result, management will retain broad discretion over the allocation of the net proceeds of any offering,” the filing read.
This move follows Semler’s previous acquisition of 871 BTC for $88.5 million at an average price of $101,616 per Bitcoin. The purchases were made between January 11 and February 3.
The acquisition increased Semler’s total Bitcoin holdings to 3,192 BTC. The holdings worth $266.1 million represent 80.6% of the company’s total market capitalization of 330.1 million. This indicates that a significant portion of its value is tied to its Bitcoin investments.
“From January 1, 2025, to February 3, 2025, Semler Scientific’s BTC Yield was 21.9%. From July 1, 2024 (the first full quarter after Semler Scientific adopted its bitcoin treasury strategy) to February 3, 2025, Semler Scientific’s BTC Yield was 152.2%,” the firm revealed.
However, the tides have shifted since then. According to Bitcoin Treasuries, Semler’s average BTC acquisition cost is $87,850 per coin. As of the latest data from BeInCrypto, Bitcoin’s market price stood at $83,397, placing Semler at a 5.0% loss on its investment.

Previously, BeInCrypto noted that the losses surged to 14.7% as BTC fell below the $80,000 mark. Despite this, Semler’s leadership appears committed to its Bitcoin strategy, viewing the cryptocurrency as a long-term store of value.
Semler’s strategic push into Bitcoin mirrors those of other firms, such as Strategy (formerly MicroStrategy) and Metaplanet. Earlier this week, the firms acquired BTC worth $285 million and $26.3 million, respectively.
However, Semler’s decision to double down on Bitcoin comes amid financial and legal challenges. On April 15, the company announced a preliminary $29.75 million settlement with the US Department of Justice (DOJ) to resolve allegations of violating federal anti-fraud laws related to marketing its QuantaFlo product.
The settlement is pending final approval. Yet, it adds pressure to Semler’s balance sheet as it navigates its ambitious fundraising and Bitcoin investment plans.
Disclaimer
In adherence to the Trust Project guidelines, BeInCrypto is committed to unbiased, transparent reporting. This news article aims to provide accurate, timely information. However, readers are advised to verify facts independently and consult with a professional before making any decisions based on this content. Please note that our Terms and Conditions, Privacy Policy, and Disclaimers have been updated.

Ethereum Breakout Imminent? Analyst Expects ETH Price Surge To $2,000

Gold Price Hits New All-Time High Above $3,300 Amid Tariff Turmoil

Ethereum Price Dips Again—Time to Panic or Opportunity to Buy?

Did Ethereum Survive The Storm? Analyst Eyes Breakout Next

Bitcoin & Others Slip As Trump Imposes Up To 245% Tariff On China

Semler Doubles Down on Bitcoin Investments Despite Losses

2.52 Million Altcoins Are Ruining Crypto’s Future

Animoca Brands Valuation Tanks 75% In Two Years, Here’s Why

Crypto exchange BingX hacked for $43 million

Are The Big Players Losing Interest?

Hong Kong’s Securities Association Tips Authorities On Crypto Self-Regulation

Coinbase cbBTC Set to go Live on Solana
2.52 Million Altcoins Are Ruining Crypto’s Future
Animoca Brands Valuation Tanks 75% In Two Years, Here’s Why
Crypto exchange BingX hacked for $43 million
Are The Big Players Losing Interest?
Hong Kong’s Securities Association Tips Authorities On Crypto Self-Regulation
Coinbase cbBTC Set to go Live on Solana
-

 Market24 hours ago
Pi Network Price Rise To $1 is Now In The Hands Of Bitcoin
-

 Altcoin20 hours ago
Whispers Of Insider Selling As Mantra DAO Relocates Nearly $27 Million In OM To Binance
-

 Market19 hours ago
Trump Family Plans Crypto Game Inspired by Monopoly
-

 Market18 hours ago
ETH Retail Traders Boost Demand Despite Institutional Outflows
-
 Altcoin18 hours ago
Could Tomorrow’s Canada Solana ETF Launch Push SOL Price to $200?
-

 Market16 hours ago
Bitcoin Eyes $90,000, But Key Resistance Levels Loom
-
 Altcoin24 hours ago
Has XRP Price Already Bottomed? Analyst On How Ripple Coin Can Hit $15
-

 Market20 hours ago
Forget XRP At $3, Analyst Reveals How High Price Will Be In A Few Months
