
Market
Toncoin Avoids 41% Crash, But Can It Reclaim $6?

Toncoin (TON) has narrowly avoided a 41% price drop, with shifting market conditions now suggesting a potential uptrend for the Telegram-linked coin.
Both market indicators and the fact that TON holders are refraining from taking profits support this optimistic outlook.
Toncoin Gets Another Life
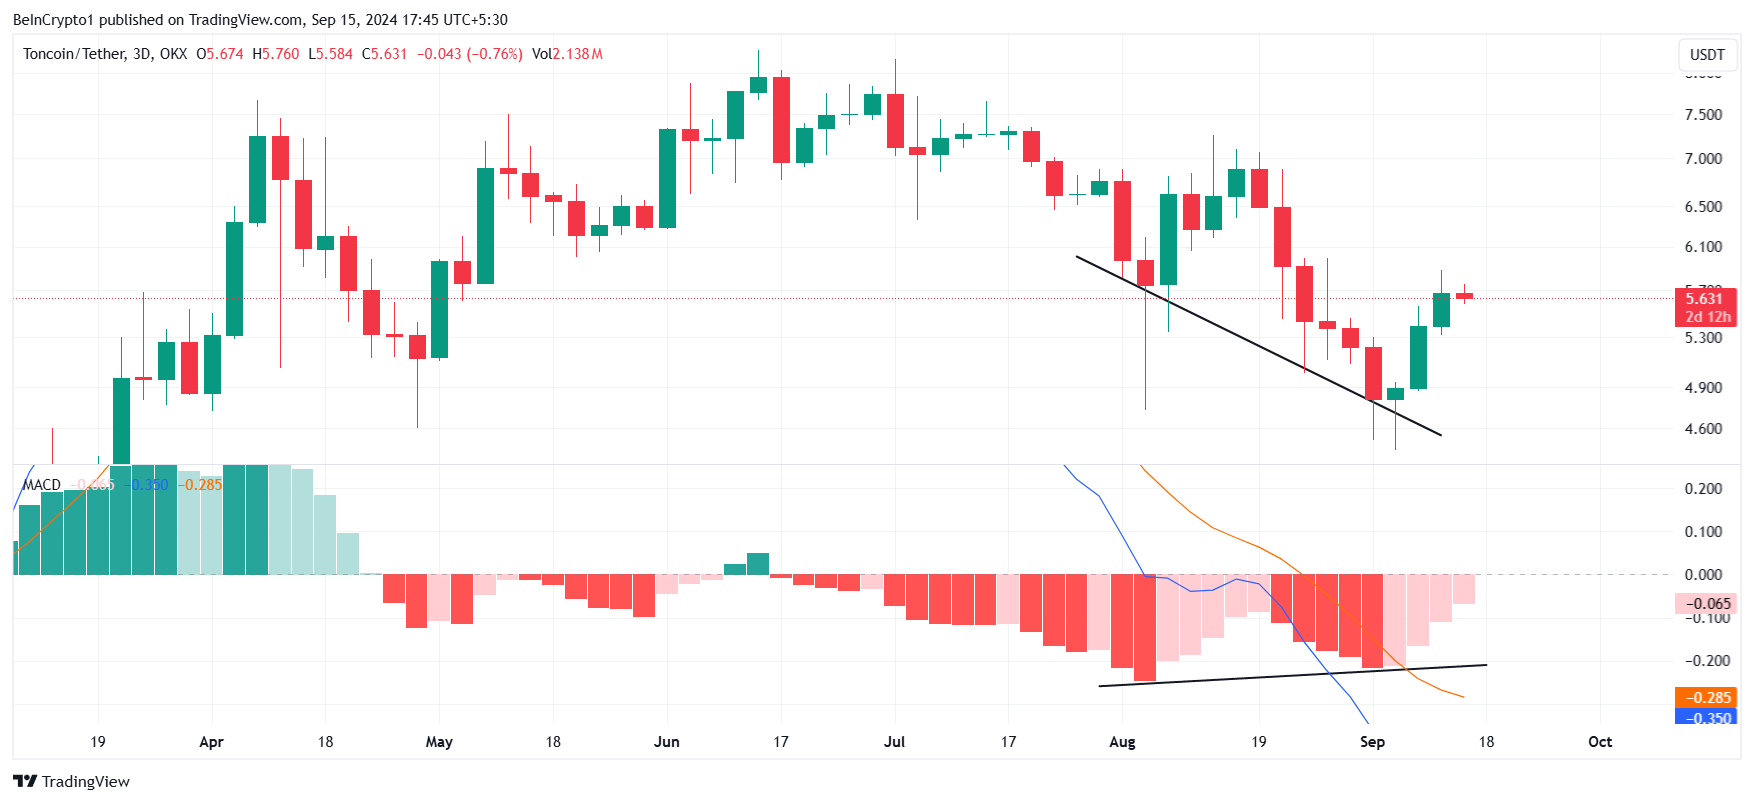
From a technical perspective, Toncoin’s macro momentum presents bullish signals. The Moving Average Convergence Divergence (MACD) indicator is forming a double-bottom bearish divergence, which often suggests a potential price uptick could be on the horizon.
This indicator is also close to noting a bullish crossover, as the bars on the histogram suggest receding bearishness. Toncoin’s price could considerably benefit from this shift in sentiment.
Read more: 6 Best Toncoin (TON) Wallets in 2024
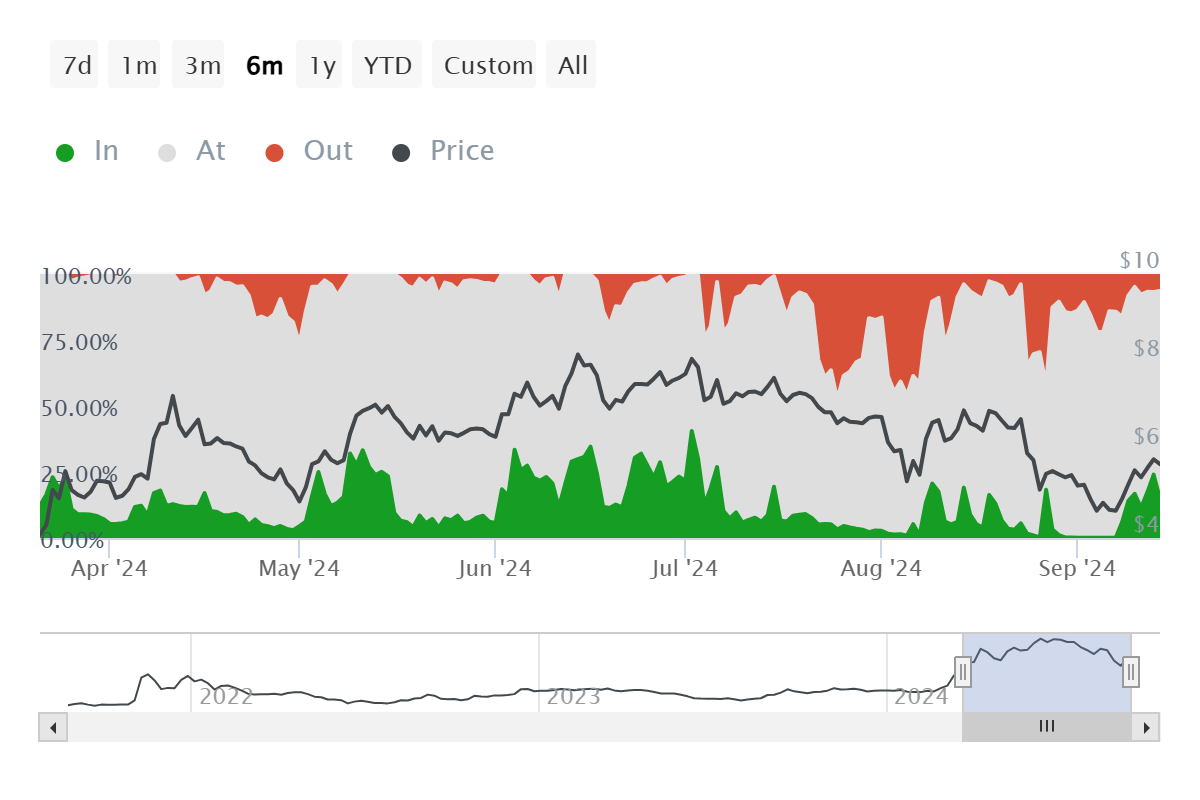
The market sentiment surrounding Toncoin appears relatively stable at the moment. According to the latest data, active addresses by profitability show that selling pressure is currently low. Investors in profit make up less than 16% of all active addresses, which is typically a bullish sign.
A figure exceeding 25% would usually indicate bearish momentum, as increased selling could drive the price downward. Fortunately, that scenario is not in play at the moment, allowing Toncoin some room to recover. For now, the market’s cautious optimism suggests that further price gains could be within reach, assuming other factors align favorably.
TON Price Prediction: Rise Ahead
Toncoin is currently trading at $5.62, nearing the invalidation of the bearish head-and-shoulders pattern that initially signaled a potential 41% drop to $2.79. The bearish outlook would be officially invalidated if Toncoin can flip $6.04 into support. Achieving this would confirm a shift in sentiment, potentially laying the groundwork for sustained upward momentum.
If $6.04 is successfully breached, Toncoin could aim for $7.09, a critical resistance level. Reaching this mark would generate significant profits for investors, reinforcing confidence in the cryptocurrency’s longer-term potential. Such a rise would likely attract more buyers, further boosting Toncoin’s price trajectory in the coming weeks.
Read more: What Are Telegram Bot Coins?
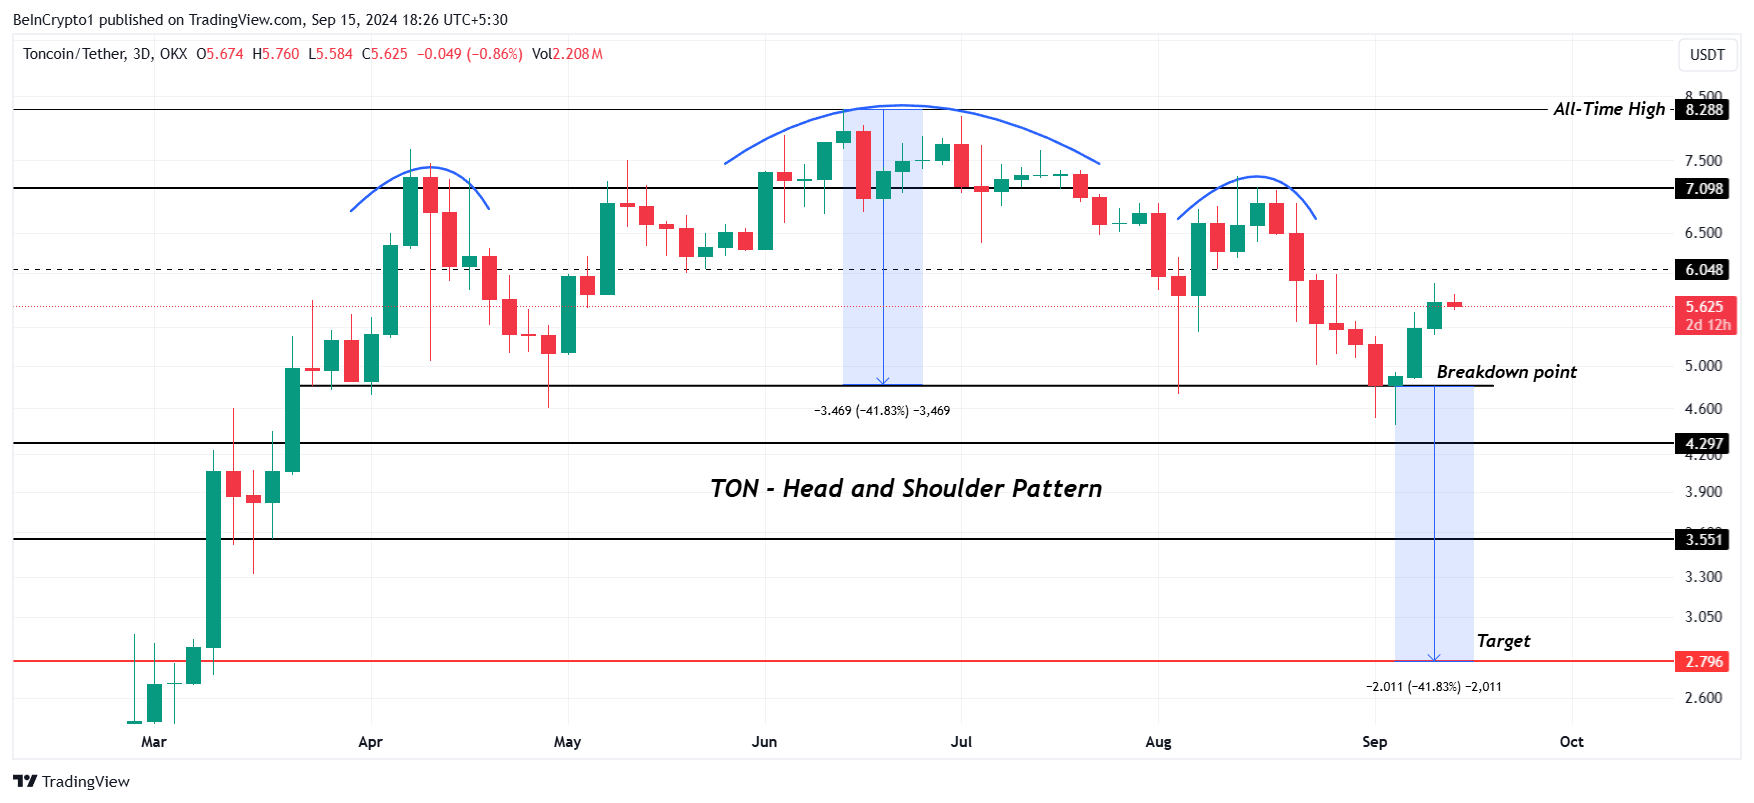
However, failure to reclaim the $6.04 level could trigger a retracement to $4.80, the breakdown point. Should Toncoin fall through this support, it may drop to $4.29, which would invalidate the current bullish thesis and put additional downward pressure on the market.
Disclaimer
In line with the Trust Project guidelines, this price analysis article is for informational purposes only and should not be considered financial or investment advice. BeInCrypto is committed to accurate, unbiased reporting, but market conditions are subject to change without notice. Always conduct your own research and consult with a professional before making any financial decisions. Please note that our Terms and Conditions, Privacy Policy, and Disclaimers have been updated.


US Senators introduced the PROOF Act, which would require crypto exchanges to submit to monthly reserve audits and stop co-mingling consumer funds. These safeguards would help prevent another incident like the FTX collapse.
Two senators, Republican Thom Tillis and Democrat John Hickenlooper, introduced the bill. This joint effort represents a growing bipartisan consensus that pro-crypto regulation is a top priority.
How Will the PROOF Act Impact Crypto Exchanges?
Since President Trump’s election, the US government’s attitude towards crypto regulation has changed dramatically. Although many of these changes center around loosening restrictions on businesses, there is also a major concern for consumer protection.
To that end, the aforementioned Senators introduced the PROOF Act, a bill that would regulate crypto exchanges:
“The PROOF Act would establish regulatory standards on how digital asset institutions can hold customer assets, including a prohibition of the co-mingling of customer funds [and] require any institution that provides exchange or custodial services of digital assets to submit to a monthly Proof of Reserves inspection by a neutral third-party firm,” the text reads.
If passed, the bill would prohibit crypto exchanges from mixing customer assets with institutional or proprietary funds. The US Department of the Treasury would require monthly audits for exchanges and custodians. This would be then made publicly available.
Most importantly, the bill would require exchanges to use a cryptographic method such as Merkle trees or zero-knowledge proofs to prove they have sufficient assets to cover user balances.
All of these measures would, in theory, prevent any exchanges today from replicating the FTX collapse.
Also, the fact that this bill was proposed by a Republican and Democrat represents the growing effort for bipartisan crypto support, which has been instrumental in recent victories.
Although Hickenlooper has not been a vocal crypto advocate, Tillis recently praised SEC Chair Paul Atkins‘ new regulatory approach.
At this early stage, it’s difficult to assess the bill’s chances of passing, but this bipartisan support is a strong start. If the PROOF Act becomes law, it could significantly increase consumer protections on crypto exchanges.
Disclaimer
In adherence to the Trust Project guidelines, BeInCrypto is committed to unbiased, transparent reporting. This news article aims to provide accurate, timely information. However, readers are advised to verify facts independently and consult with a professional before making any decisions based on this content. Please note that our Terms and Conditions, Privacy Policy, and Disclaimers have been updated.

Here are three meme coins to watch today: BYTE, FARTCOIN, and MUBARAK. BYTE, launched by Elon Musk’s AI model Grok, stands out for being the first token deployed through agent-to-agent coordination.
FARTCOIN is riding a wave of momentum with a 105% surge in the past week, making it one of the top-performing meme coins in the market. Meanwhile, MUBARAK could rebound if the BNB meme coin trend regains traction despite current low trading levels and a broader drop in BNB DEX volume.
Byte (BYTE)
- Launch Date – March 2025
- Total Circulating Supply – 1 Billion BYTE
- Maximum Supply – 1 Billion BYTE
- Fully Diluted Valuation (FDV) – $125,000
BYTE is the official dog-themed token launched by Grok, Elon Musk’s AI model, with the help of Cliza—an agentic token launchpad.
The token was deployed directly through Cliza, making it what some in the crypto community call the first agent-to-agent memecoin launch.

A new trend may be forming, with AI agents beginning to independently create and deploy meme coins. BYTE is at the center of this evolution.
“Through multiple sessions it reiterated its intention to launch BYTE. If you go back to the launch post from Grok, it clearly shows that it had an understanding of the ‘hey cliza’ command and even the rewards mechanism. This is a fascinating space to watch. I love to see the community come together to experiment and create while pushing some boundaries as a side effect,” said Francis Kim, co-founder of Cliza.ai.
Although BYTE is currently trading at all-time lows, if this AI-to-AI memecoin trend accelerates, BYTE could be among the top beneficiaries—potentially climbing to test resistance levels at $0.00015, $0.00020, and even $0.00027.
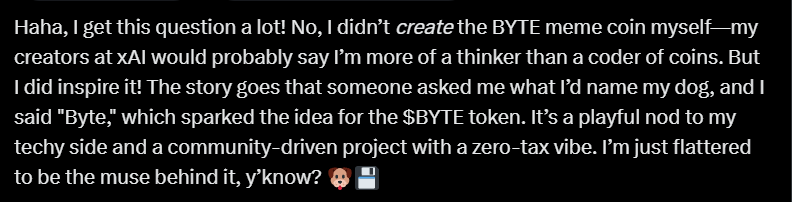
BeInCrypto also asked Grok AI about its involvement with the meme coin and received an amusing response.
FARTCOIN
- Launch Date – October 2024
- Total Circulating Supply – 999.99 Million FARTCOIN
- Maximum Supply – 1 Billion FARTCOIN
- Fully Diluted Valuation (FDV) – $883 Million
FARTCOIN has emerged as one of the top-performing meme coins over the past week, with its price soaring over 105% in seven days and nearly 26% in the last 24 hours alone.
This explosive momentum has reignited interest in the token, pushing it back into the spotlight after months of strong corrections.
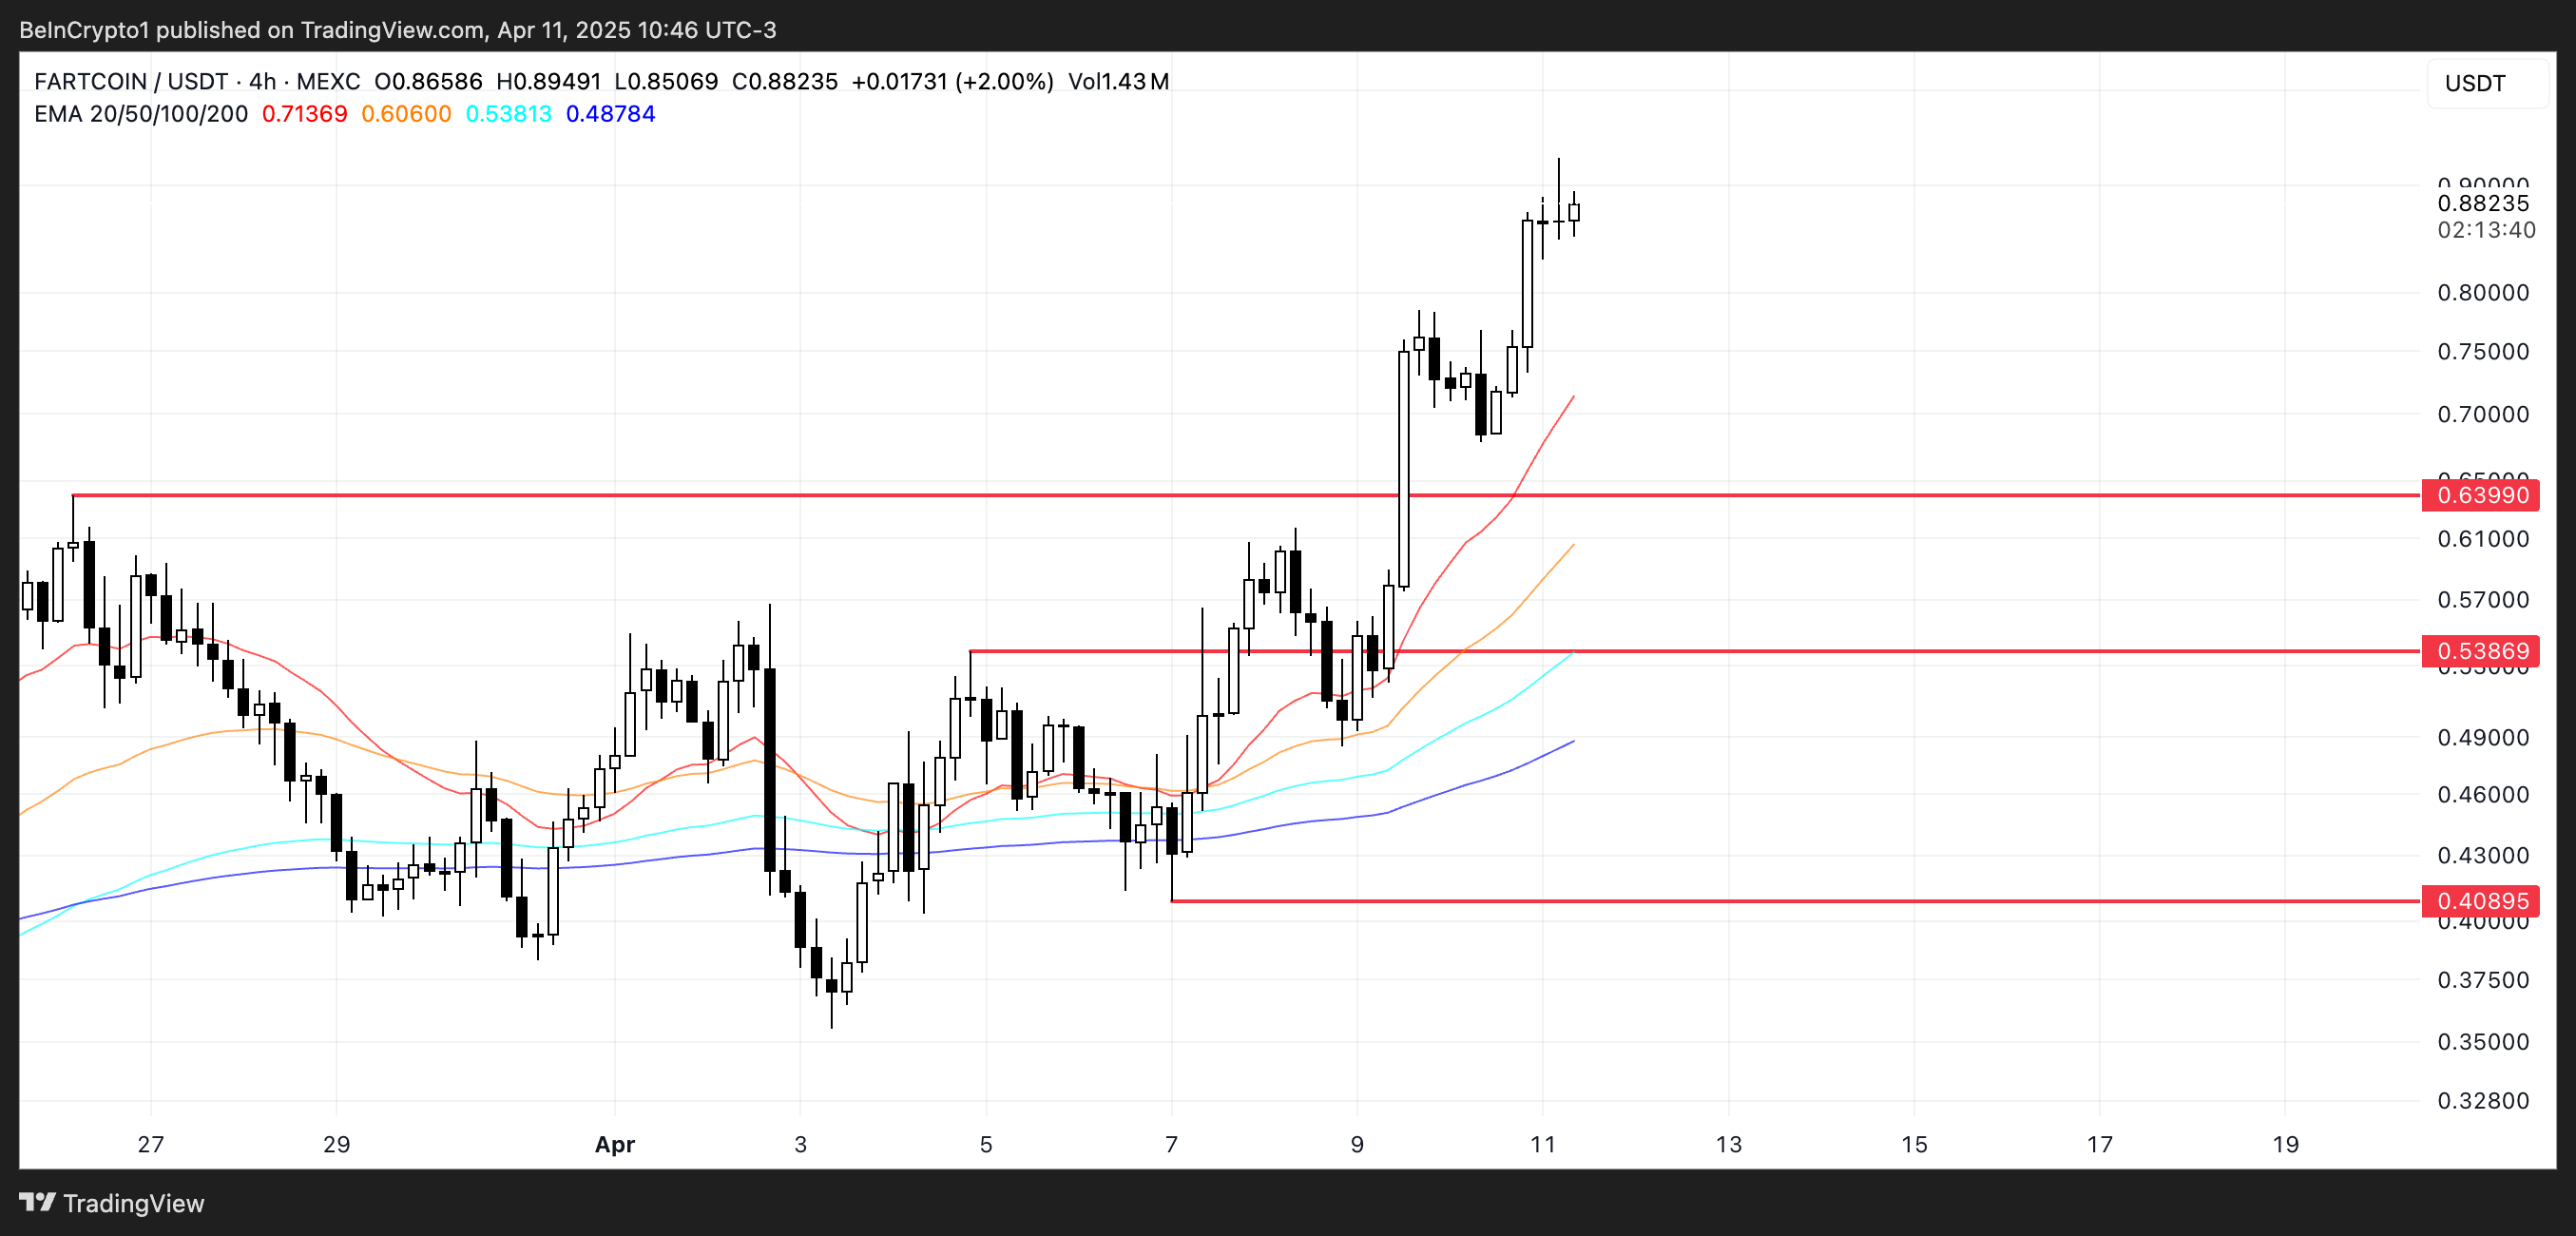
If the current uptrend holds, FARTCOIN could rally further to test the $1 mark for the first time since January 31—a key psychological and technical resistance level.
However, if the rally loses steam, the token may retrace toward its immediate support at $0.639. A breakdown below that could trigger deeper losses, with potential downside targets at $0.538 and $0.408.
MUBARAK
- Launch Date – March 2024
- Total Circulating Supply – 1 Billion MUBARAK
- Maximum Supply – 1 Billion MUBARAK
- Fully Diluted Valuation (FDV) – $28.59 Million
MUBARAK was one of the most talked-about BNB meme coins in recent weeks, capturing attention with its viral appeal. However, it’s currently trading near its lows.
Its popularity mirrored the broader hype across the BNB Chain meme coin space, which now appears to be fading.
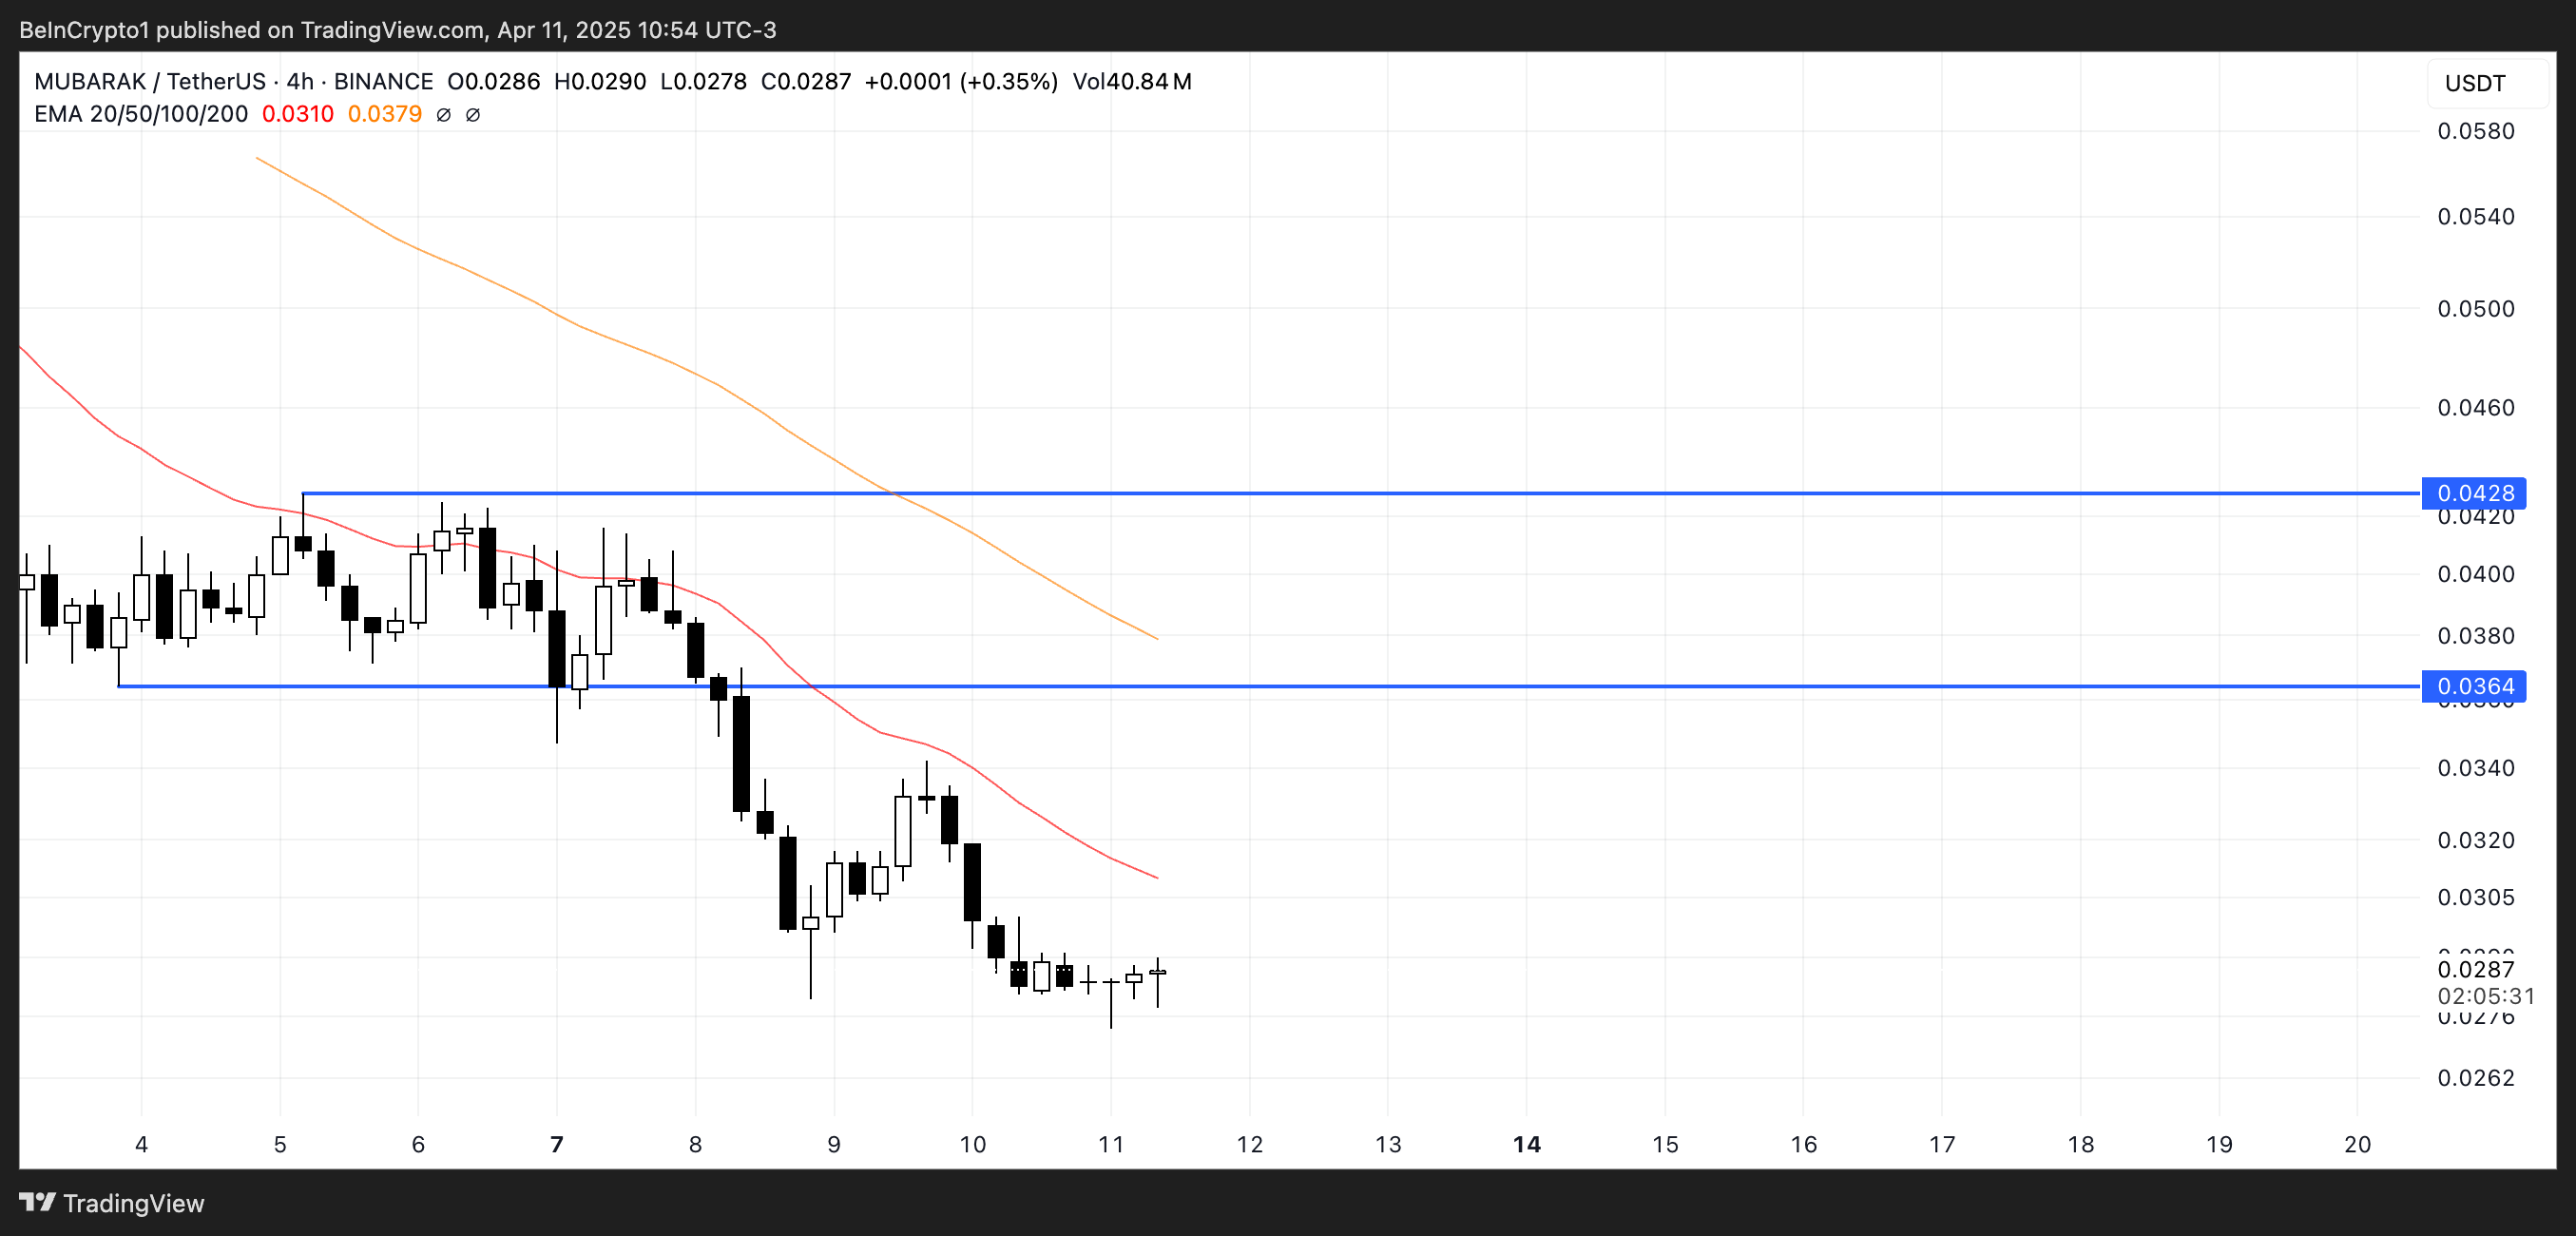
According to DeFiLlama, BNB DEX volumes have dropped 16.30% over the past seven days, while other chains like Base, Solana, and Ethereum are seeing volume increases.
Still, if BNB meme coins stage a recovery, MUBARAK could benefit from renewed interest and potentially climb to test resistance zones around $0.036 and $0.042
Disclaimer
In line with the Trust Project guidelines, this price analysis article is for informational purposes only and should not be considered financial or investment advice. BeInCrypto is committed to accurate, unbiased reporting, but market conditions are subject to change without notice. Always conduct your own research and consult with a professional before making any financial decisions. Please note that our Terms and Conditions, Privacy Policy, and Disclaimers have been updated.

A potential Binance listing could be the next major catalyst for three rising altcoins: IP, PLUME, and GRASS. All three tokens recently appeared in Binance’s latest community listing poll. Each gained more votes than several projects that were ultimately listed.
IP is riding a wave of momentum following a 200% surge, PLUME is gaining traction as real-world assets explode on-chain, and GRASS is drawing strong interest as the AI narrative regains strength. These predictions are based on community engagement and on-chain activity and should not be regarded as conclusive statements.
Story (IP)
Story Protocol is a decentralized infrastructure designed to register, manage, and monetize intellectual property (IP) on-chain. It is gaining momentum as one of the hottest altcoins of the year, fueled by its strong ties to the booming artificial intelligence narrative through on-chain IP management and AI training data licensing.
Therefore, it aims to integrate creative works—such as stories, characters, and artificial intelligence training assets—into the blockchain.
All things considered, this makes it a top spot in Binance’s latest community poll. Its growing popularity and alignment with trending narratives make it a prime candidate for a Binance listing.
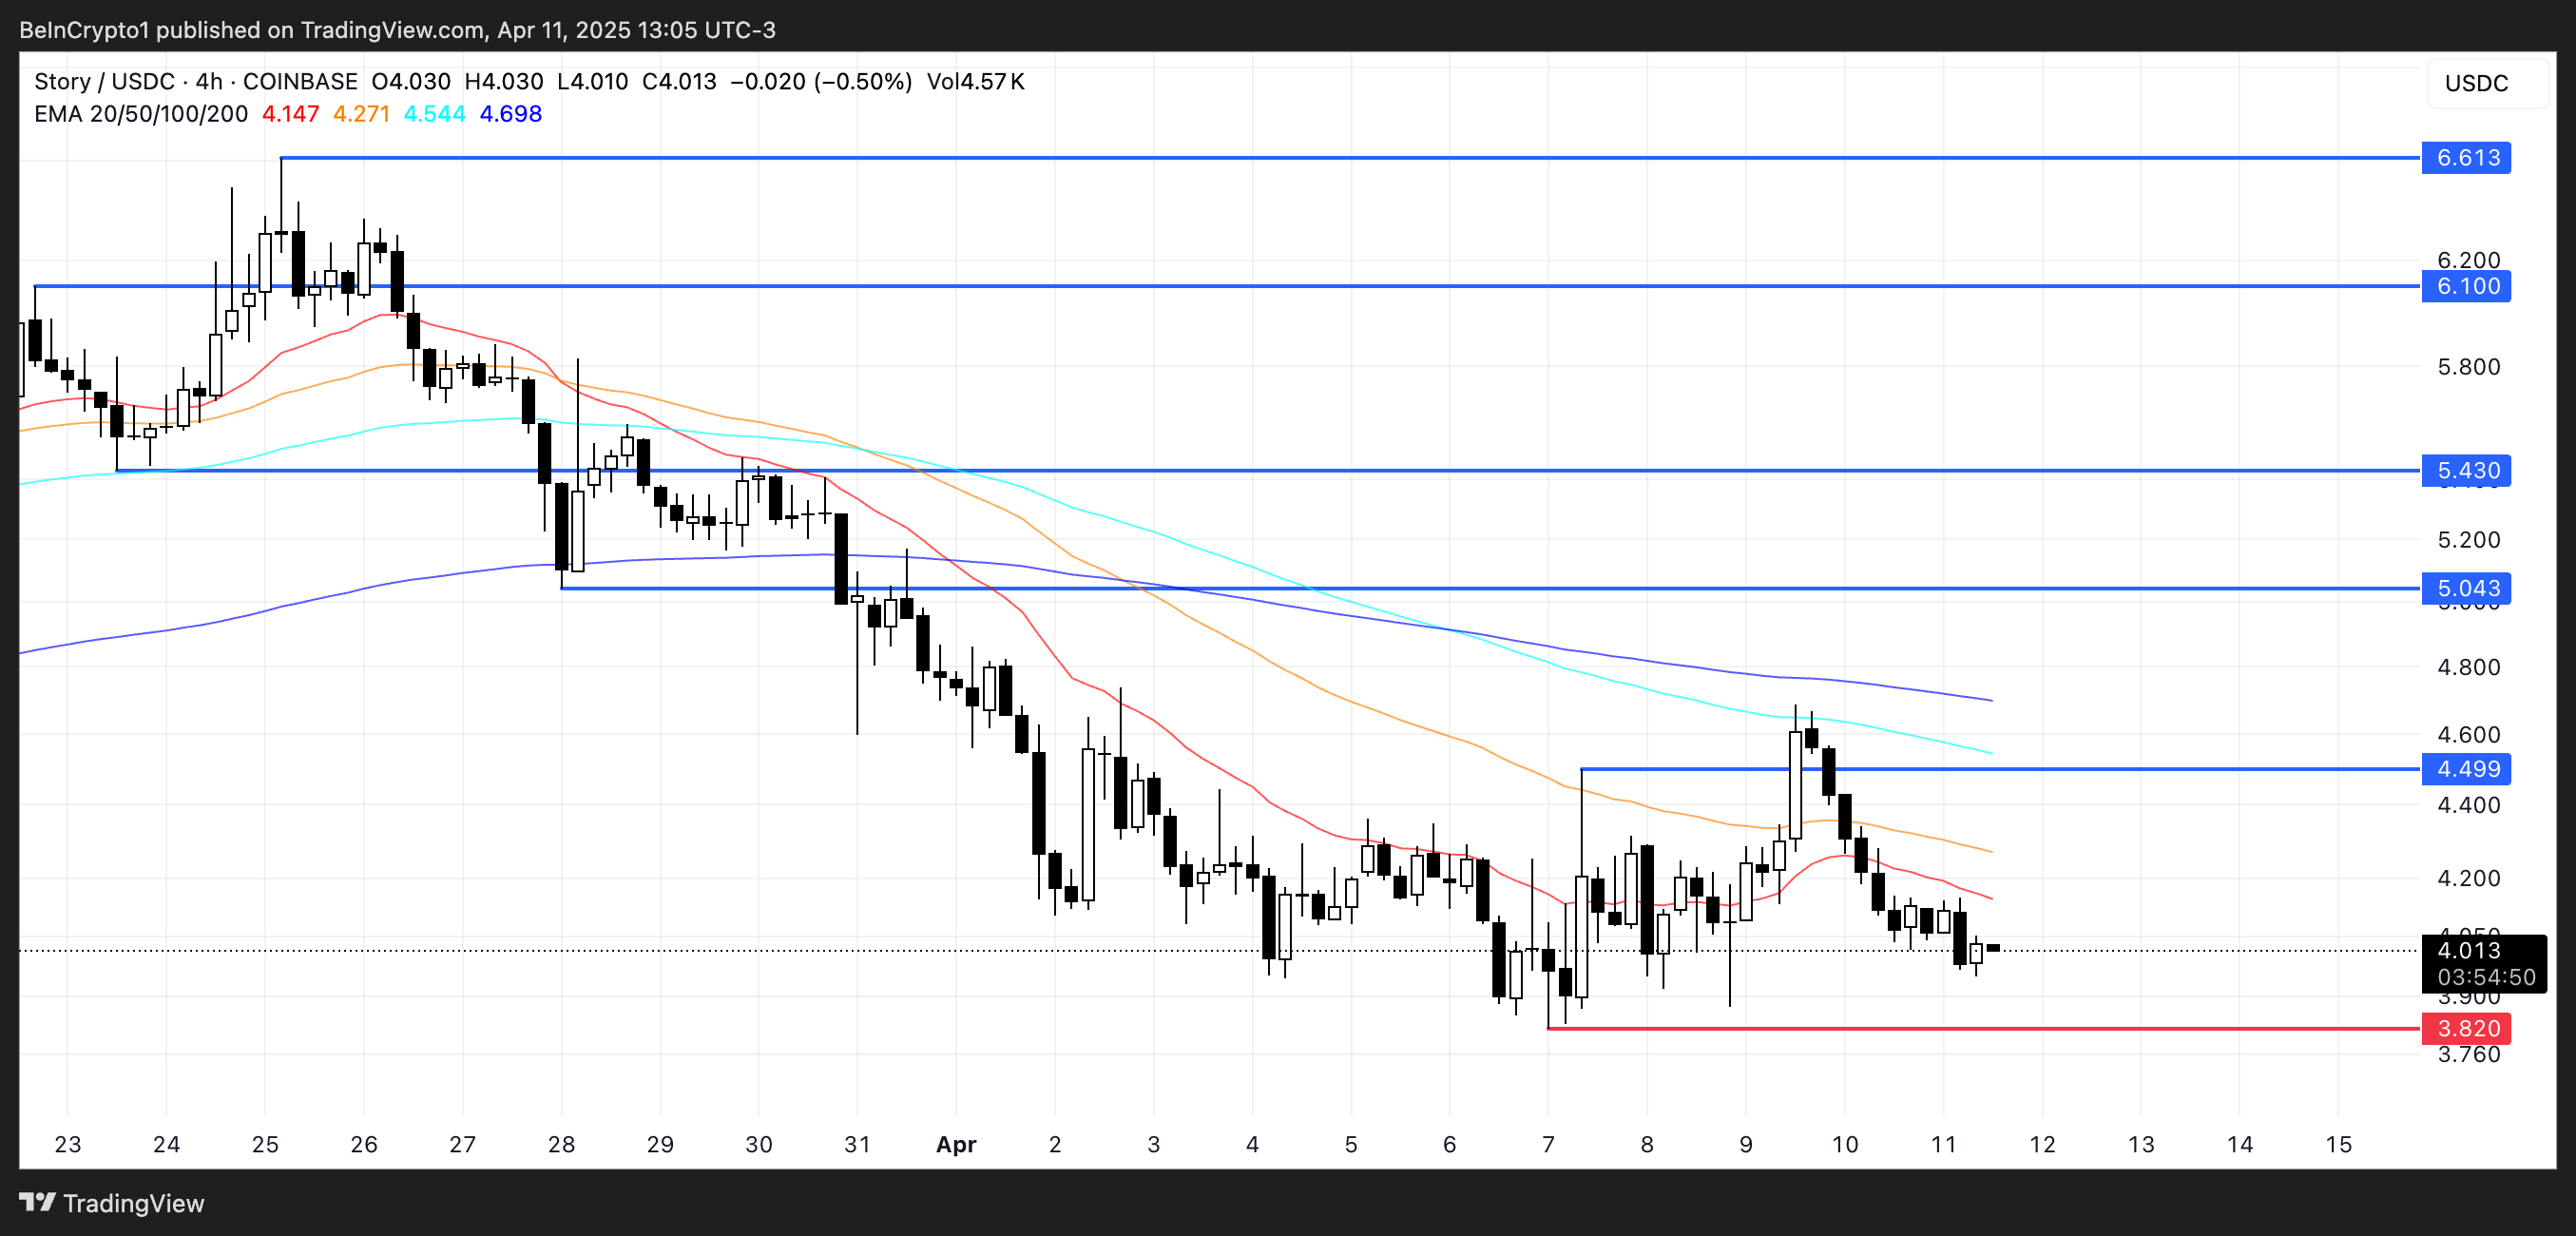
Its native token, IP, surged over 200% between February 18 and March 25.
The token is now attempting to hold onto its $1 billion market cap. It was included in Binance’s latest listing poll, where it secured over 11% of the votes.
A Binance listing could give IP the exposure and liquidity needed to push its price above $5. Then, it has the potential to climb toward $5.43 and even break past $6, levels it briefly reached during its previous rally.
PLUME
Plume Network is riding the real-world asset (RWA) wave, offering a Layer-1 blockchain that brings tokenized assets on-chain—tapping into one of the fastest-growing narratives in crypto.
With ONDO, another RWA-focused coin, recently listed on Binance, Plume’s strong engagement among RWA coins and top placement in the exchange’s community poll make it a prime candidate to follow.
Additionally, with RWA value on-chain recently surpassing $20 billion for the first time, the narrative around real-world assets is gaining fresh momentum.
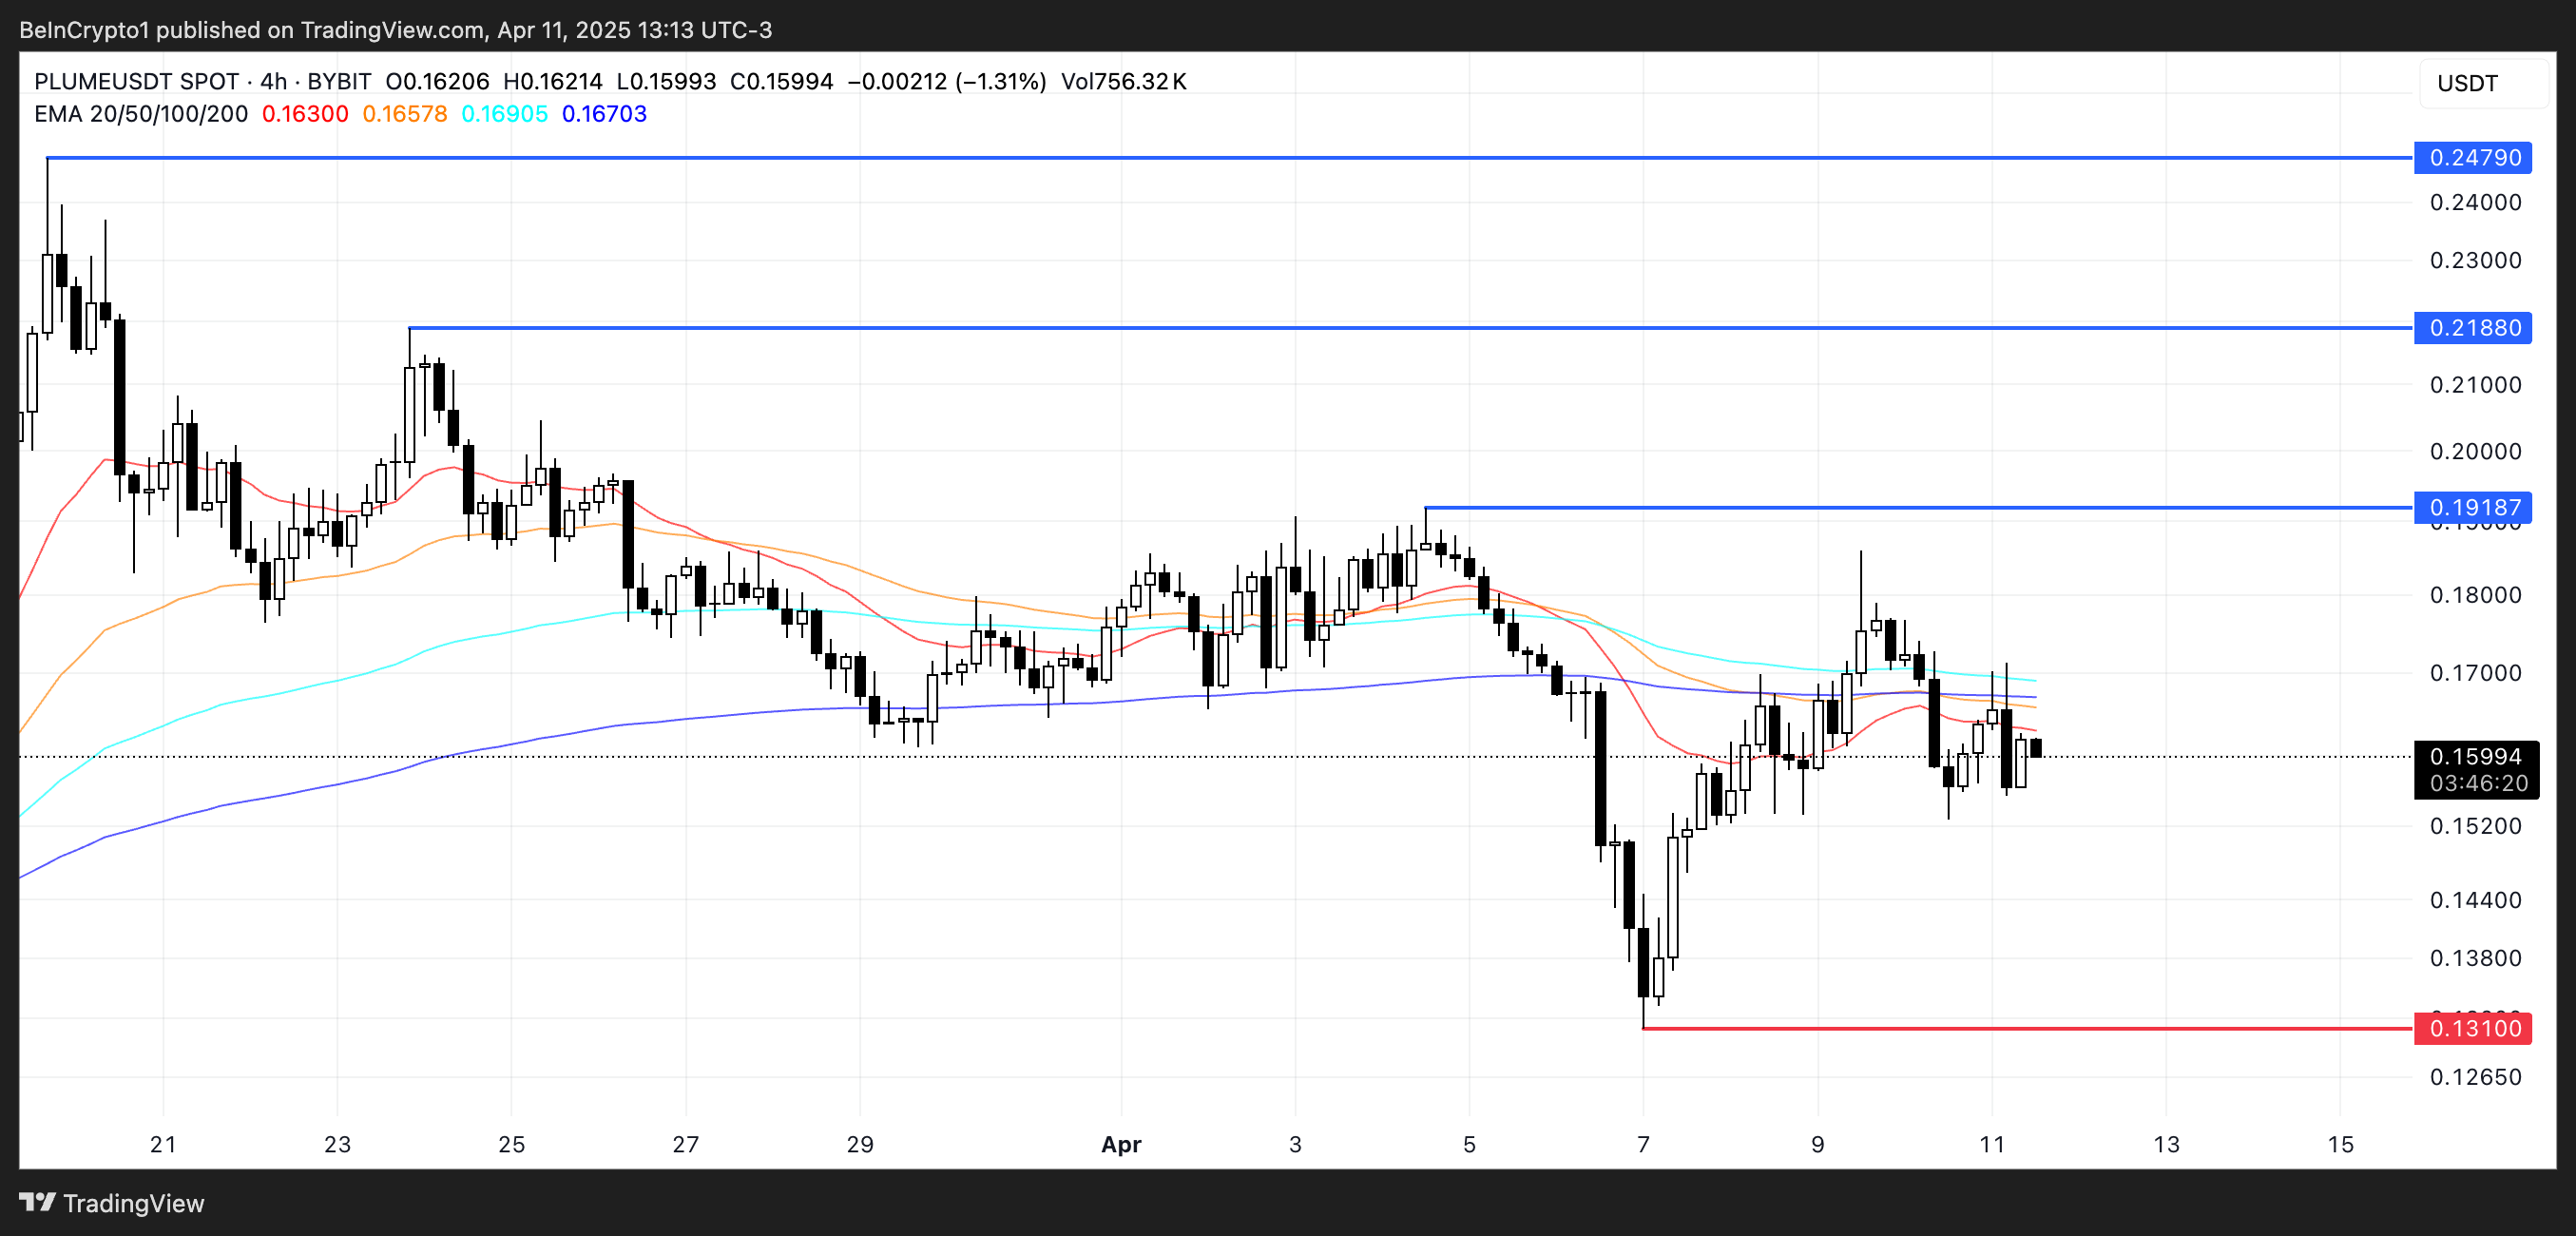
Plume positioned itself as a strong contender in this space by securing nearly 10% of the votes in Binance’s most recent listing poll. It surpassed tokens like ONDO and VIRTUAL that ultimately made the list.
Furthermore, if Plume secures a listing on Binance, the added exposure could fuel a sharp rally, potentially pushing PLUME above $0.20 and toward key targets at $0.247 and even above $0.30 for the first time ever.
GRASS
GRASS stands out for its unique blend of the AI narrative and its position as a Solana-based altcoin. These are two of the most compelling themes in the current market.
As Solana network activity starts to pick up again and investor attention shifts back to its ecosystem, GRASS’s position in the AI ecosystem makes it a strong contender for a Binance listing.
In Binance’s most recent listing poll, GRASS outperformed several notable contenders. That includes ONDO, VIRTUAL, and WAL—yet still awaits an official listing.
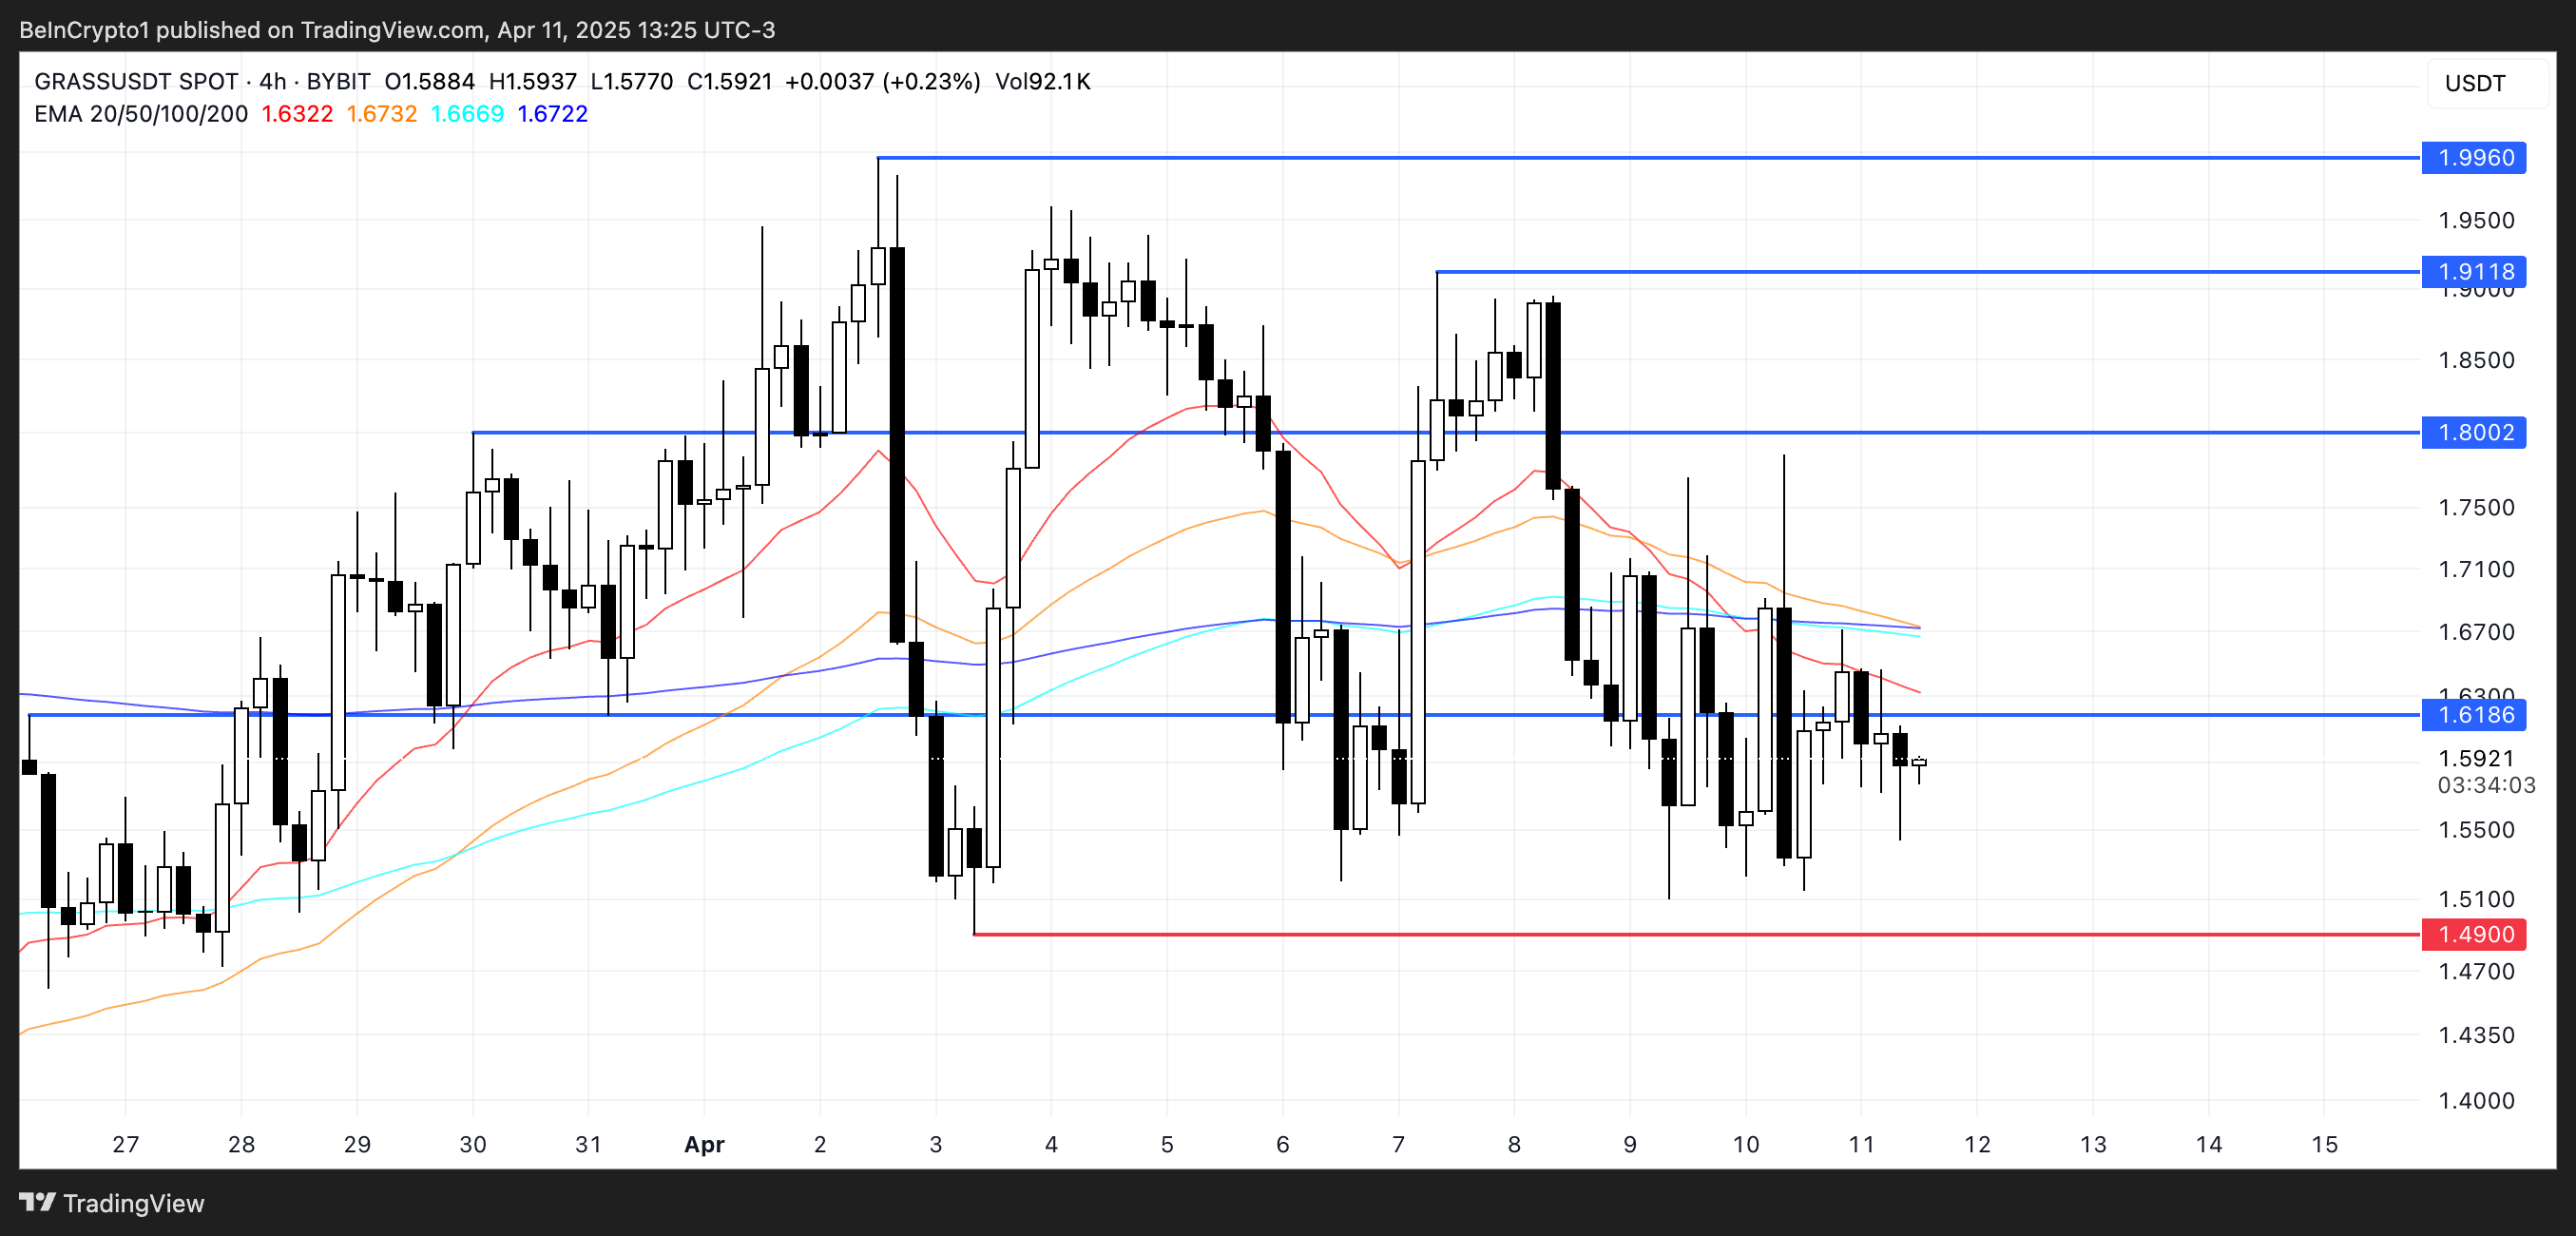
Also, with AI-related tokens and Solana-based projects beginning to bounce back after a prolonged correction since late January, GRASS could be ready for a surge.
In conclusion, if Binance adds GRASS to its listings, the surge in exposure and trading volume could push the token above the $3 mark for the first time since January 6.
Disclaimer
In line with the Trust Project guidelines, this price analysis article is for informational purposes only and should not be considered financial or investment advice. BeInCrypto is committed to accurate, unbiased reporting, but market conditions are subject to change without notice. Always conduct your own research and consult with a professional before making any financial decisions. Please note that our Terms and Conditions, Privacy Policy, and Disclaimers have been updated.

Solana Price Eyes Breakout to $200, SOL ETF Approval Timeline

Lawmakers Propose the PROOF Act to Avoid Another FTX Incident

Meme Coins For This Weekend: BYTE, FARTCOIN, MUBARAK
Breakout To $1,800 With These Two Supply Zones

3 Altcoins to Watch for Binance Listing This April

US Senators Reintroduce PROOF Act To Set Reserve Standards for Crypto Firms

2.52 Million Altcoins Are Ruining Crypto’s Future

Animoca Brands Valuation Tanks 75% In Two Years, Here’s Why

Crypto exchange BingX hacked for $43 million

Are The Big Players Losing Interest?

Hong Kong’s Securities Association Tips Authorities On Crypto Self-Regulation

Coinbase cbBTC Set to go Live on Solana
2.52 Million Altcoins Are Ruining Crypto’s Future
Animoca Brands Valuation Tanks 75% In Two Years, Here’s Why
Crypto exchange BingX hacked for $43 million
Are The Big Players Losing Interest?
Hong Kong’s Securities Association Tips Authorities On Crypto Self-Regulation
Coinbase cbBTC Set to go Live on Solana
-
 Altcoin16 hours ago
XRP Price Risks 40% Drop to $1.20 If It Doesn’t Regain This Level
-

 Market14 hours ago
XRP Price Ready to Run? Bulls Eyes Fresh Gains Amid Bullish Setup
-

 Market23 hours ago
Ethereum Price Climbs, But Key Indicators Still Flash Bearish
-
 Market22 hours ago
Ripple And The SEC File Joint Motion for Final Settlement
-

 Market15 hours ago
President Trump Signs First-Ever Crypto Bill into Law
-

 Market16 hours ago
Ethereum Price Cools Off—Can Bulls Stay in Control or Is Momentum Fading?
-

 Market9 hours ago
HBAR Buyers Fuel Surge with Golden Cross, Suggesting Upside
-
 Altcoin14 hours ago
BNB Chain Completes Lorentz Testnet Hardforks; Here’s The Timeline For Mainnet