
Market
This Is Why Bitcoin Surged to $71,000 After 38 Days
Bitcoin (BTC) has surged past the $71,000 mark for the first time since April 12. It is currently trading at $71,200.
This significant milestone comes amid a broader market rally driven by optimism over spot Ethereum exchange-traded fund (ETF) approval. The optimism stems from recent announcements by Eric Balchunas and James Seyffart, ETF analysts at Bloomberg Intelligence.
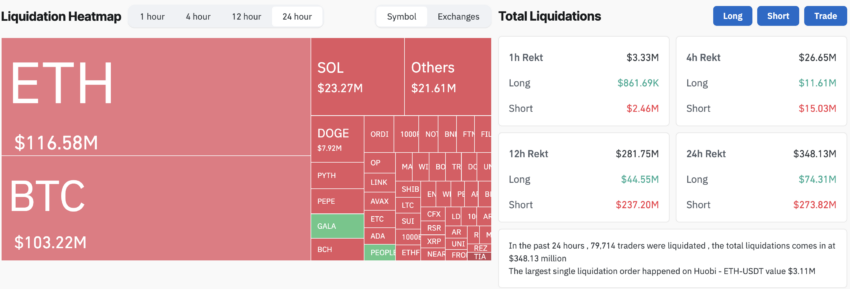
Crypto Market Rally Causes Liquidations Worth Over $348 Million
The ETF analysts have increased their odds of a spot Ethereum ETF approval from 25% to 75%. Balchunas cited increasing political pressure on the SEC for their revised forecast. Moreover, the approval odds increased to over 54% on the prediction platforms like Polymarket.
Amidst these developments, Ethereum (ETH) experienced a nearly 20% rally within 24 hours. Bitcoin followed suit, with its price rising by approximately 7%. This price surge led to significant market liquidations.
Read more: Ethereum ETF Explained: What It Is and How It Works
Data from Coinglass reveals that 79,714 traders faced the wrath of liquidations in the past 24 hours, with total liquidations amounting to $348.13 million. Specifically, short trades saw liquidations of $273.82 million, while long trades saw liquidations of $74.31 million.
“1 month of Bitcoin short position build-up just got liquidated. One more layer to go in order to short-squeeze past all-time highs,” prominent Bitcoin analyst Willy Woo said.
Prior to these events, investors had been accumulating Bitcoin, indicating a bullish sentiment. Over the past week, investors withdrew 30,516 BTC, worth approximately $2.17 billion at current market prices, from 20 crypto exchanges tracked by Coinglass.
The largest outflows were observed on Coinbase Pro, with 14,416.43 BTC withdrawn, followed by Binance, where investors withdrew 8,631.02 BTC.
Crypto outflows from centralized exchanges are generally seen as a positive indicator. It suggests that investors are holding onto their assets, anticipating further price increases rather than planning to sell in the short term.
Read more: Bitcoin Price Prediction 2024/2025/2030
This surge in Bitcoin’s price and the positive sentiment surrounding Ethereum ETFs highlight the ongoing developments in the cryptocurrency market. As regulatory landscapes evolve and investor confidence grows, the market may witness further significant movements.
Disclaimer
In adherence to the Trust Project guidelines, BeInCrypto is committed to unbiased, transparent reporting. This news article aims to provide accurate, timely information. However, readers are advised to verify facts independently and consult with a professional before making any decisions based on this content. Please note that our Terms and Conditions, Privacy Policy, and Disclaimers have been updated.


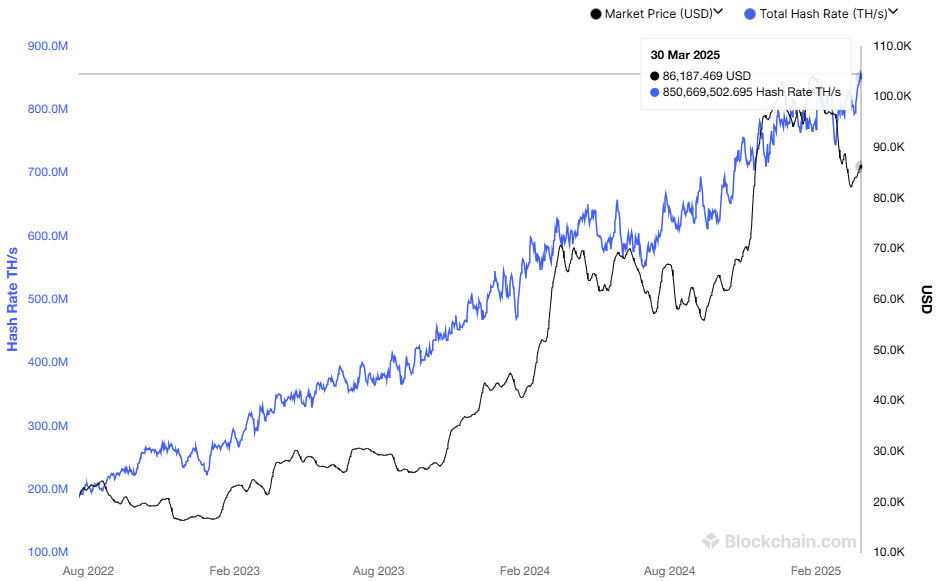
The Bitcoin mining industry is becoming increasingly competitive as the network’s hashrate reaches an all-time high (ATH). At the end of March 2025, Bitcoin’s hashrate hit 850 million TH/s.
However, alongside this impressive growth, the industry is struggling with rising production costs and new tariff barriers, particularly in the US. These factors are putting significant pressure on mining companies and could reshape the sector’s future.
Hashrate Surges, Mining Costs Soar
Bitcoin’s hashrate measures the total computing power used by miners to secure the network and validate transactions. It is expressed in terahashes per second (TH/s), representing the number of hash calculations the network performs every second.
According to Blockchain.com, Bitcoin’s hashrate surpassed 850 million TH/s in March. This increase reflects a rise in miners joining the network and growing confidence in Bitcoin’s value and security.
“Each time the network gets stronger, Bitcoin becomes harder to attack, harder to ignore, and more justified in commanding a higher valuation. This isn’t just code. It’s economic gravity. Bitcoin has become the most secure monetary network humanity has ever seen. And it’s only getting stronger.” — Thomas Jeegers, CFO & COO of Relai commented.
Despite this surge in hashrate, mining profits are not rising accordingly. According to a report from Macromicro, the cost of mining one Bitcoin has doubled since early 2024, now reaching $87,000. The main drivers behind this increase are rising electricity prices and the high operational costs of specialized mining hardware (ASICs).
With Bitcoin’s price fluctuating, many mining companies risk operating at a loss unless they optimize their efficiency. This challenge is particularly severe for smaller miners, who lack the scale advantages or access to cheap electricity that larger firms enjoy.
Tariff Challenges and Dependence on Chinese Hardware
Another major obstacle for Bitcoin miners is trade restrictions, particularly in the US. According to CoinMetrics, ASIC miners produced by Bitmain, a Chinese company, account for approximately 59%–76% of Bitcoin’s total hashrate.
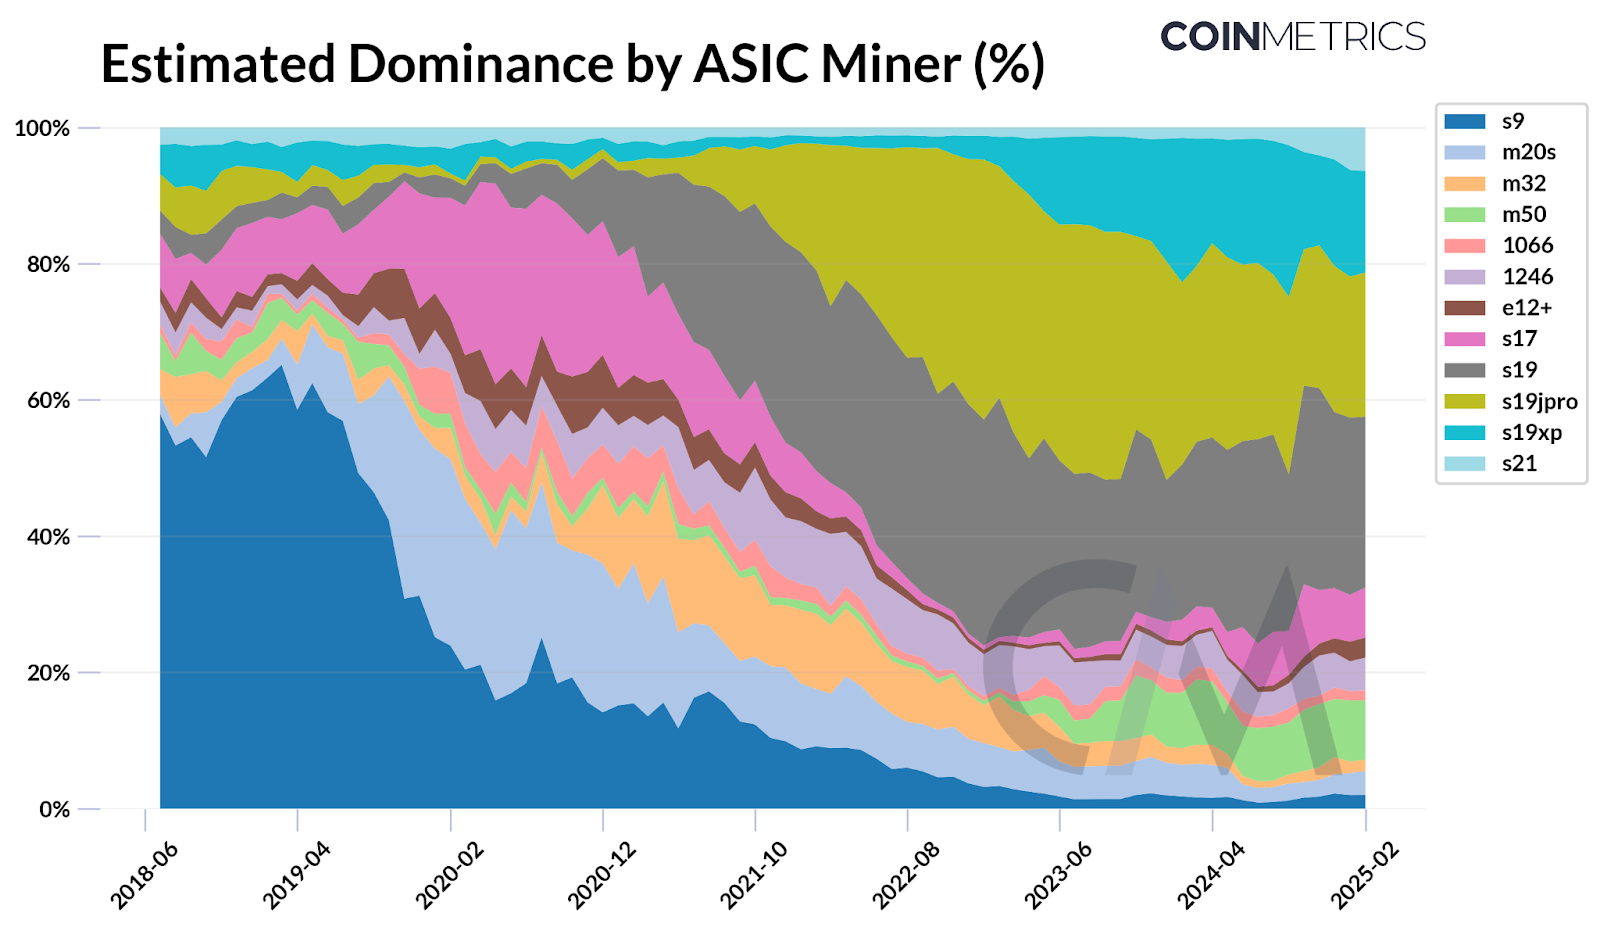
Bitmain has long been a dominant player in mining hardware, with popular models like the Antminer S19 and S21 known for their high efficiency. However, in early 2025, some US mining companies experienced delays in receiving Bitmain shipments due to tighter customs controls and new tariffs on Chinese imports.
“With Bitmain accounting for a majority of Bitcoin’s network hashrate, reliance on a single manufacturer, despite having distributed supply chains, presents a potential risk. Since Bitmain is primarily based in China, its dominance highlights how geopolitical dependencies can affect the stability of mining operations,” CoinMetrics reported.
These tariffs are not new. According to SCMP, the US has imposed duties of up to 27.6% on imported mining equipment from China since 2018.
However, recent measures indicate increasing regulatory scrutiny and trade pressures, further raising import costs for mining hardware. This inflates operational expenses for US-based miners and disrupts supply chains, limiting their ability to scale as global hashrate rises.
Recently, Hut 8 Corp., a Bitcoin mining and high-performance computing infrastructure firm, partnered with Eric Trump and Donald Trump Jr. to establish American Bitcoin Corp.
The company aims to become the largest and most efficient pure-play Bitcoin mining operation globally while building a strong strategic Bitcoin reserve. This move highlights the increasing interest from US institutional investors in the competitive mining industry.
Disclaimer
In adherence to the Trust Project guidelines, BeInCrypto is committed to unbiased, transparent reporting. This news article aims to provide accurate, timely information. However, readers are advised to verify facts independently and consult with a professional before making any decisions based on this content. Please note that our Terms and Conditions, Privacy Policy, and Disclaimers have been updated.

As the crypto market enters Q2 2025, both investors and traders are anticipating a shift from bearish to bullish momentum. This change is essential for altcoins to recover, as many are currently facing challenges in bouncing back. However, growth potential remains for select tokens in the short term.
BeInCrypto has analyzed three altcoins to watch closely as April begins, highlighting the catalysts that could influence their price movements.
THORChain (RUNE)
RUNE’s price is currently at $1.117, hovering just above the $1.110 support level. For a potential rebound, the altcoin needs to reclaim $1.198 as support. Investor sentiment will play a crucial role in whether this upward movement materializes, leading to possible gains for THORChain (RUNE).
THORChain’s 3.4.0 upgrade is scheduled to take place this week, bringing significant improvements to the network. The upgrade could drive positive market sentiment, helping RUNE reclaim $1.198 as support. This momentum may push RUNE towards $1.396, aiding in recovering recent losses and supporting continued price growth.
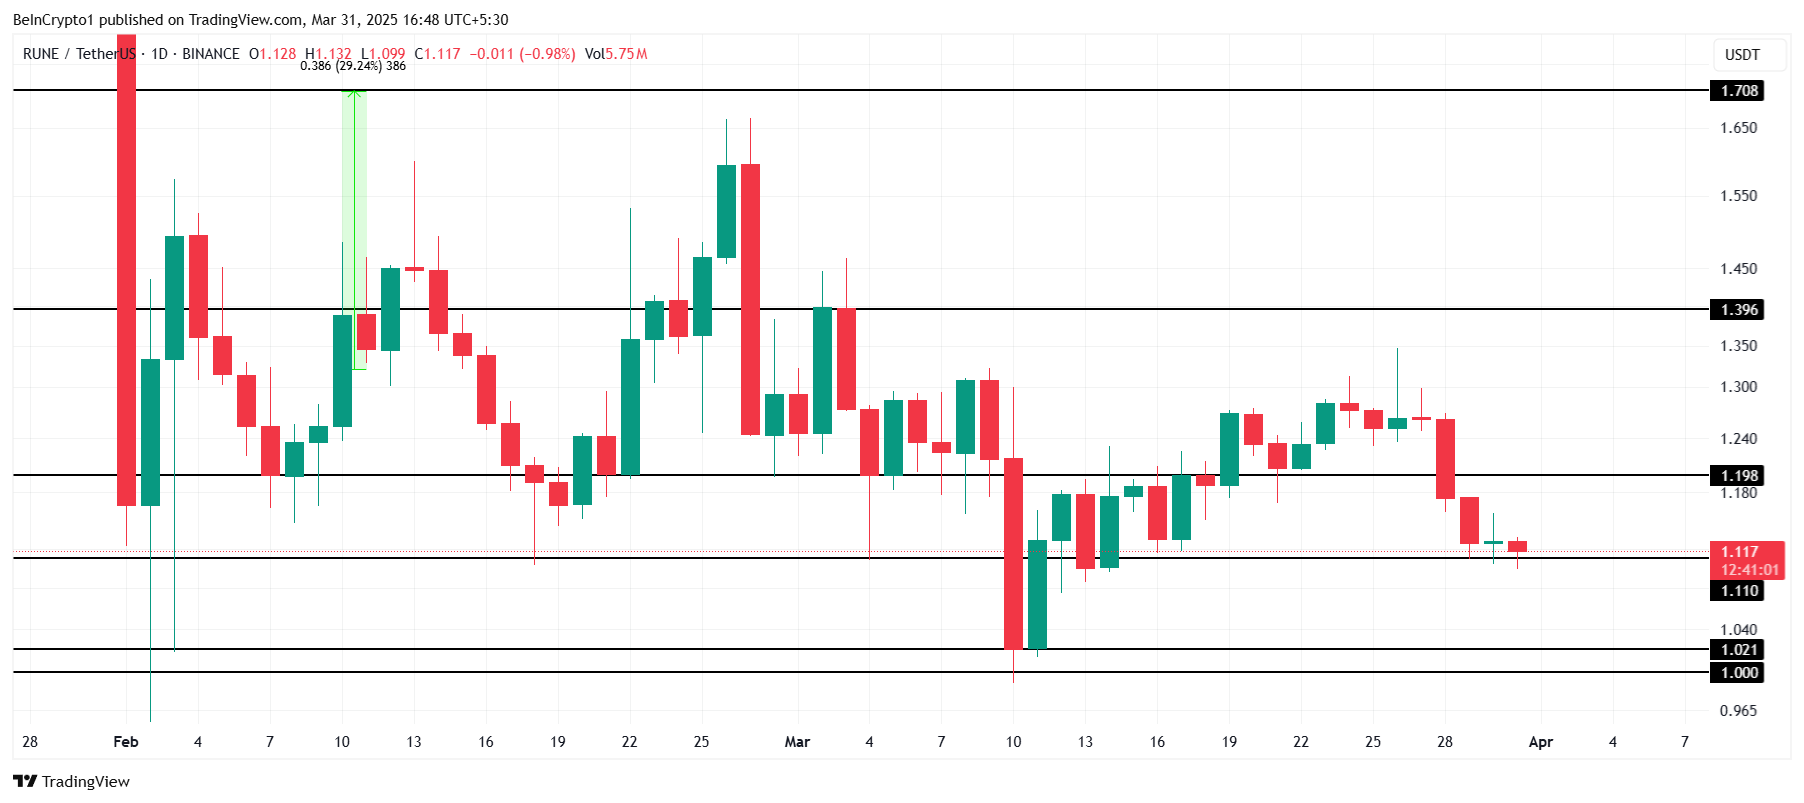
If the support at $1.110 is broken, RUNE may fall to $1.021, pushing it closer to losing the critical $1.000 level. A failure to maintain support could signal a bearish trend, invalidating the bullish outlook.
Artificial Superintelligence Alliance (FET)
FET price saw a 20% decline over the last five days, dropping to $0.452 after losing the support of $0.458. This decline puts the altcoin under pressure. However, the doors for potential recovery are open due to upcoming developments within the network.
The Artificial Superintelligence Alliance network is set for a mainnet upgrade this week, bringing new features to the ASI-1 Mini. This upgrade is expected to act as a catalyst for the price, pushing it toward the key resistance levels of $0.524 and $0.572 to recover recent losses.
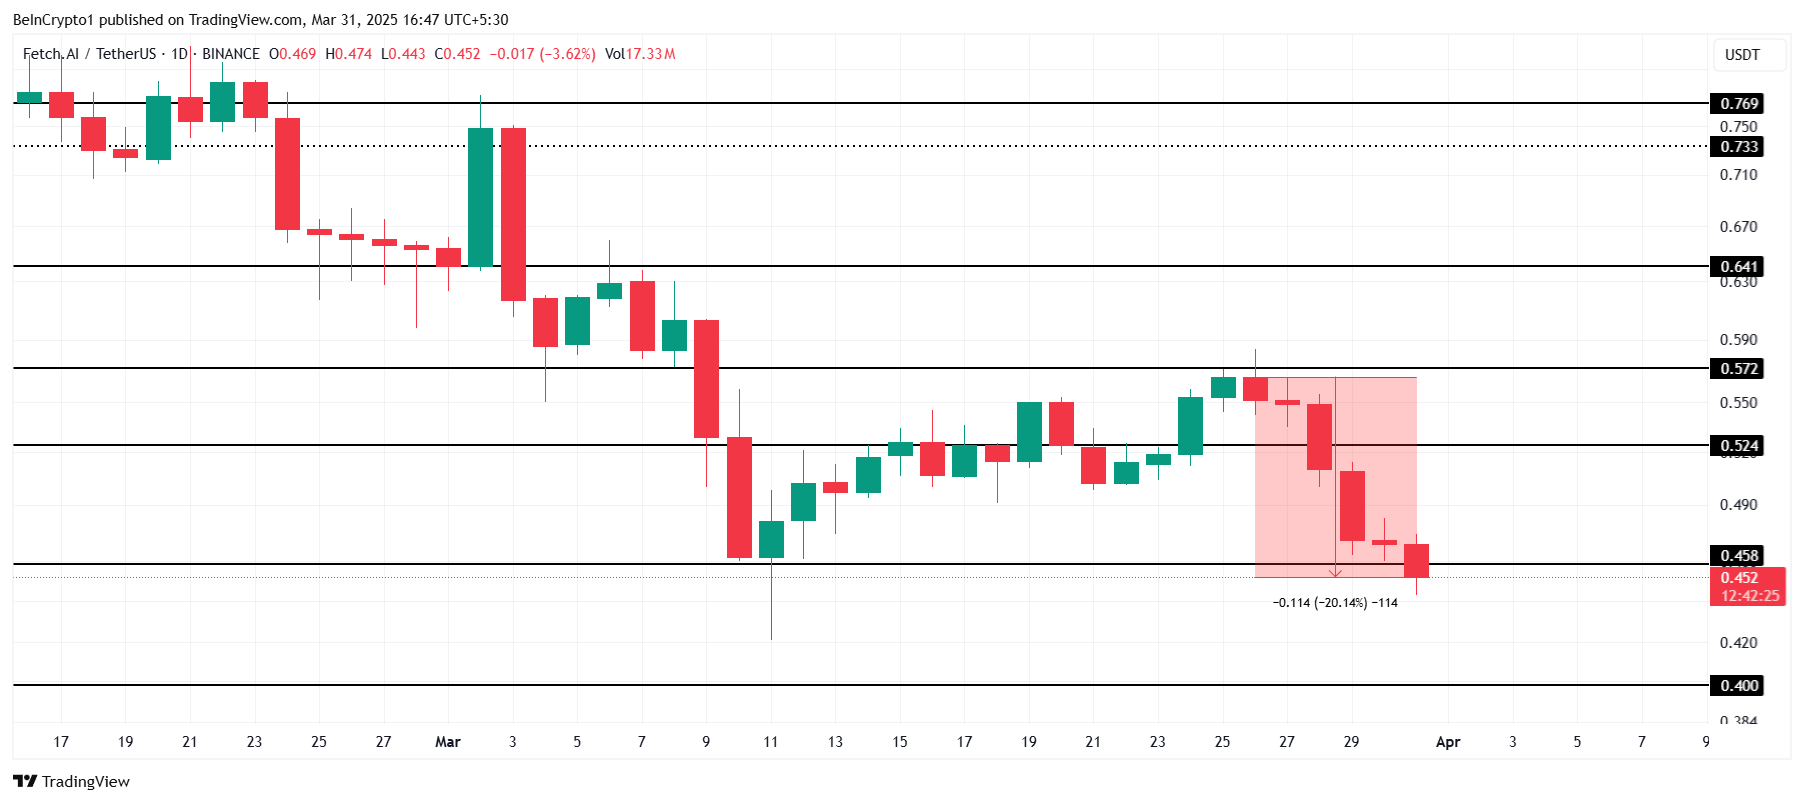
If the bearish trend continues, FET could fall further to $0.400, which would invalidate the bullish outlook and lead to extended losses. The price would need to hold above critical support levels to avoid deeper declines.
Ethereum (ETH)
Ethereum’s price is nearing a 17-month low of $1,745, following a 13.42% drop after failing to break through the $2,141 resistance. This recent price action suggests the altcoin king is struggling to regain momentum. The market conditions remain unfavorable for a quick recovery at this point.
Despite the current market downturn, Ethereum could see some recovery as investors look to capitalize on low prices. A short-term bounceback is possible if ETH successfully flips $1,862 into support, potentially pushing the price above $2,000. This would mark a significant recovery attempt from the recent drop.
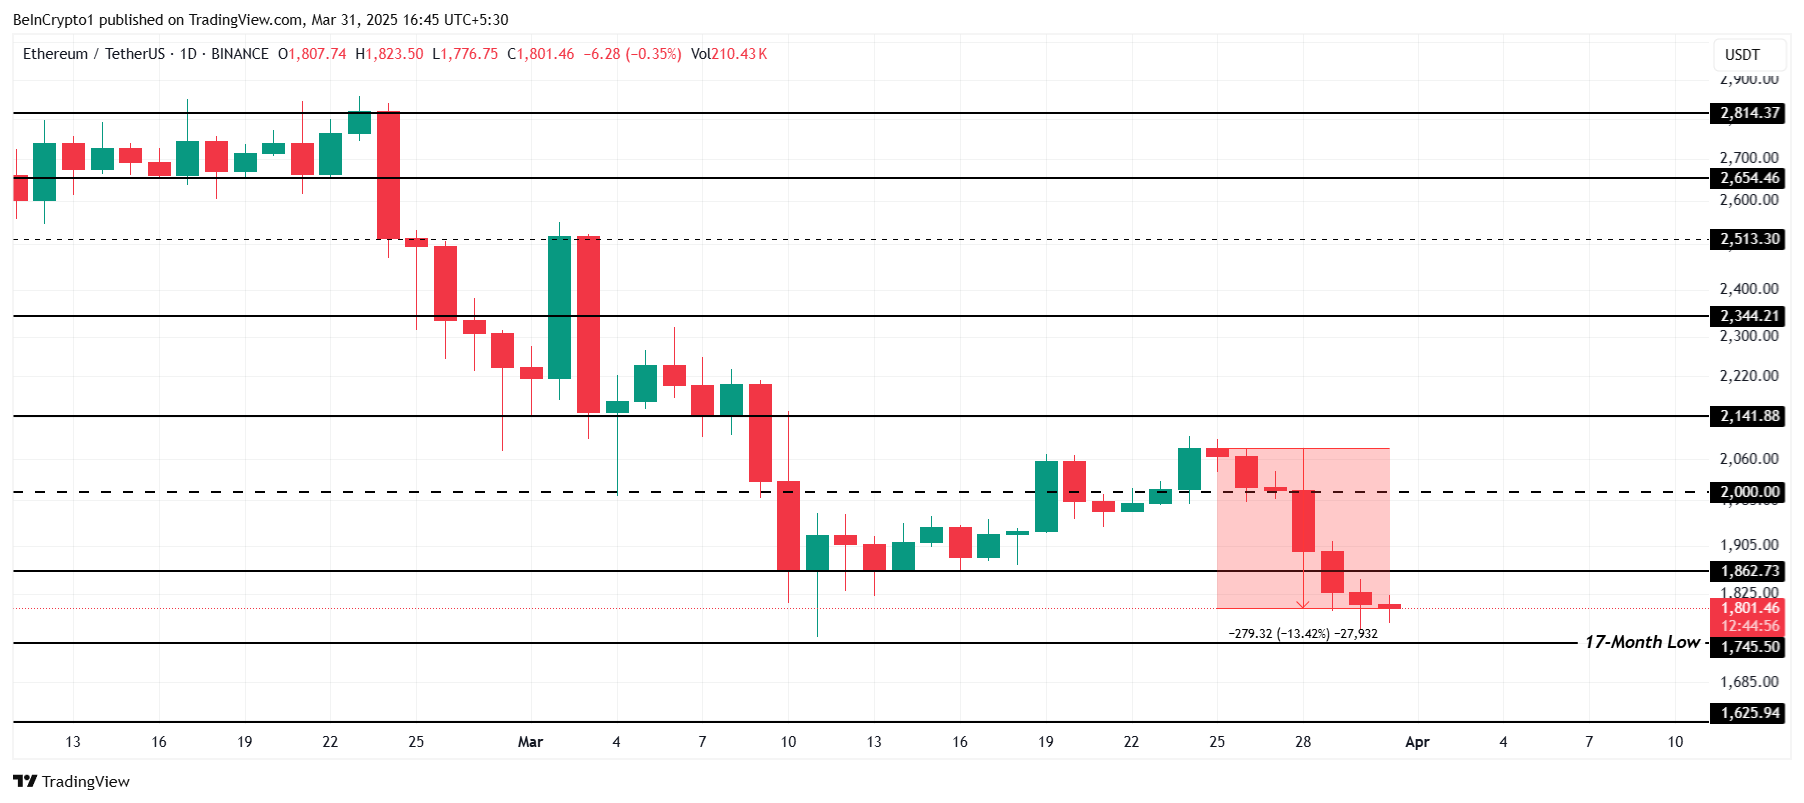
If bearish conditions continue, Ethereum’s price might fall below $1,745, testing the next support at $1,625. A failure to hold this level would invalidate the bullish outlook and open the door for further declines, extending the recent losses.
Disclaimer
In line with the Trust Project guidelines, this price analysis article is for informational purposes only and should not be considered financial or investment advice. BeInCrypto is committed to accurate, unbiased reporting, but market conditions are subject to change without notice. Always conduct your own research and consult with a professional before making any financial decisions. Please note that our Terms and Conditions, Privacy Policy, and Disclaimers have been updated.

As traders and investors anticipate the beginning of April and the onset of the second quarter (Q2) of 2025, crypto airdrops present an opportunity to join promising communities while they are still on the ground floor.
This week, three notable crypto airdrops stand out as worth watching.
Walrus
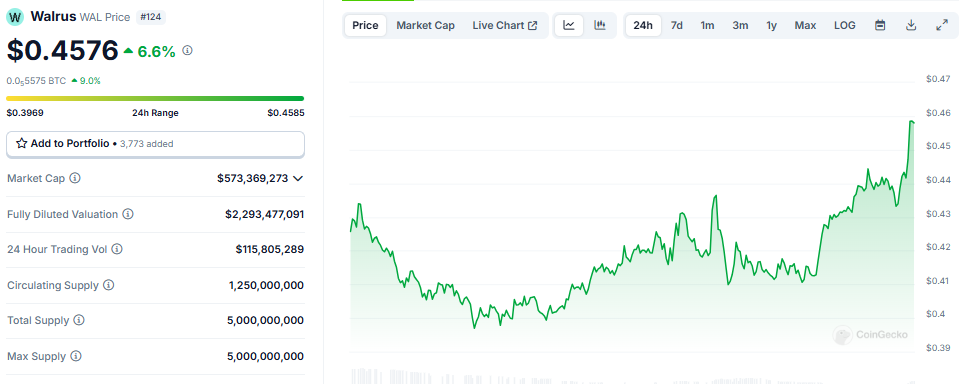
Walrus (WAL), a decentralized storage protocol on the Sui blockchain, launched its mainnet and token generation event (TGE) on March 27. The event coincided with South Korea’s Upbit exchange listing WAL.
The TGE saw Walrus distribute 4% of its 5 billion token supply via an airdrop. Eligible participants, including early Sui ecosystem users and testnet contributors, received Soulbound NFTs redeemable for WAL tokens. As April commences, 6% of Walrus tokens are reserved for future community rewards.
“At the moment 4% of the 10% tokens allocated for the airdrop have been distributed, so Walrus still has tokens to reward users,” Cryptorank.io noted.
WAL powers storage payments, staking, and governance, with listings on exchanges like Crypto.com and MEXC offering prize pools. The project’s airdrop comes after raising $140 million from Andreessen Horowitz, Standard Crypto, Electric Capital, and Comma3 Ventures, among others.
Meanwhile, Walrus’s market cap exceeds $573 million, reflecting strong adoption potential. Data on CoinGecko shows it was trading for $0.45 as of this writing.
Staking opportunities with validators like Mysten Labs or Nansen enhance rewards, but high commissions (up to 60%) apply. One of Walrus and Sui’s founders recently announced that users could stake WAL tokens to get airdrops. As this could mean airdrops from Walrus and projects from the Sui ecosystem, engaging with Sui dApps and testnets remains key for future allocations.
Nansen
The project has raised up to $88.2 million from investors such as Andreessen Horowitz, Coinbase Ventures, Accel, and Mechanism Capital, among others. Coupled with the fundraiser, Nansen has a valuation of $750 million.
Nansen, a leading blockchain analytics platform, confirmed an airdrop, drawing excitement due to its prominence and past reward patterns. The project launched a staking program and announced a point system in 2025.
“We’re excited to announce that we have acquired Stakewithus (SWU)! SWU is a non-custodial staking service provider with $80m+ staked by 30k+ users & supports 20+ chains You can now analyze data, monitor your portfolio, and stake assets in one place with Nansen,” read the announcement.
Users can stake assets (STRK and TRX), and points are expected to be credited retrospectively. Nansen also mentions the NSG token, so participants will most likely receive an airdrop for points.
Market participants should monitor Nansen’s social channels and partnerships for updates, as airdrops typically reward active users or data contributors.
With no token launched yet, any potential airdrop might tie into a future native token, likely incentivizing early adopters or premium subscribers. Given Nansen’s influence in the crypto space, tracking wallet activity and on-chain data, its airdrop could attract significant attention.
Participants should engage with its tools and stake in supported ecosystems to position themselves for unannounced opportunities.
OG Labs
This modular AI chain combines Layer-1 blockchain with decentralized AI, focusing on scalable Data Availability for AI applications.
The status of OG Labs airdrop stands confirmed, bringing forth an emerging player in the crypto space. This makes it a speculative target for market participants. It boasts up to $325 million in funds raised from investors such as Delphi Ventures, Hack VC, Animoca Brands, and OKX Ventures, among others.
The airdrop is potentially tied to Web3 innovation or NFT ecosystems (given the “OG” moniker). It follows models like Walrus, rewarding early testers or community members.
“There are new activities on the OG test network – we can request test tokens and make swaps,” Cryptorank.io noted.
The OG Labs airdrop requires no investment. Users can engage through OG Labs’ Newton Testnet, which tests-core functionalities like decentralized storage, consensus, and data availability services. Participants must complete at least 20 transactions, stay active for three days, and interact with features like swaps, storage scans, and NFT minting.
“Interact with the OG Labs Testnet and Become Eligible for the Airdrop,” crypto researcher Guatamgg stated.
Additionally, users can boost eligibility by taking Discord roles such as OGurus or OG Role. These activities involve community contributions and verification steps. This airdrop targets active ecosystem participants, aligning with OG Labs’ emphasis on community-driven development.
Disclaimer
In adherence to the Trust Project guidelines, BeInCrypto is committed to unbiased, transparent reporting. This news article aims to provide accurate, timely information. However, readers are advised to verify facts independently and consult with a professional before making any decisions based on this content. Please note that our Terms and Conditions, Privacy Policy, and Disclaimers have been updated.
USDC Issuer Circle Set To File IPO In April, Here’s All

Bitcoin Mining Faces Tariff Challenges as Hashrate Hits New ATH

3 Altcoins to Watch in the First Week of April 2025

BTC Price Rebound Likely as Long-Term Holders Reenter Market

Ethereum To $20K? Investor Says Real-World Adoption Is The Key
$33 Million Inflows Signal Market Bounce

2.52 Million Altcoins Are Ruining Crypto’s Future

Animoca Brands Valuation Tanks 75% In Two Years, Here’s Why

Crypto exchange BingX hacked for $43 million

Are The Big Players Losing Interest?

Hong Kong’s Securities Association Tips Authorities On Crypto Self-Regulation

Coinbase cbBTC Set to go Live on Solana
2.52 Million Altcoins Are Ruining Crypto’s Future
Animoca Brands Valuation Tanks 75% In Two Years, Here’s Why
Crypto exchange BingX hacked for $43 million
Are The Big Players Losing Interest?
Hong Kong’s Securities Association Tips Authorities On Crypto Self-Regulation
Coinbase cbBTC Set to go Live on Solana
-
 Regulation23 hours ago
Japan Set To Classify Cryptocurrencies As Financial Products, Here’s All
-

 Market22 hours ago
Top 3 Made in USA Coins to Watch This Week
-

 Market21 hours ago
Solana (SOL) Price Risks Dip Below $110 as Bears Gain Control
-
 Altcoin16 hours ago
Cardano Price Eyes Massive Pump In May Following Cyclical Patern From 2024
-

 Market12 hours ago
Bitcoin Bears Tighten Grip—Where’s the Next Support?
-

 Market11 hours ago
Ethereum Price Weakens—Can Bulls Prevent a Major Breakdown?