
Market
The Rise of Liquid Staking on Solana: Key Insights
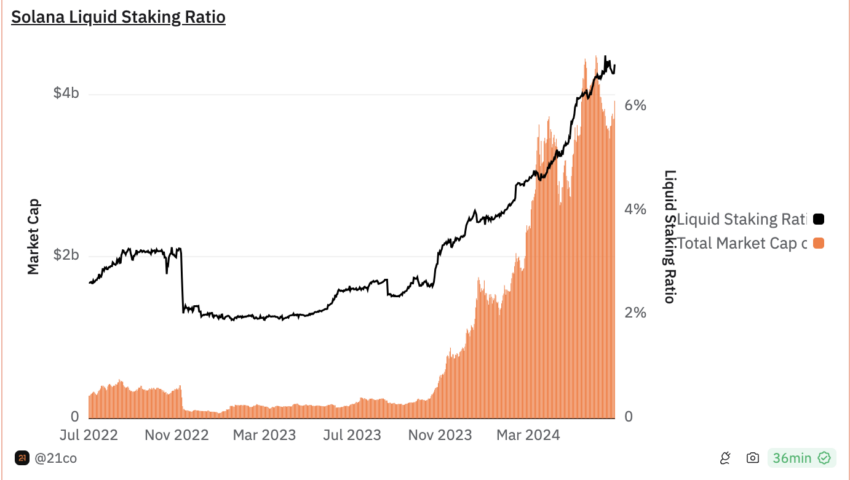
Solana, the fifth-largest crypto asset by market size and the third-largest proof-of-stake (POS) network, saw its liquid staking ratio rise by 1.76% quarter-over-quarter.
According to DefiLlama, over $54 billion worth of crypto assets are staked across liquid staking platforms. Liquid staking, unlike traditional staking, lets users earn extra yield and retain liquidity with a derivative token for DeFi.
The Rise of Liquid Staking on Solana
Data from Dune Analytics shows over 23 million SOL, valued at over $3.6 billion, staked on liquid staking platforms. Solana has a higher staking ratio than Ethereum, around 60%, but only 6% of staked SOL is in liquid staking. This indicates untapped potential in Solana’s liquid staking sector, as well as potential growth opportunities.
Read more: What Is Liquid Staking in Crypto?
Solana’s two-day unbonding period, shorter than many other blockchains, might also impact the popularity of liquid staking. Konstantin Boyko-Romanovsky, founder and CEO of Allnodes, explains how this can be an advantage over other blockchains like Polkadot or Ethereum.
“Since Solana’s unbonding period is only two days, liquid staking might not be as popular as blockchains with unbonding periods of 2-3 weeks. In the context of staking, the unbonding period is when staked assets are unlocked and available for use after a user decides to unstake them,” Boyko-Romanovsky, told BeInCrypto.
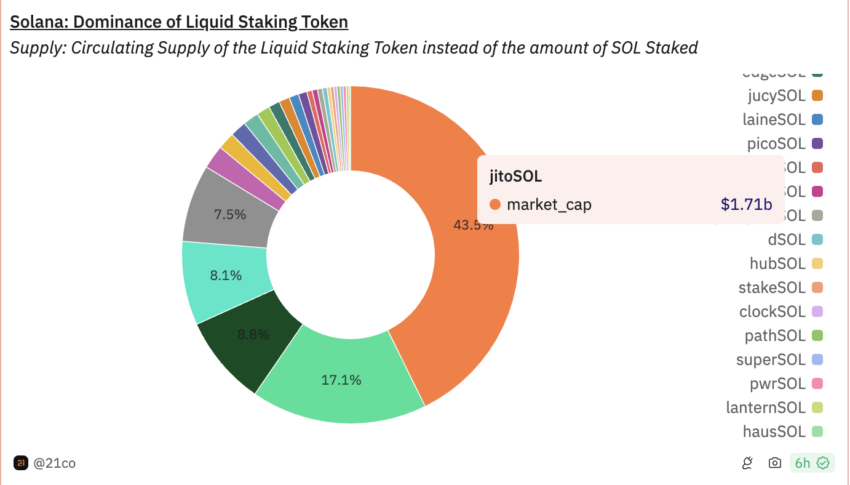
Platforms like Sanctum and Jito Labs are also driving the liquid staking boom on Solana. According to researcher and analyst Tom Wan, Sanctum lowered the barrier of entry and is helping projects build their own liquid staking tokens (LSTs) and scale.
Jito currently has about 91,000 Solana investors staking on the platform, with an APR of over 8% and over 10.6 million SOL staked.
“Sanctum is able to take the torch. The launch of INF, Sanctum Router, and Sanctum Reserve, has lowered the barrier to entry, buklding foundation of a Cambrain explosion of the liquid staking sector on Solana,” Wan shared in a post.
Boyko-Romanosvky also highlights the influence emerging trends like re-staking can have on liquid staking’s growth in Solana.
“Emerging technologies like re-staking can potentially influence the development and adoption of liquid staking on Solana and similar blockchains. By providing continuous liquidity, increasing yield opportunities, and offering greater flexibility, re-staking can enhance the attractiveness of liquid staking even on platforms with short unbonding periods like Solana. However, ensuring the security and reliability of these technologies, alongside effective market and liquidity management, will be crucial for their success and widespread adoption,” Boyko-Romanosvky shared.
Read more: Solana (SOL) Price Prediction 2024/2025/2030
As liquid staking continues to grow in popularity, Solana could benefit from increased user participation and enhanced network security. So far, two major filings for a Solana ETF have been made in the US. If liquid staking popularity continues to grow, it can give Solana a competitive advantage and attract investment firms.
Disclaimer
In adherence to the Trust Project guidelines, BeInCrypto is committed to unbiased, transparent reporting. This news article aims to provide accurate, timely information. However, readers are advised to verify facts independently and consult with a professional before making any decisions based on this content. Please note that our Terms and Conditions, Privacy Policy, and Disclaimers have been updated.


Solana started a fresh increase from the $120 support zone. SOL price is now consolidating and might climb further above the $142 resistance zone.
- SOL price started a fresh increase above the $125 and $132 levels against the US Dollar.
- The price is now trading above $130 and the 100-hourly simple moving average.
- There is a connecting bullish trend line forming with support at $137 on the hourly chart of the SOL/USD pair (data source from Kraken).
- The pair could start a fresh increase if it clears the $142 resistance zone.
Solana Price Gains Over 5%
Solana price formed a base above the $120 support and started a fresh increase, like Bitcoin and Ethereum. SOL gained pace for a move above the $125 and $132 resistance levels.
The pair even spiked toward the $145 resistance zone. A high was formed at $143.06 and the price is now retreating lower. There was a move below the 23.6% Fib retracement level of the upward move from the $135 swing low to the $143 high.
Solana is now trading above $130 and the 100-hourly simple moving average. There is also a connecting bullish trend line forming with support at $137 on the hourly chart of the SOL/USD pair. The trend line is close to the 76.4% Fib retracement level of the upward move from the $135 swing low to the $143 high.

On the upside, the price is facing resistance near the $142 level. The next major resistance is near the $145 level. The main resistance could be $150. A successful close above the $150 resistance zone could set the pace for another steady increase. The next key resistance is $155. Any more gains might send the price toward the $165 level.
Pullback in SOL?
If SOL fails to rise above the $142 resistance, it could start another decline. Initial support on the downside is near the $138.50 zone. The first major support is near the $137 level and the trend line.
A break below the $137 level might send the price toward the $132 zone. If there is a close below the $132 support, the price could decline toward the $125 support in the near term.
Technical Indicators
Hourly MACD – The MACD for SOL/USD is gaining pace in the bullish zone.
Hourly Hours RSI (Relative Strength Index) – The RSI for SOL/USD is above the 50 level.
Major Support Levels – $137 and $132.
Major Resistance Levels – $142 and $145.
Reason to trust
![]()
Strict editorial policy that focuses on accuracy, relevance, and impartiality
Created by industry experts and meticulously reviewed
The highest standards in reporting and publishing
Strict editorial policy that focuses on accuracy, relevance, and impartiality
Morbi pretium leo et nisl aliquam mollis. Quisque arcu lorem, ultricies quis pellentesque nec, ullamcorper eu odio.
Bitcoin price is slowly moving higher above the $86,500 zone. BTC is gaining pace and might continue higher in the near term.
- Bitcoin found support at $84,200 and started a recovery wave.
- The price is trading above $85,500 and the 100 hourly Simple moving average.
- There was a break above a connecting bearish trend line with resistance at $85,000 on the hourly chart of the BTC/USD pair (data feed from Kraken).
- The pair could start another increase if it clears the $88,000 zone.
Bitcoin Price Eyes Steady Increase
Bitcoin price remained stable above the $83,200 level and started a fresh increase. BTC was able to climb above the $84,200 and $85,000 resistance levels.
There was a break above a connecting bearish trend line with resistance at $85,000 on the hourly chart of the BTC/USD pair. The bulls were able to pump the price above the $86,500 resistance. It even spiked above $87,000. A high is formed near $87,562 and the price might continue to rise unless there is a move below the 23.6% Fib retracement level of the upward move from the $84,007 swing low to the $87,562 high.
Bitcoin price is now trading above $86,500 and the 100 hourly Simple moving average. On the upside, immediate resistance is near the $87,500 level. The first key resistance is near the $88,000 level.

The next key resistance could be $88,800. A close above the $88,800 resistance might send the price further higher. In the stated case, the price could rise and test the $89,500 resistance level. Any more gains might send the price toward the $90,000 level.
Downside Correction In BTC?
If Bitcoin fails to rise above the $88,000 resistance zone, it could start a downside correction. Immediate support on the downside is near the $87,000 level. The first major support is near the $86,750 level.
The next support is now near the $86,000 zone. Any more losses might send the price toward the $85,750 support or the 50% Fib retracement level of the upward move from the $84,007 swing low to the $87,562 high in the near term. The main support sits at $84,850.
Technical indicators:
Hourly MACD – The MACD is now gaining pace in the bullish zone.
Hourly RSI (Relative Strength Index) – The RSI for BTC/USD is now above the 50 level.
Major Support Levels – $86,750, followed by $86,000.
Major Resistance Levels – $87,500 and $88,000.

XRP is down 5% over the past week, struggling to regain momentum as technical indicators flash mixed signals. Its Relative Strength Index (RSI) has dropped below 50, and the price remains stuck within a tight range between key support and resistance levels.
At the same time, the Ichimoku Cloud has shifted from green to red, with a thickening cloud ahead suggesting growing bearish pressure. With volatility compressing and momentum fading, XRP is nearing a critical point where a breakout—or breakdown—seems increasingly likely.
XRP Struggles to Regain Momentum as RSI Drops Below 50
XRP’s Relative Strength Index (RSI) is currently sitting at 44.54, after recovering from an intraday low of 40.67. Just yesterday, it was at 51.30, highlighting increased short-term volatility.
RSI is a momentum indicator that measures the speed and magnitude of recent price changes to evaluate overbought or oversold conditions.
Readings above 70 typically suggest an asset is overbought, while readings below 30 indicate it may be oversold.

With XRP’s RSI at 44.54, it’s currently in neutral territory, showing neither strong buying nor selling pressure.
However, the fact that it hasn’t crossed the overbought threshold of 70 since March 19—over a month ago—signals a lack of sustained bullish momentum. This could mean XRP is still in a consolidation phase, with the market waiting for a clearer direction.
If RSI continues to climb toward 50 and beyond, it may hint at building momentum, but without a breakout above 70, upside could remain limited.
XRP Faces Uncertainty as Bearish Trend Begins to Expand
XRP is currently trading inside the Ichimoku Cloud, signaling market indecision and a neutral trend.
The Tenkan-sen (blue line) has crossed below the Kijun-sen (red line), which is a bearish signal, but with the price still within the cloud, it lacks full confirmation.
The cloud itself acts as a zone of support and resistance, and XRP is now moving sideways within that zone.
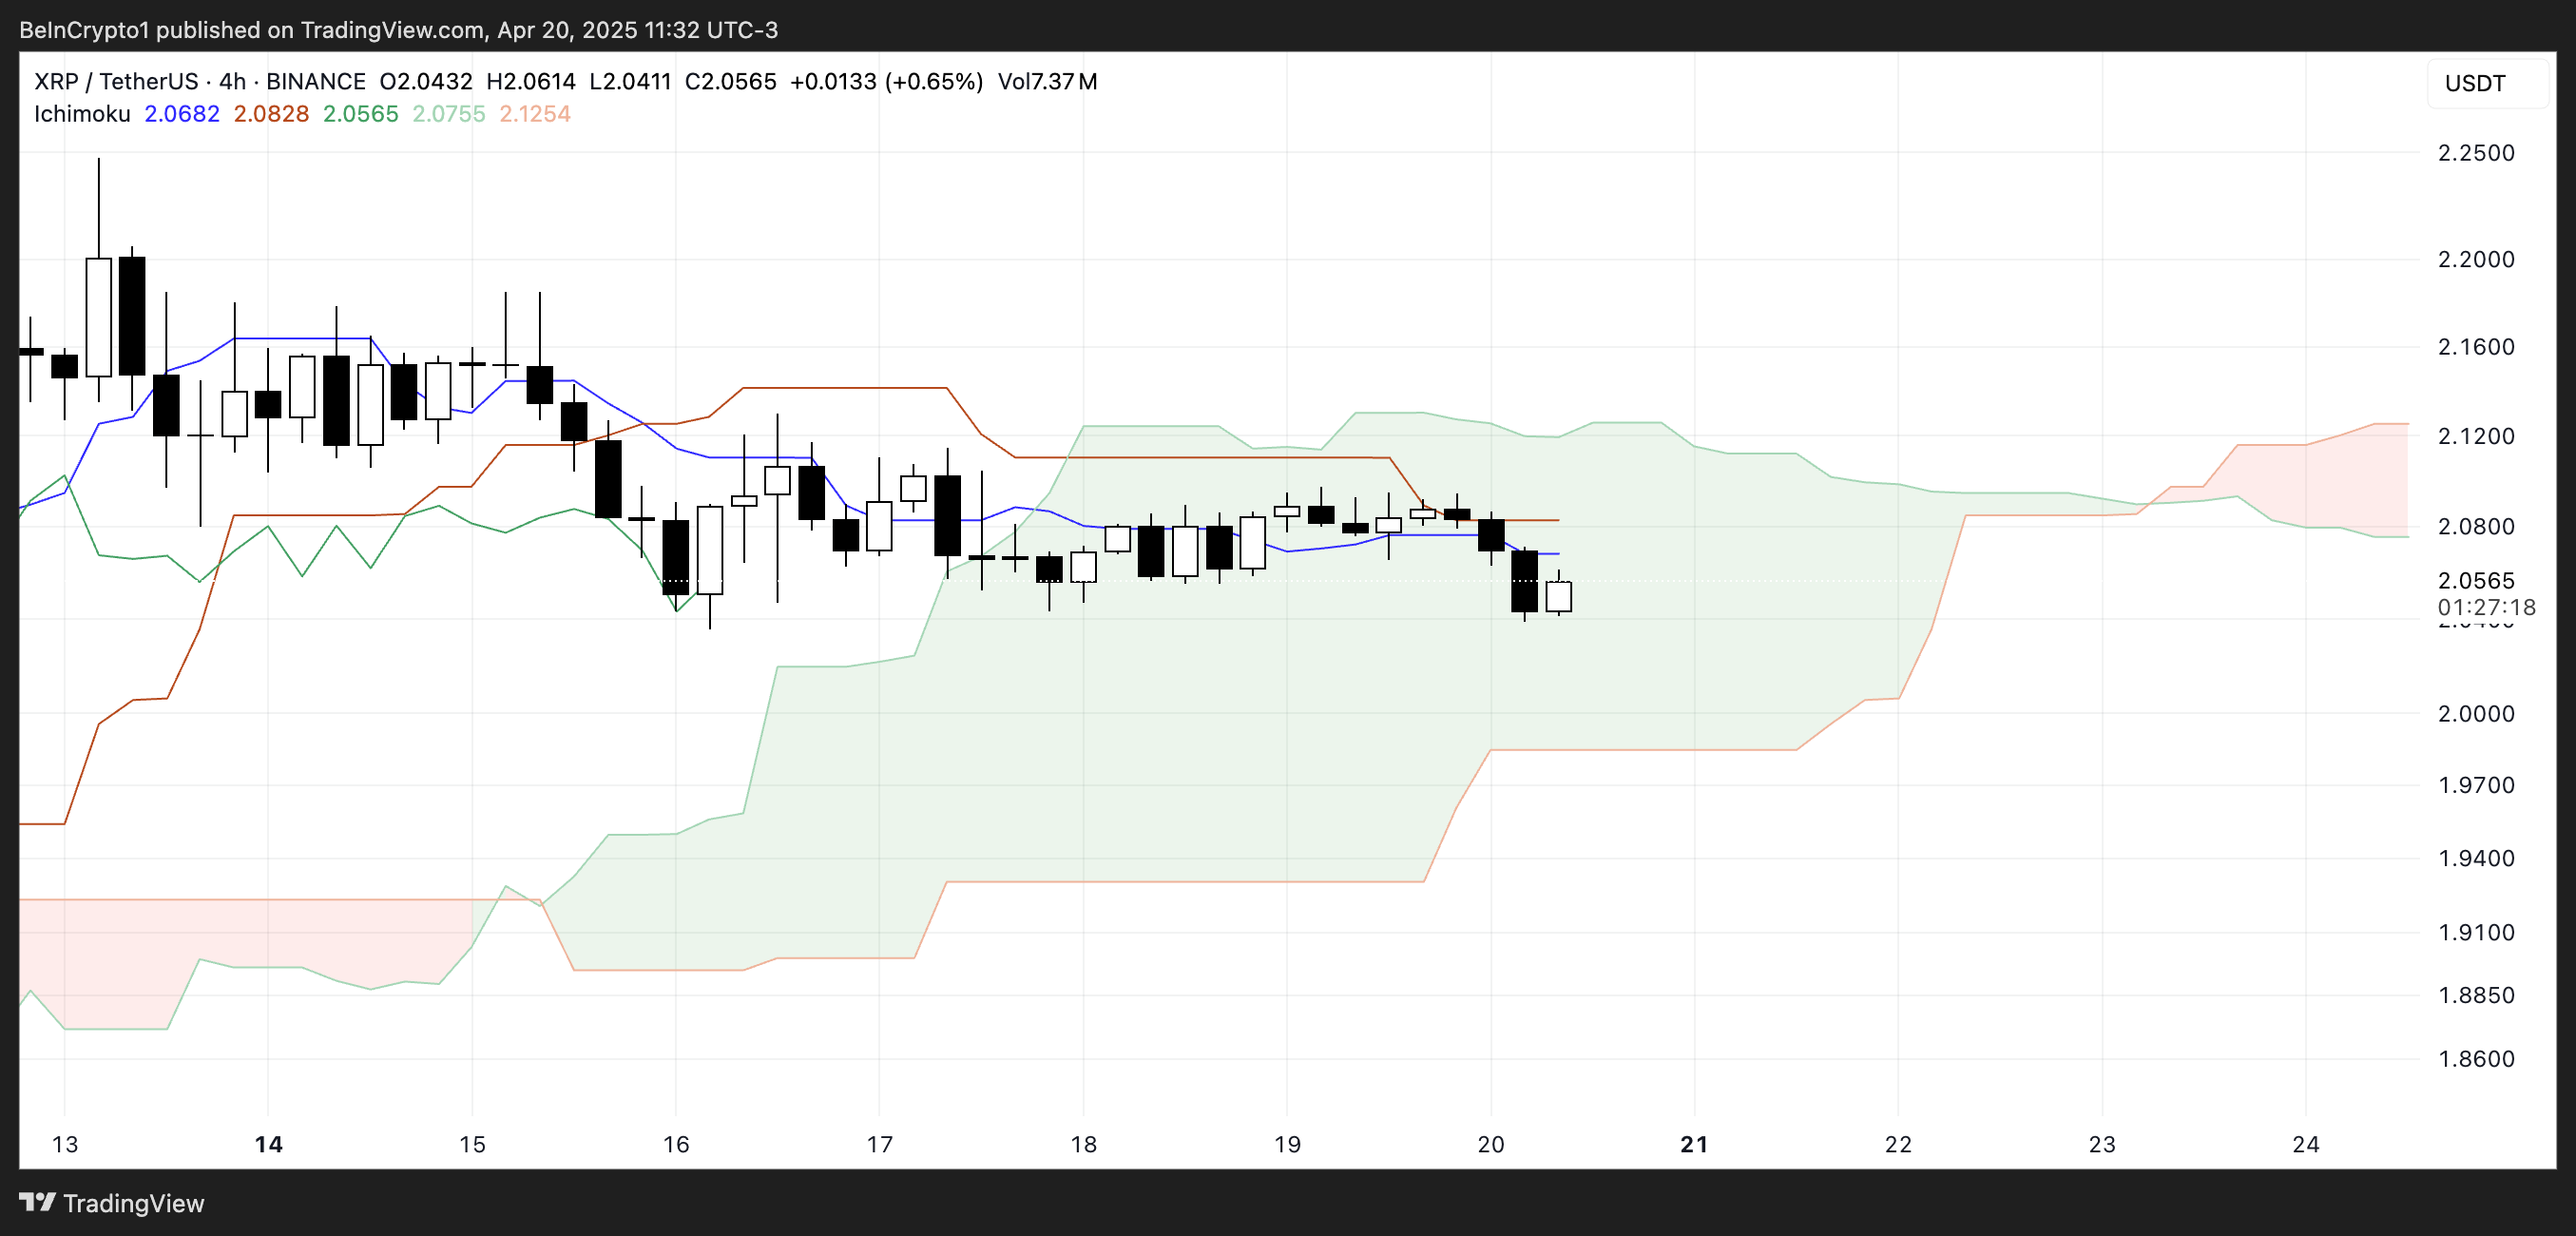
Looking ahead, the cloud has shifted from green to red—a sign that bearish momentum may be building. Even more concerning is that the red cloud is widening, which suggests increasing downward pressure in the near future.
A thickening red Kumo often signals stronger resistance overhead and a potential continuation of a bearish trend if the price breaks below the cloud.
Until XRP breaks out decisively in either direction, the market remains in a wait-and-see phase, but the growing red cloud tilts the bias toward caution.
XRP Compression Zone: A Breakout Could Send Price to $2.50 — Or Much Lower
XRP price is currently trading within a tight range, caught between a key support level at $2.05 and resistance at $2.09. This narrow channel reflects short-term uncertainty, but a decisive move in either direction could set the tone for what’s next.
If the $2.05 support fails, the next level to watch is $1.96. A break below that could trigger a steep drop toward $1.61, which would mark the first close below $1.70 since November 2024—a bearish signal that could accelerate selling pressure.
Recently, veteran analyst Peter Brandt warned that a major correction could hit XRP soon.

On the flip side, if bulls regain control and push XRP above the $2.09 resistance, the next target lies at $2.17. A breakout beyond that could open the door to a move toward $2.50, a price level not seen since March 19.
For that to happen, XRP would need a clear resurgence in momentum and buying volume.
Until then, the price remains trapped in a narrow zone, with both upside and downside potential on the table.
Disclaimer
In line with the Trust Project guidelines, this price analysis article is for informational purposes only and should not be considered financial or investment advice. BeInCrypto is committed to accurate, unbiased reporting, but market conditions are subject to change without notice. Always conduct your own research and consult with a professional before making any financial decisions. Please note that our Terms and Conditions, Privacy Policy, and Disclaimers have been updated.
US Economic Indicators to Watch & Potential Impact on Bitcoin

Solana Rallies Past Bitcoin—Momentum Tilts In Favor of SOL

Expert Says Solana Price To $2,000 Is Within Reach, Here’s How

Bitcoin Price Breakout In Progress—Momentum Builds Above Resistance

Here Are The Bitcoin Levels To Watch For The Short Term

Bitcoin LTH Selling Pressure Hits Yearly Low — Bull Market Ready For Take Off?

2.52 Million Altcoins Are Ruining Crypto’s Future

Animoca Brands Valuation Tanks 75% In Two Years, Here’s Why

Crypto exchange BingX hacked for $43 million

Are The Big Players Losing Interest?

Hong Kong’s Securities Association Tips Authorities On Crypto Self-Regulation

Coinbase cbBTC Set to go Live on Solana
2.52 Million Altcoins Are Ruining Crypto’s Future
Animoca Brands Valuation Tanks 75% In Two Years, Here’s Why
Crypto exchange BingX hacked for $43 million
Are The Big Players Losing Interest?
Hong Kong’s Securities Association Tips Authorities On Crypto Self-Regulation
Coinbase cbBTC Set to go Live on Solana
-

 Ethereum21 hours ago
Ethereum Consolidates In Symmetrical Triangle: Expert Predicts 17% Price Move
-
 Market14 hours ago
1 Year After Bitcoin Halving: What’s Different This Time?
-

 Market20 hours ago
Today’s $1K XRP Bag May Become Tomorrow’s Jackpot, Crypto Founder Says
-
 Altcoin23 hours ago
What’s Up With BTC, XRP, ETH?
-

 Market18 hours ago
MELANIA Crashes to All-Time Low Amid Insiders Continued Sales
-

 Ethereum23 hours ago
Ethereum Accumulators At A Crucial Moment: ETH Realized Price Tests Make-Or-Break Point
-

 Market19 hours ago
Charles Schwab Plans Spot Crypto Trading Rollout in 2026
-

 Market16 hours ago
How Token Launch Frenzy Is Delaying 2025 Altcoin Season