
Market
The Cryptos That Reached All-Time Highs Today

The cryptocurrency market has experienced a significant downturn over the past 24 hours, shedding a staggering $8 billion from its total market capitalization. Despite this broader market correction, some altcoins have defied the trend and surged to new all-time highs (ATHs) today.
BeInCrypto has analyzed three of these tokens that reached new all-time highs today, led by Just a Chill Guy (CHILLGUY)
Just a Chill Guy (CHILLGUY)
Based on a popular internet character, the meme coin Just a Chill Guy (CHILLGUY) has seen a massive surge in value since it launched on November 15. The altcoin climbed to a new all-time high of $0.58 during Tuesday’s early Asian session. However, it currently trades at $0.47, an 18% drop from the price peak.
In a November 25 post on X, on-chain analytics data provider Nansen noted that the meme coin saw $108,450 smart money netflows in the preceding 24 hours. Smart money refers to institutional or large-scale investors. This indicates that large-scale hodlers are increasing their CHILLGUY holdings.
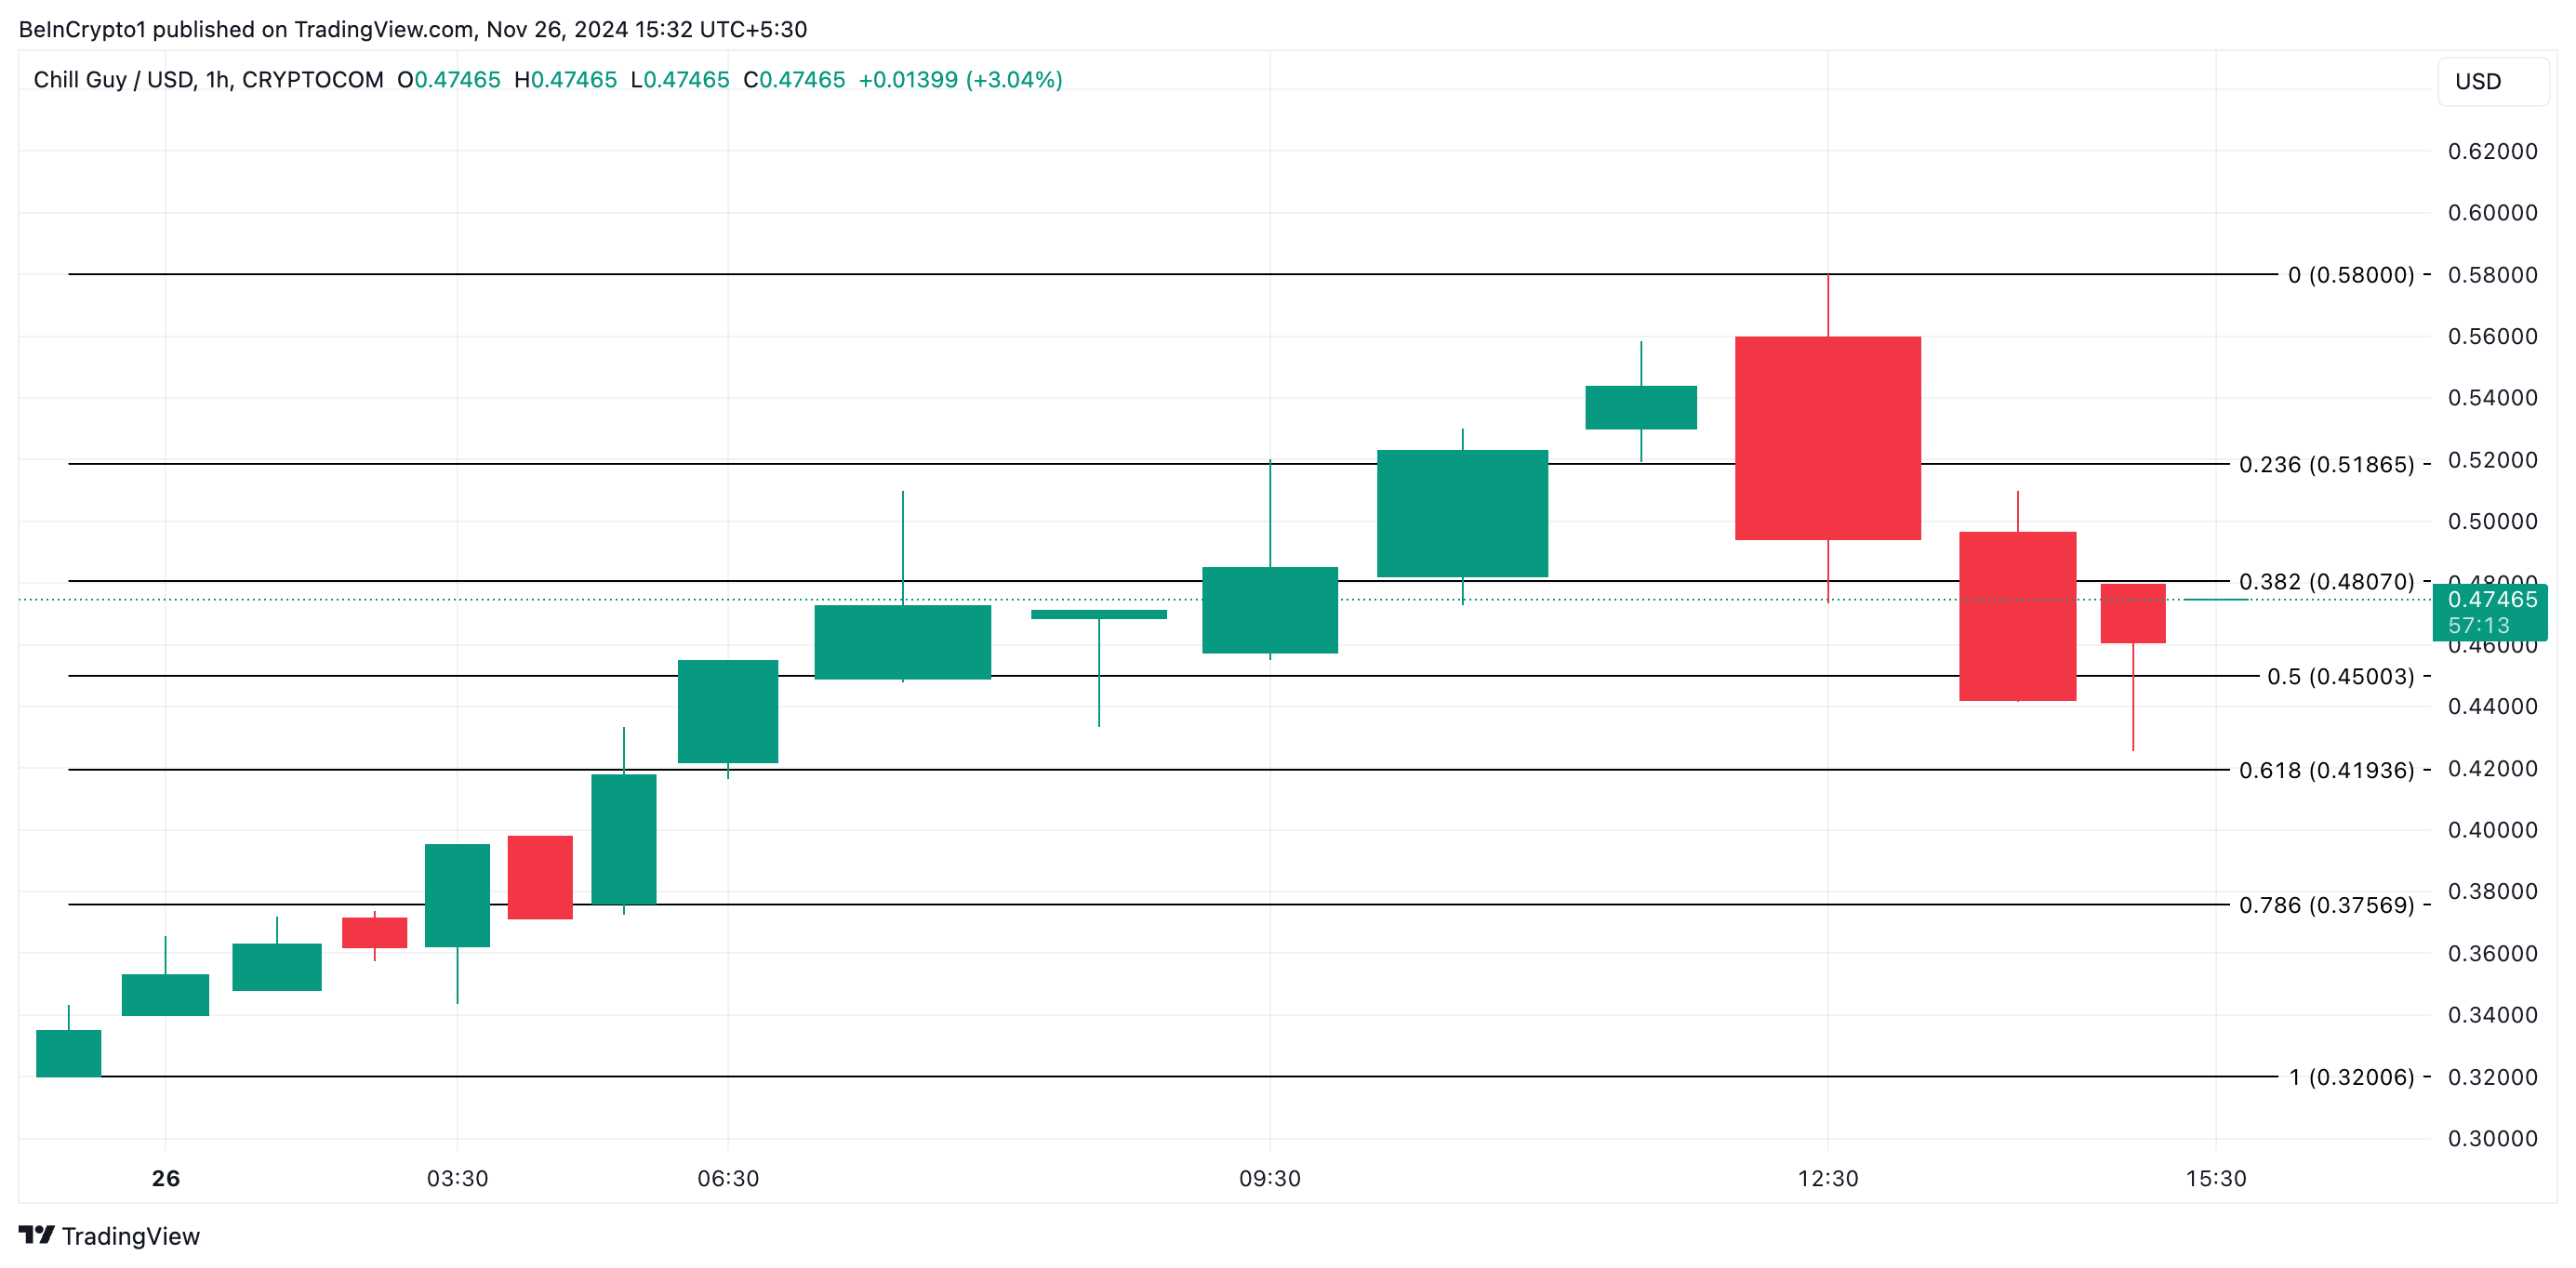
If this trend persists, the meme coin’s price may reclaim its all-time high. On the other hand, CHILLGUY’s price may plummet below $0.40 if selling activity resurfaces.
Virtuals Protocol (VIRTUAL)
VIRTUAL, the native token of the decentralized platform for the creation and monetization of AI agents Virtuals Protocol, rose to an all-time high of $0.71 today. It now trades at $0.65, having shed 8% of its value from this price high.
VIRTUAL’s price surge is backed by an actual demand for the altcoin, reflected in its rising Rising Strength Index (RSI). At press time, this is at 69.48.
The RSI indicator tracks an asset’s overbought and oversold market conditions. It ranges between 0 and 100, with values above 70 indicating that the asset is overbought and due for a correction. On the other hand, values below 30 indicate oversold conditions and hint at a price rebound.
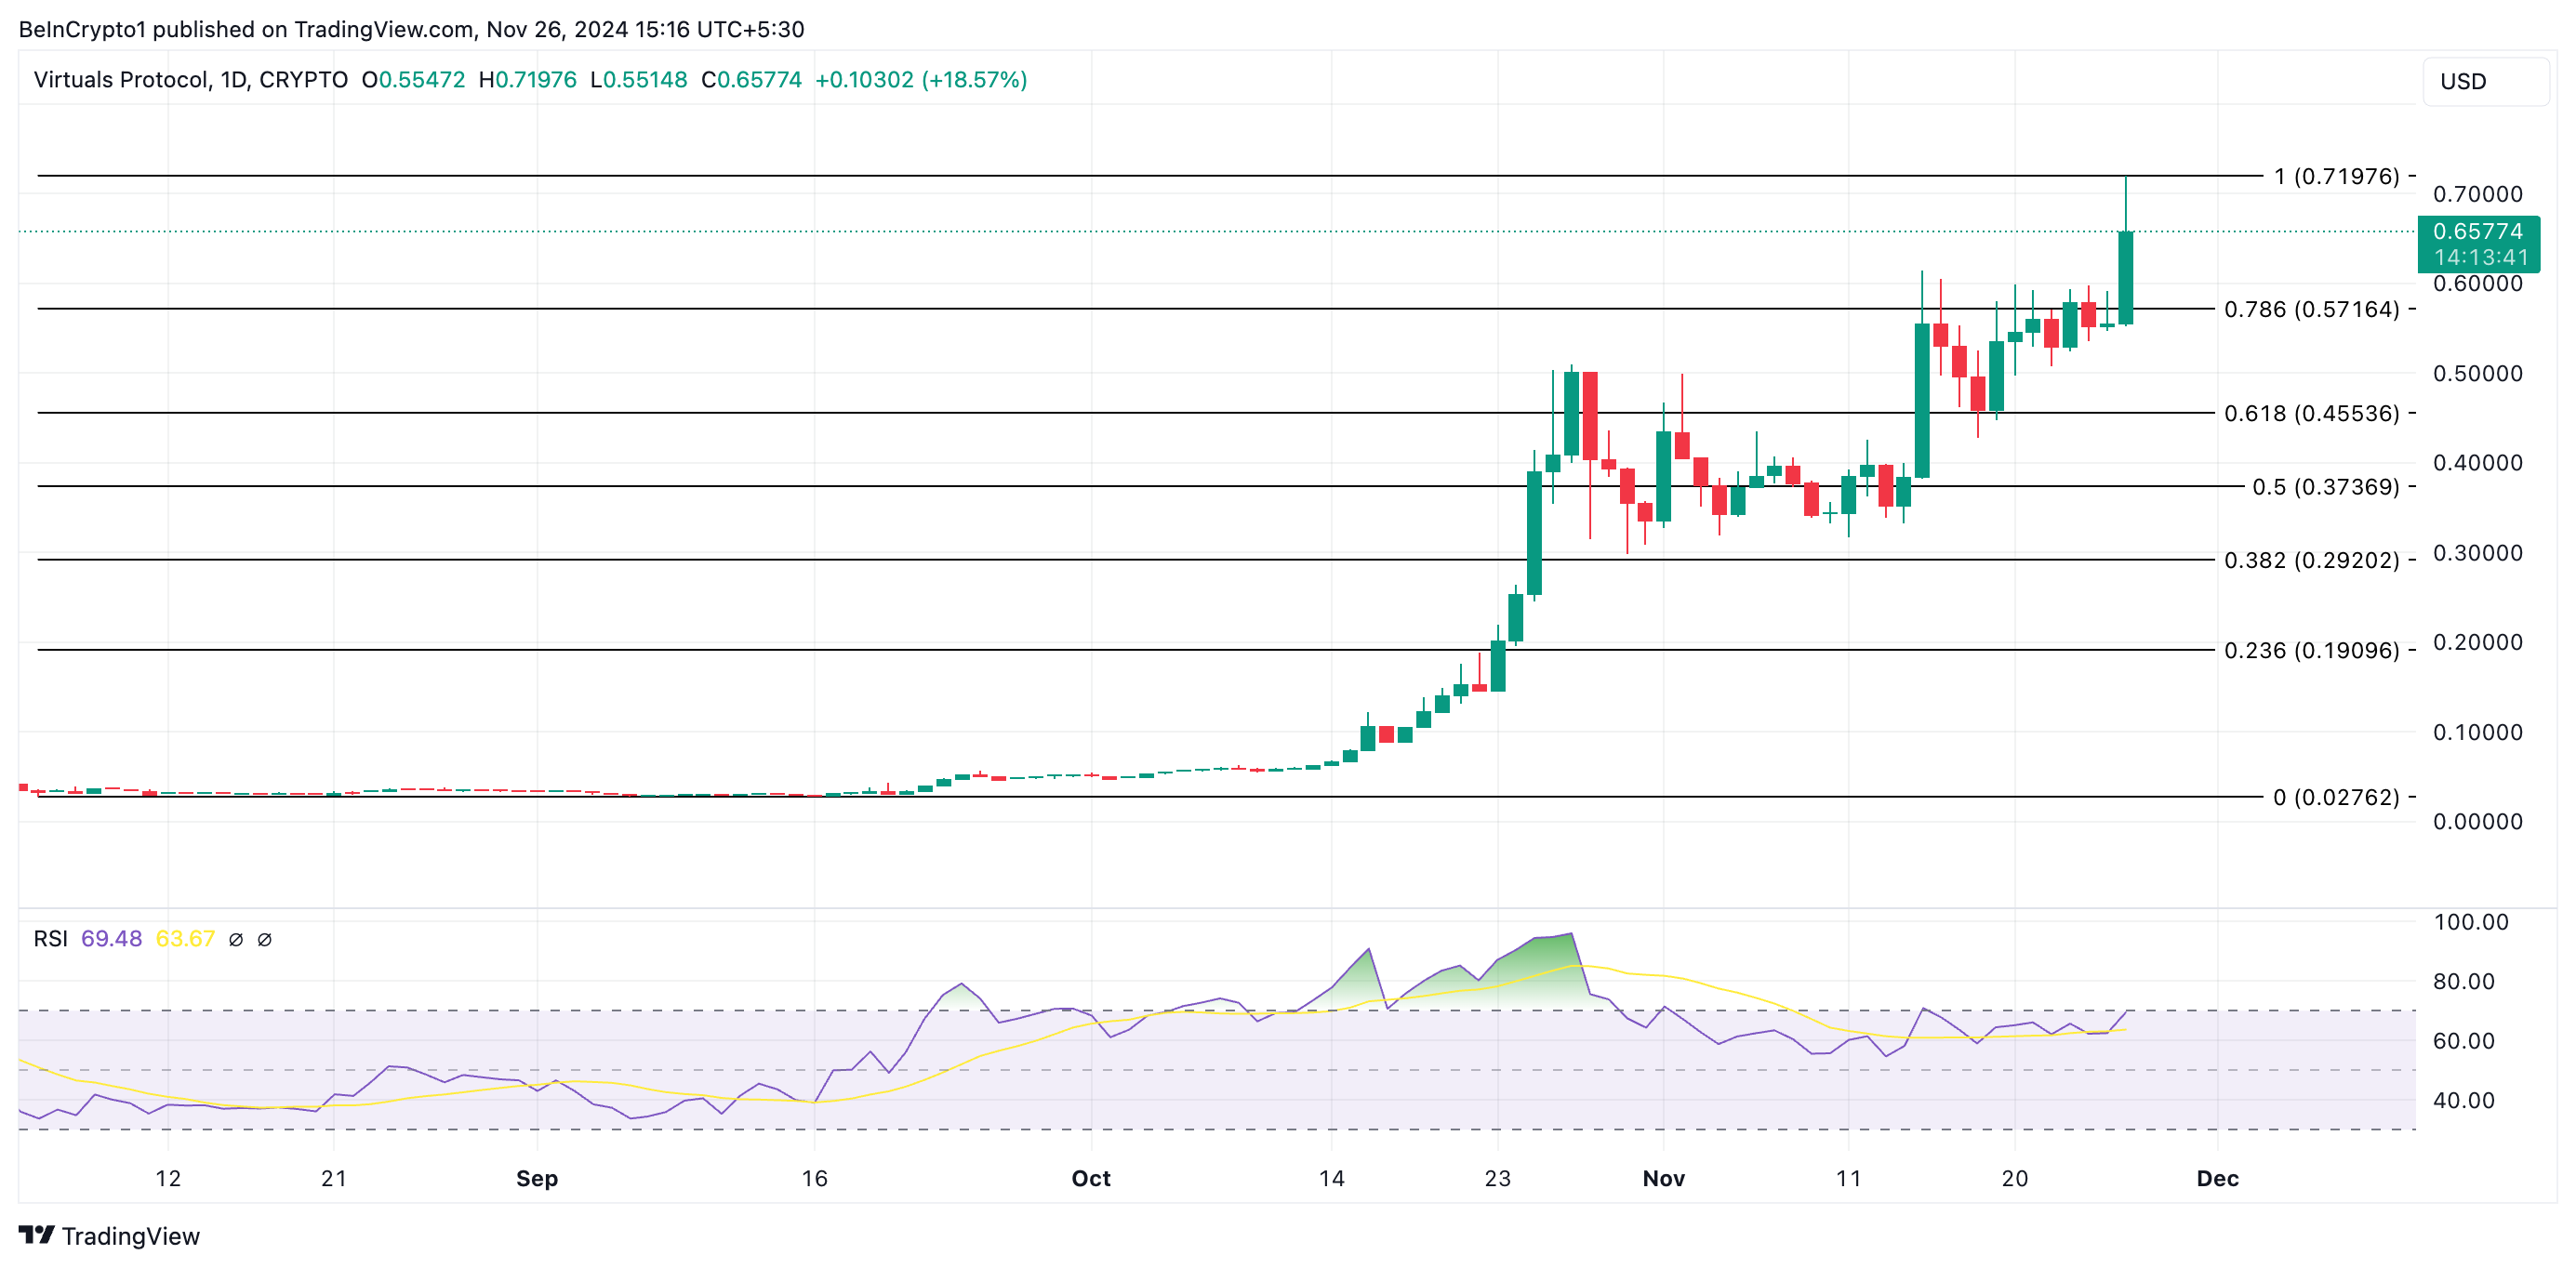
At 69.48, VIRTUAL’s RSI indicates that buying activity outweighs selling pressure among market participants. If this trend continues, the altcoin will reclaim its all-time high of $0.71 and attempt to rally beyond it. However, if profit-taking commences, VIRTUAL’s price may drop to $0.57, invalidating this bullish outlook.
aixbt by Virtuals (AIXBT)
AIXBT is currently trading at $0.08. It has recorded a 75% intra-day increase and has hit an all-time high of $0.09 today. Over the past 24 hours, its trading volume has totaled $6.05 million, rocketing by 487%.
When an asset’s price climbs alongside its trading volume, it suggests strong market interest and participation, indicating that the price increase is supported by active buying. This signals confidence in the asset’s value and can suggest that the upward movement may be sustainable.
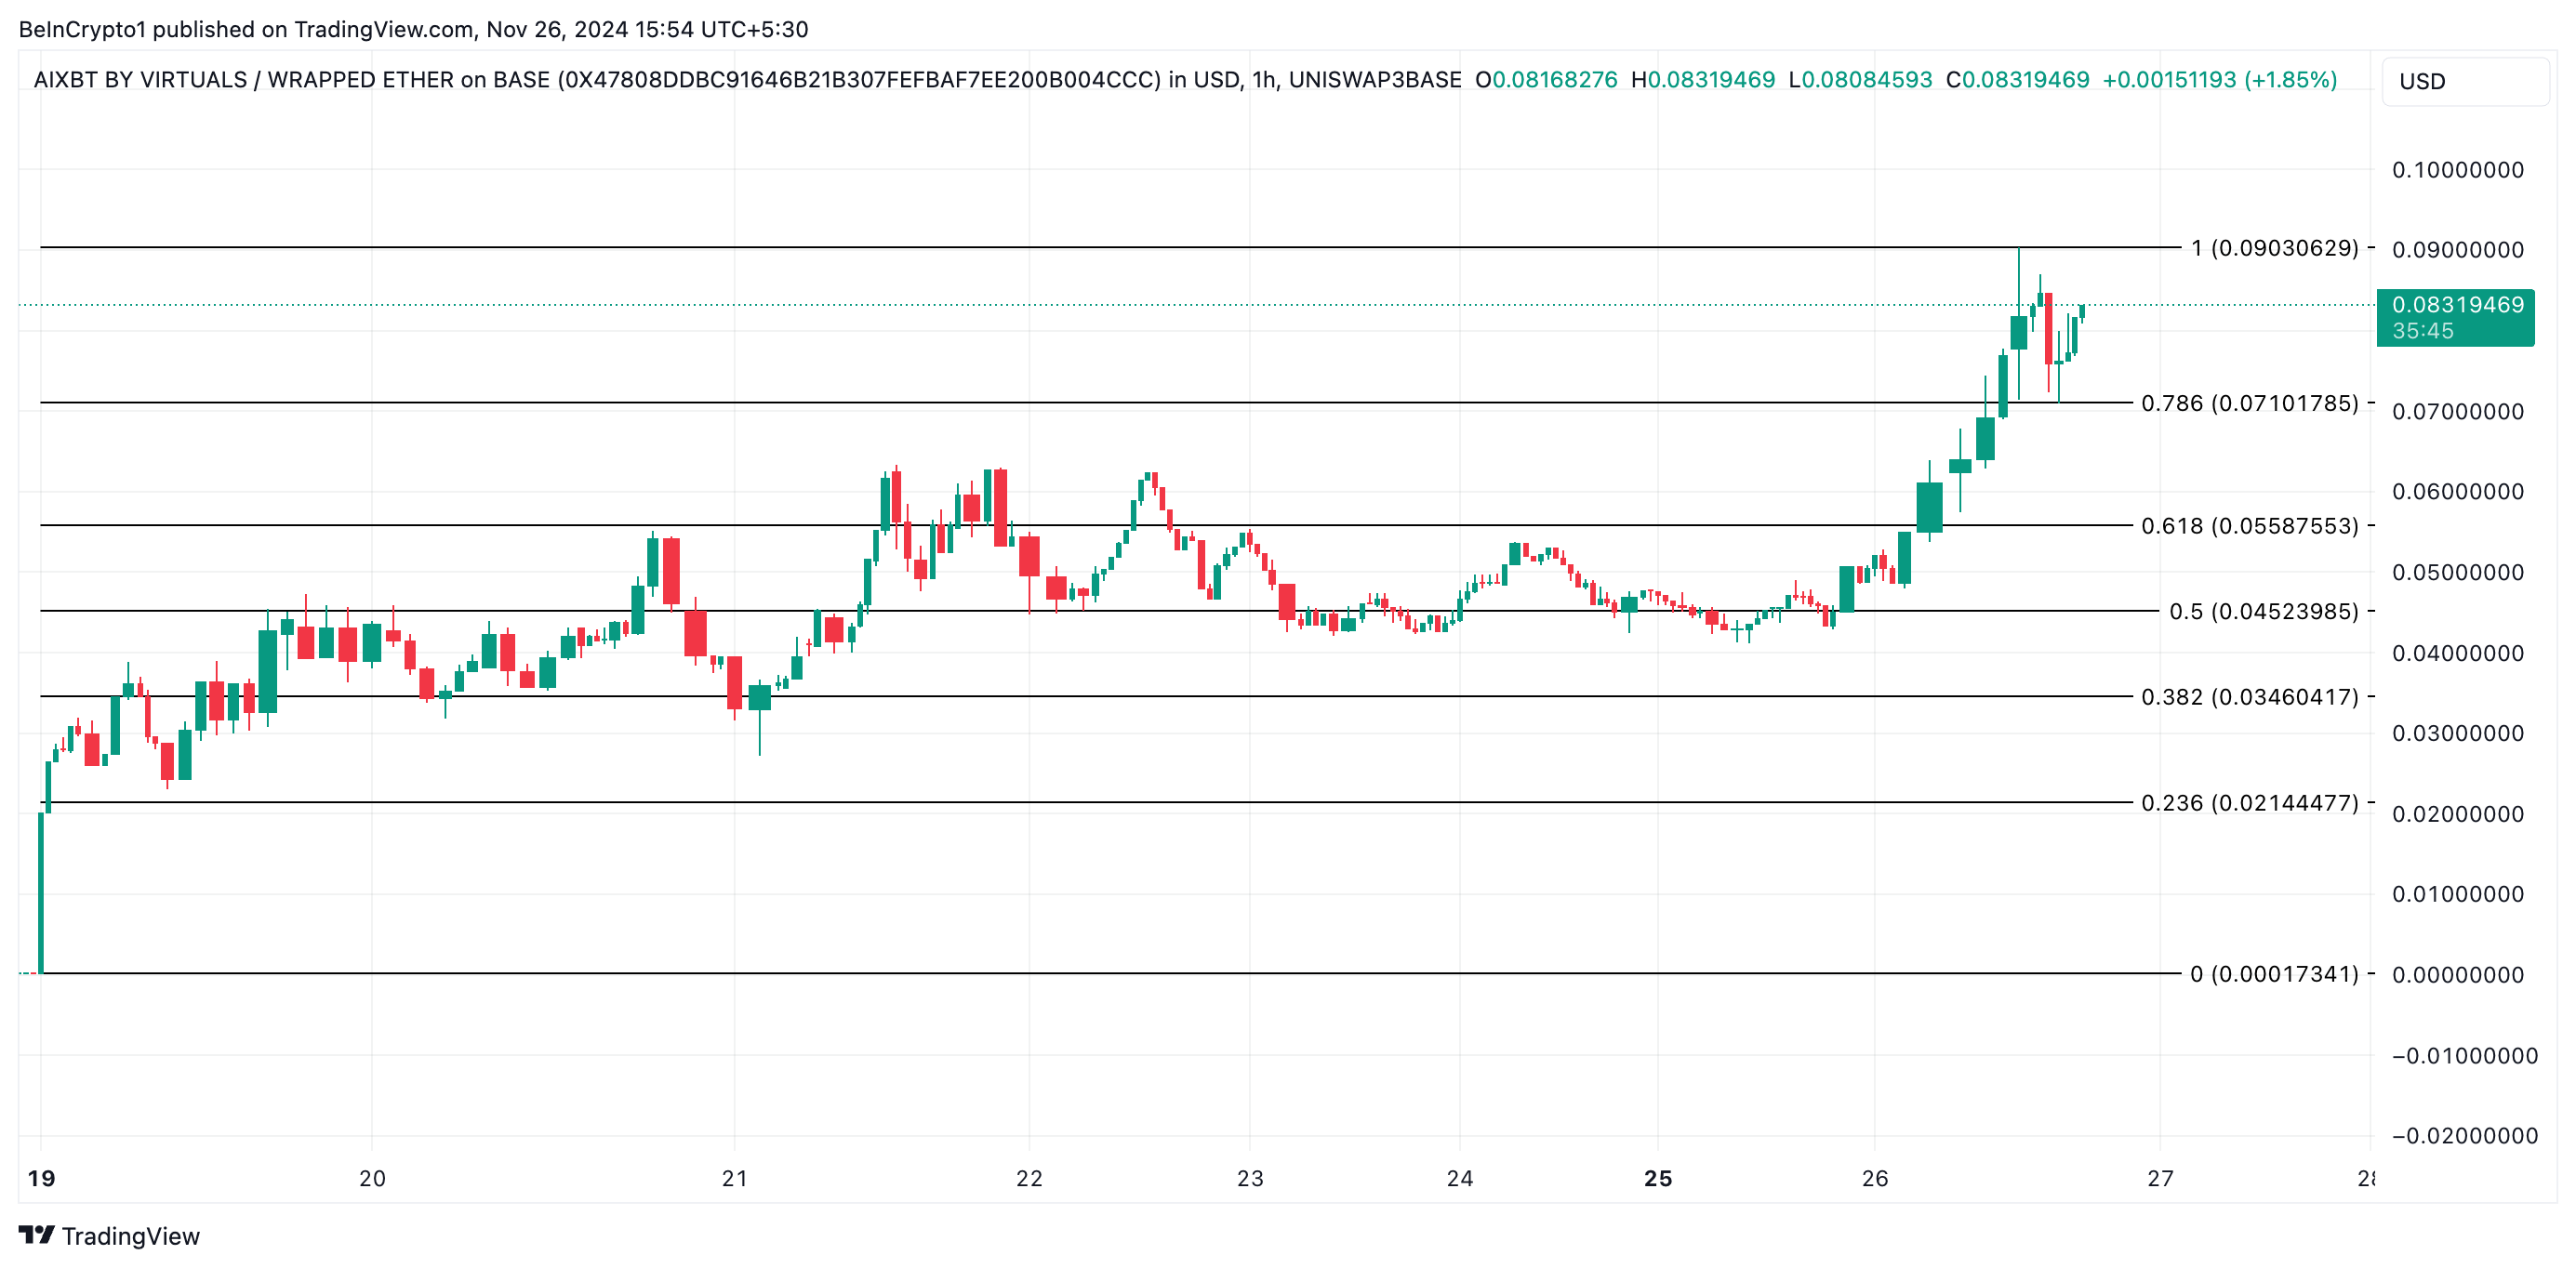
AIXBT will reclaim its all-time high if this bullish momentum holds. However, its value may drop to $0.07 if selling activity commences.
Disclaimer
In line with the Trust Project guidelines, this price analysis article is for informational purposes only and should not be considered financial or investment advice. BeInCrypto is committed to accurate, unbiased reporting, but market conditions are subject to change without notice. Always conduct your own research and consult with a professional before making any financial decisions. Please note that our Terms and Conditions, Privacy Policy, and Disclaimers have been updated.


XRP is down 5% over the past week, struggling to regain momentum as technical indicators flash mixed signals. Its Relative Strength Index (RSI) has dropped below 50, and the price remains stuck within a tight range between key support and resistance levels.
At the same time, the Ichimoku Cloud has shifted from green to red, with a thickening cloud ahead suggesting growing bearish pressure. With volatility compressing and momentum fading, XRP is nearing a critical point where a breakout—or breakdown—seems increasingly likely.
XRP Struggles to Regain Momentum as RSI Drops Below 50
XRP’s Relative Strength Index (RSI) is currently sitting at 44.54, after recovering from an intraday low of 40.67. Just yesterday, it was at 51.30, highlighting increased short-term volatility.
RSI is a momentum indicator that measures the speed and magnitude of recent price changes to evaluate overbought or oversold conditions.
Readings above 70 typically suggest an asset is overbought, while readings below 30 indicate it may be oversold.

With XRP’s RSI at 44.54, it’s currently in neutral territory, showing neither strong buying nor selling pressure.
However, the fact that it hasn’t crossed the overbought threshold of 70 since March 19—over a month ago—signals a lack of sustained bullish momentum. This could mean XRP is still in a consolidation phase, with the market waiting for a clearer direction.
If RSI continues to climb toward 50 and beyond, it may hint at building momentum, but without a breakout above 70, upside could remain limited.
XRP Faces Uncertainty as Bearish Trend Begins to Expand
XRP is currently trading inside the Ichimoku Cloud, signaling market indecision and a neutral trend.
The Tenkan-sen (blue line) has crossed below the Kijun-sen (red line), which is a bearish signal, but with the price still within the cloud, it lacks full confirmation.
The cloud itself acts as a zone of support and resistance, and XRP is now moving sideways within that zone.
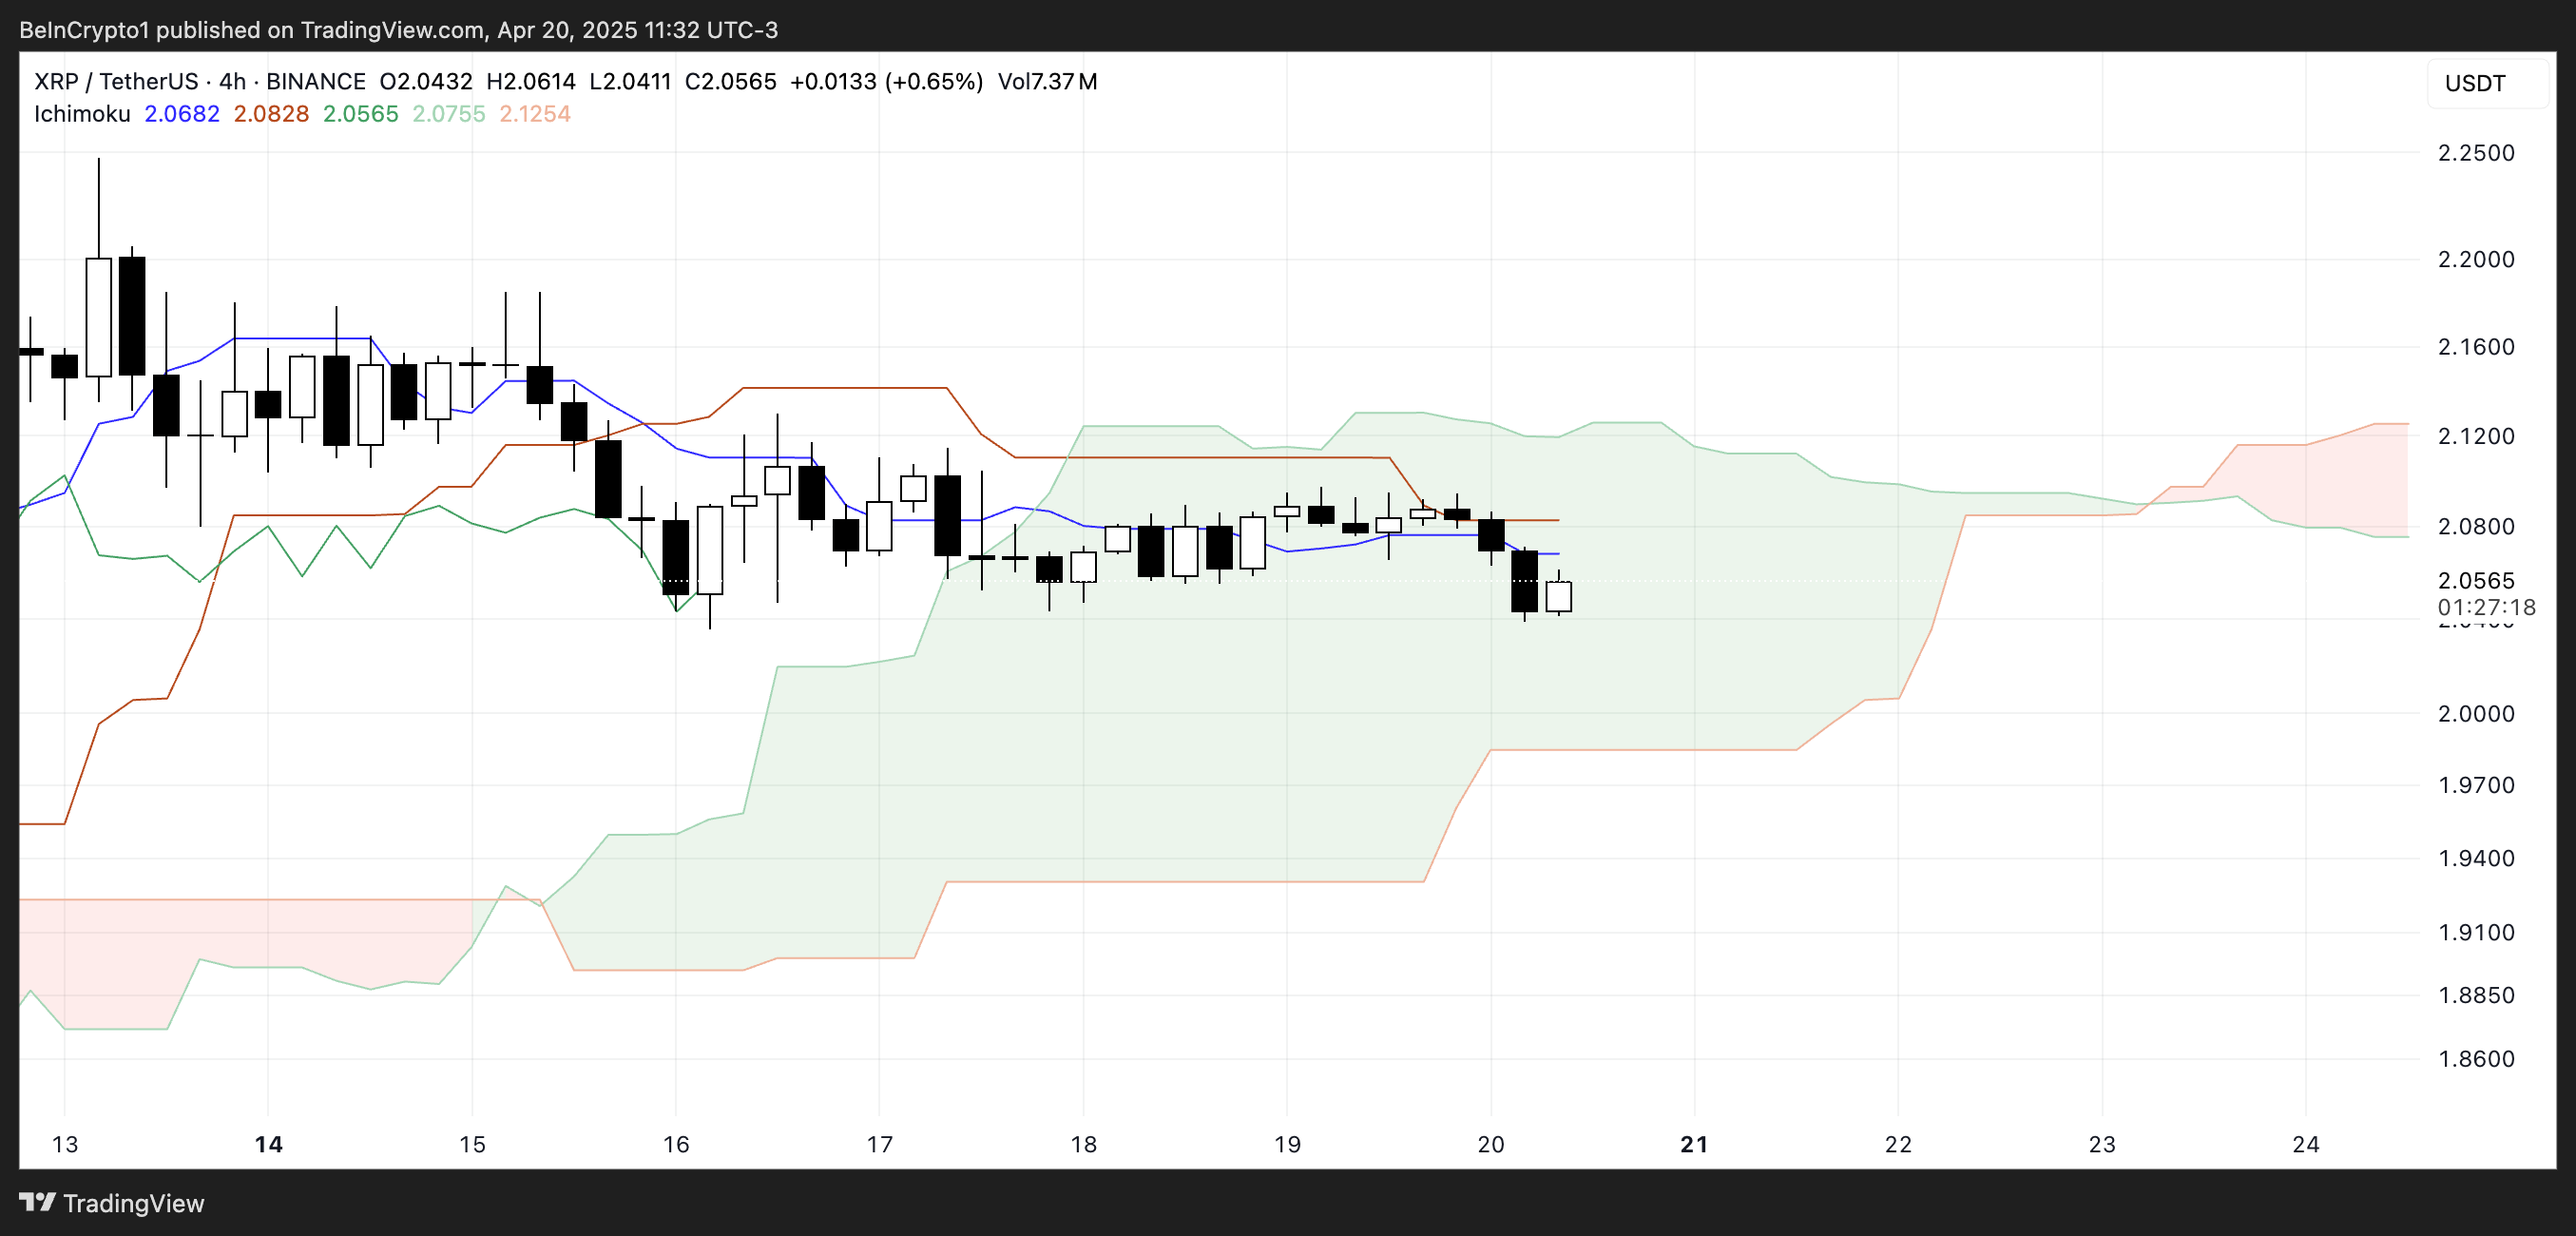
Looking ahead, the cloud has shifted from green to red—a sign that bearish momentum may be building. Even more concerning is that the red cloud is widening, which suggests increasing downward pressure in the near future.
A thickening red Kumo often signals stronger resistance overhead and a potential continuation of a bearish trend if the price breaks below the cloud.
Until XRP breaks out decisively in either direction, the market remains in a wait-and-see phase, but the growing red cloud tilts the bias toward caution.
XRP Compression Zone: A Breakout Could Send Price to $2.50 — Or Much Lower
XRP price is currently trading within a tight range, caught between a key support level at $2.05 and resistance at $2.09. This narrow channel reflects short-term uncertainty, but a decisive move in either direction could set the tone for what’s next.
If the $2.05 support fails, the next level to watch is $1.96. A break below that could trigger a steep drop toward $1.61, which would mark the first close below $1.70 since November 2024—a bearish signal that could accelerate selling pressure.
Recently, veteran analyst Peter Brandt warned that a major correction could hit XRP soon.

On the flip side, if bulls regain control and push XRP above the $2.09 resistance, the next target lies at $2.17. A breakout beyond that could open the door to a move toward $2.50, a price level not seen since March 19.
For that to happen, XRP would need a clear resurgence in momentum and buying volume.
Until then, the price remains trapped in a narrow zone, with both upside and downside potential on the table.
Disclaimer
In line with the Trust Project guidelines, this price analysis article is for informational purposes only and should not be considered financial or investment advice. BeInCrypto is committed to accurate, unbiased reporting, but market conditions are subject to change without notice. Always conduct your own research and consult with a professional before making any financial decisions. Please note that our Terms and Conditions, Privacy Policy, and Disclaimers have been updated.
On April 20, Dogecoin enthusiasts worldwide united to mark Dogeday, a community-driven holiday celebrating the world’s most recognizable meme coin.
While the festivities showcased the coin’s loyal fanbase and cultural relevance, the celebration failed to spark any meaningful market movement.
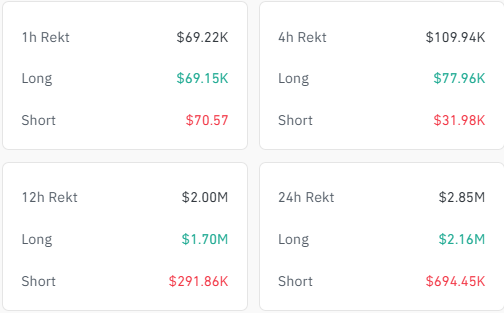
Dogeday Fails to Lift Dogecoin Price as Traders Face $2.8 Million in Liquidations
Instead of riding a wave of positive sentiment, Dogecoin was the worst-performing asset among the top 20 cryptocurrencies during the past day.
According to data from BeInCrypto, the token dropped over 2.5% during the reporting period compared to the muted performance of the general market.
This disappointing performance led to roughly $2.8 million in liquidations, with traders betting on an upward price movement losing more than $2 million, per Coinglass figures.
However, even with the lackluster price action, Dogecoin’s relevance in the crypto ecosystem remains undeniable. Launched in 2013 as a parody of Bitcoin, DOGE has grown far beyond its meme origins.
The digital asset is now the ninth-largest cryptocurrency by market capitalization, currently valued at approximately $22.9 billion, according to CoinMarketCap.
Much of its growth can be attributed to high-profile endorsements. Tesla CEO and presidential advisor Elon Musk has repeatedly voiced support for Dogecoin, as has billionaire entrepreneur Mark Cuban. Their backing helped shift public perception of DOGE from a joke to a legitimate digital asset and payment option.
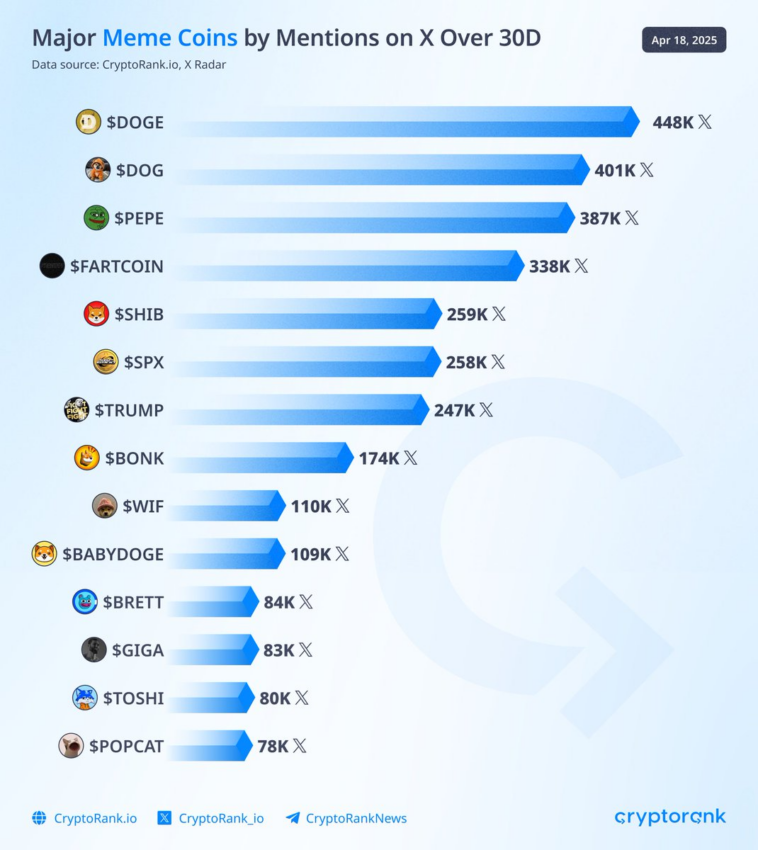
On social media, Dogecoin continues to lead the memecoin narrative. According to CryptoRank, it was the most mentioned memecoin ticker on X (formerly Twitter) in the past month. This visibility continues to fuel both community engagement and investor interest.
Moreover, institutional interest in Dogecoin is also on the rise. Major asset managers, including Bitwise, Grayscale, 21Shares, and Osprey, have submitted filings to the US Securities and Exchange Commission (SEC) seeking to launch spot Dogecoin ETFs.
If granted, these financial investment vehicles could become the first exchange-traded funds centered entirely on a meme coin.
Considering this, crypto bettors on Polymarket put the odds of these products’ approval above 55% this year. This optimism reflects a growing belief that Dogecoin could soon secure a place in mainstream financial markets.
Disclaimer
In adherence to the Trust Project guidelines, BeInCrypto is committed to unbiased, transparent reporting. This news article aims to provide accurate, timely information. However, readers are advised to verify facts independently and consult with a professional before making any decisions based on this content. Please note that our Terms and Conditions, Privacy Policy, and Disclaimers have been updated.

Crypto whales are making bold moves heading into May 2025, and three tokens are standing out: Ethereum (ETH), Artificial Superintelligence Alliance (FET), and Onyxcoin (XCN). All three have seen a noticeable uptick in large-holder accumulation over the last week, signaling growing interest from big players despite recent volatility.
While ETH and XCN are both coming off sharp corrections, whale buying suggests confidence in a potential rebound. Meanwhile, FET is riding renewed momentum in the AI sector, with whale activity accelerating alongside rising prices.
Ethereum (ETH)
The number of Ethereum crypto whales—wallets holding between 1,000 and 10,000 ETH—has been steadily climbing since April 15. Back then, there were 5,432 such addresses.
That number has now risen to 5,460, the highest count since August 2023. At the same time, the concentration of ETH held by these whales is also hitting new highs, signaling growing accumulation by large holders.
While this can be interpreted as confidence in Ethereum’s long-term value, it also raises concerns about centralization and potential selling pressure if whales decide to take profits.

Ethereum price is currently down more than 19% over the last 30 days. If the correction continues, the price could retest support at $1,535. Losing that level might send ETH toward deeper support at $1,412 or even $1,385.
However, if the trend reverses, key resistance zones lie at $1,669 and $1,749—with a potential push toward $1,954 if bullish momentum builds.
In this context, the growing dominance of whales could act as either a stabilizing force or a looming risk, depending on how they respond to market shifts.
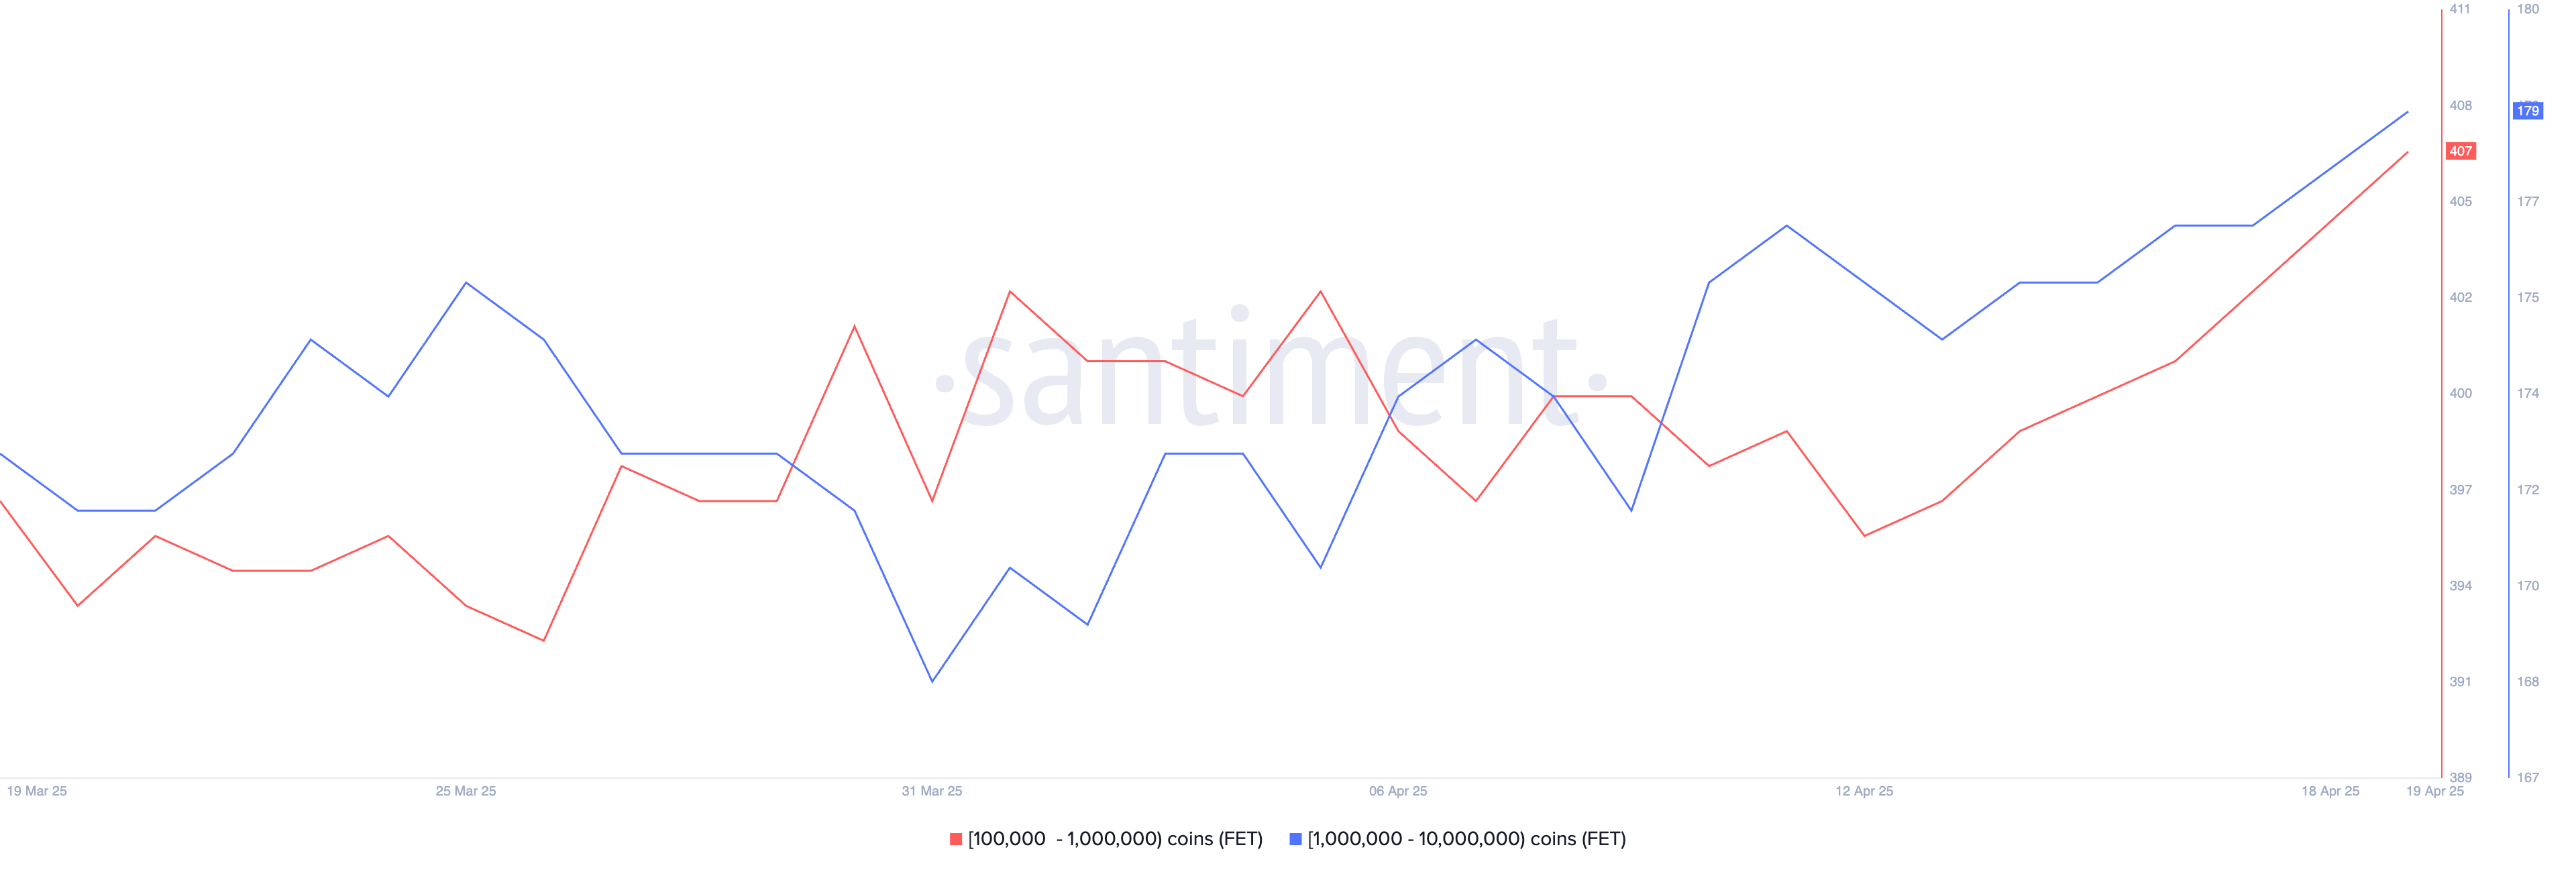
Artificial Superintelligence Alliance (FET)
The number of FET whales—wallets holding between 10,000 and 1,000,000 tokens—increased from 572 on April 13 to 586 by April 19.
This steady growth in large holders points to rising confidence among bigger players. It comes at a time when the broader AI crypto narrative is showing signs of a rebound.
Key AI coins like FET, TAO, and RENDER have all increased over 9% in the last seven days, with FET itself gaining more than 8% in the past 24 hours and 13.5% over the week. This suggests a possible comeback for the artificial intelligence narrative in crypto.
If this momentum continues, FET could push toward resistance at $0.659. A clean breakout from that level could open the door to further gains, with $0.77 and $0.82 as the next potential targets.
On the flip side, if the rally stalls, FET might drop back to test support at $0.54. A breakdown below that could send it as low as $0.44.
With whale activity heating up and the AI sector showing renewed strength, FET’s next move could be a key signal for where the narrative heads next.
Onyxcoin (XCN)
Onyxcoin was one of the standout performers in January, but its momentum has faded in recent months. After a strong bounce—up of over 57% in the last 30 days, the token is now correcting, down 19% in the past seven days.
Despite this pullback, accumulation continues. The number of crypto whales holding between 1 million and 10 million XCN has grown from 528 on April 16 to 541, suggesting some large holders may be buying the dip.

If the correction deepens, XCN could lose support at $0.0165. A drop below that may open the door to further declines toward $0.0139 and $0.0123.
But if the trend flips back upward, the token could first test resistance at $0.020. A strong breakout from there might lead to a move toward $0.027. With whale activity on the rise and volatility returning, XCN’s next move could be decisive.
Disclaimer
In line with the Trust Project guidelines, this price analysis article is for informational purposes only and should not be considered financial or investment advice. BeInCrypto is committed to accurate, unbiased reporting, but market conditions are subject to change without notice. Always conduct your own research and consult with a professional before making any financial decisions. Please note that our Terms and Conditions, Privacy Policy, and Disclaimers have been updated.

Here Are The Bitcoin Levels To Watch For The Short Term

Bitcoin LTH Selling Pressure Hits Yearly Low — Bull Market Ready For Take Off?

Will XRP Break Support and Drop Below $2?

Expert Predicts Pi Network To Reach $5 As Whales Move 41M Pi Coins Off Exchanges

Dogecoin Defies Bullish Bets During Dogeday Celebration

Tokens Big Players Are Buying

2.52 Million Altcoins Are Ruining Crypto’s Future

Animoca Brands Valuation Tanks 75% In Two Years, Here’s Why

Crypto exchange BingX hacked for $43 million

Are The Big Players Losing Interest?

Hong Kong’s Securities Association Tips Authorities On Crypto Self-Regulation

Coinbase cbBTC Set to go Live on Solana
2.52 Million Altcoins Are Ruining Crypto’s Future
Animoca Brands Valuation Tanks 75% In Two Years, Here’s Why
Crypto exchange BingX hacked for $43 million
Are The Big Players Losing Interest?
Hong Kong’s Securities Association Tips Authorities On Crypto Self-Regulation
Coinbase cbBTC Set to go Live on Solana
-
 Altcoin20 hours ago
Uniswap Founder Urges Ethereum To Pursue Layer 2 Scaling To Compete With Solana
-

 Ethereum16 hours ago
Ethereum Consolidates In Symmetrical Triangle: Expert Predicts 17% Price Move
-

 Bitcoin23 hours ago
Analyst Says Bitcoin Price Might Be Gearing Up For Next Big Move — What To Know
-
 Altcoin19 hours ago
What’s Up With BTC, XRP, ETH?
-

 Market16 hours ago
Today’s $1K XRP Bag May Become Tomorrow’s Jackpot, Crypto Founder Says
-
 Altcoin23 hours ago
Expert Reveals Why Consensus 2025 Will Be Pivotal For Pi Network
-
 Market10 hours ago
1 Year After Bitcoin Halving: What’s Different This Time?
-

 Ethereum19 hours ago
Ethereum Accumulators At A Crucial Moment: ETH Realized Price Tests Make-Or-Break Point