
Market
The Altcoin/BTC Spot Market Is Dying
Altcoin/BTC spot trading pairs were once considered a key channel for investors to increase their Bitcoin holdings. However, this perception is fading. Data indicates a decline in interest, with many Altcoin/BTC pairs delisted in early 2025.
Meanwhile, Altcoin/USDT spot pairs remain the primary avenue for traders seeking profits.
Binance Delists Multiple Altcoin/BTC Spot Pairs
At the beginning of 2025, Binance removed several Altcoin/BTC spot pairs from its platform. Today, Binance announced the delisting of MDT/BTC, MLN/BTC, VIB/BTC, VIC/BTC, and XAI/BTC due to low liquidity and trading volume. This is not the first such announcement this year.
“To protect users and maintain a high-quality trading market, Binance conducts periodic reviews of all listed spot trading pairs and may delist selected spot trading pairs due to multiple factors, such as poor liquidity and trading volume,” Binance stated.
Since the start of the year, Binance has issued seven delisting announcements, affecting 34 spot trading pairs. Of these, 50% were Altcoin/BTC pairs, while the rest were Altcoin/ETH or Altcoin/BNB. Notably, the delisting of an Altcoin/BTC pair does not necessarily mean its corresponding Altcoin/USDT pair is removed (e.g., ENJ, C98, REZ).
This shift reflects traders’ preference for Altcoin/Stablecoin pairs, likely due to better liquidity and lower risk exposure.
Retail Investors Reduce Bitcoin Holdings While Institutions Accumulate
CryptoQuant data shows that retail investors have been reducing their BTC holdings since Q4 2024, while large investors continue to accumulate.
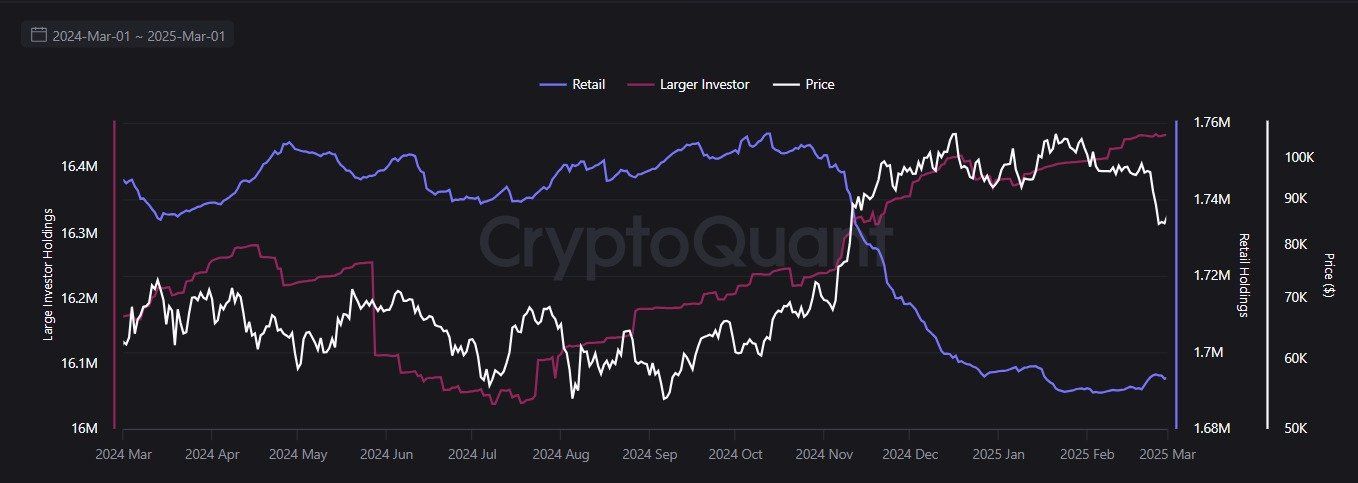
“Retail is panic-selling. Whales are accumulating,” Investor Mister Crypto commented.
Since the approval of Bitcoin ETFs and the start of Trump’s new term, Bitcoin has become a playground for institutional investors. Retail traders seem less interested, as BTC’s high price is out of reach for many. Instead, they hold fewer BTC and allocate more capital to altcoins, particularly meme coins.
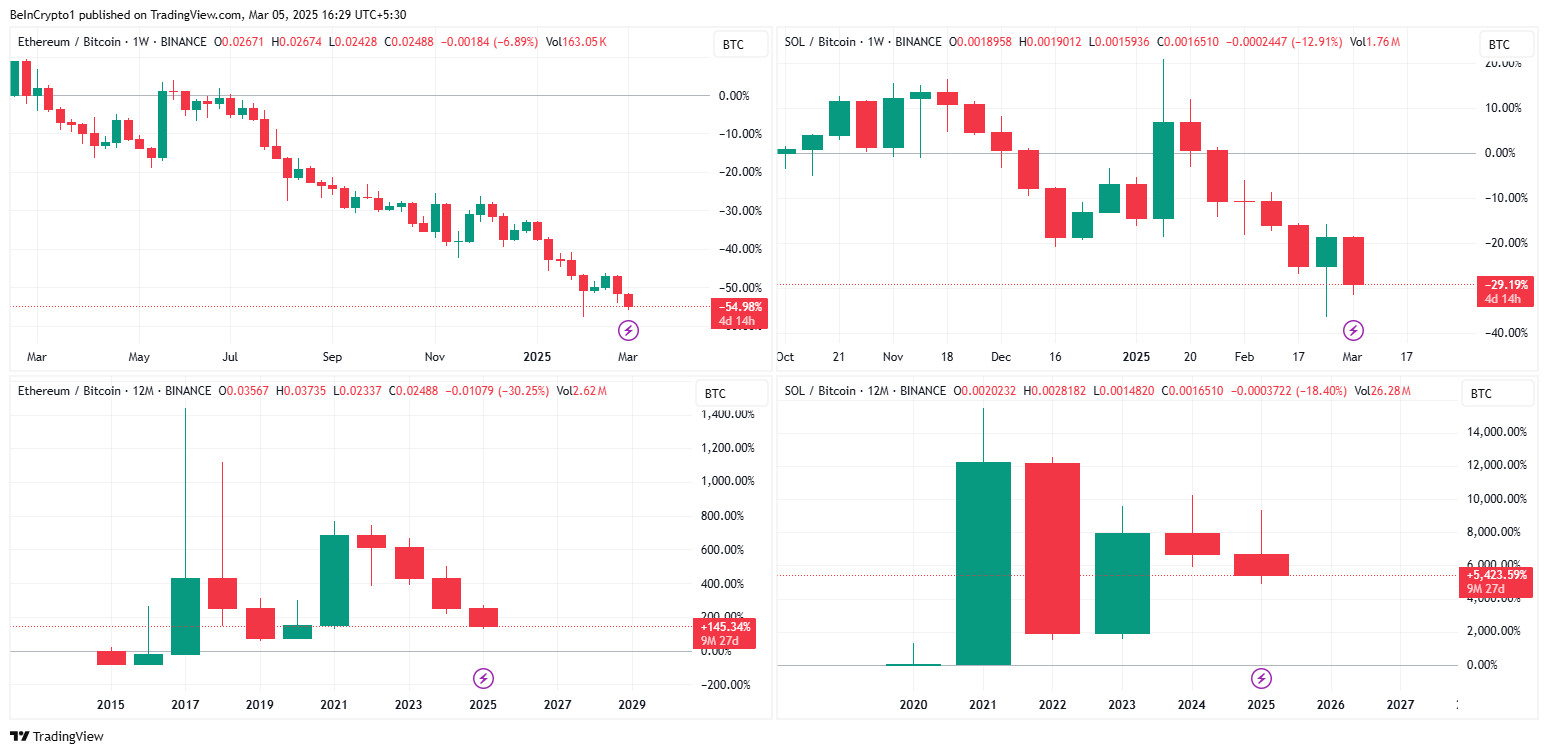
Furthermore, trading Altcoin/BTC pairs exposes traders to two risks simultaneously—the volatility of both altcoins and Bitcoin. Even the most liquid pairs, such as ETH/BTC and SOL/BTC, have shown prolonged downtrends and high volatility, increasing the risk of losses.
Market analysts also tend to focus on Altcoin/USDT spot pairs, leaving Altcoin/BTC pairs with less attention.
According to CoinMarketCap data, USDT’s daily trading volume exceeds $115 billion, out of a total market trading volume of $147 billion. This confirms that USDT remains the primary channel for traders seeking opportunities.
Disclaimer
In adherence to the Trust Project guidelines, BeInCrypto is committed to unbiased, transparent reporting. This news article aims to provide accurate, timely information. However, readers are advised to verify facts independently and consult with a professional before making any decisions based on this content. Please note that our Terms and Conditions, Privacy Policy, and Disclaimers have been updated.


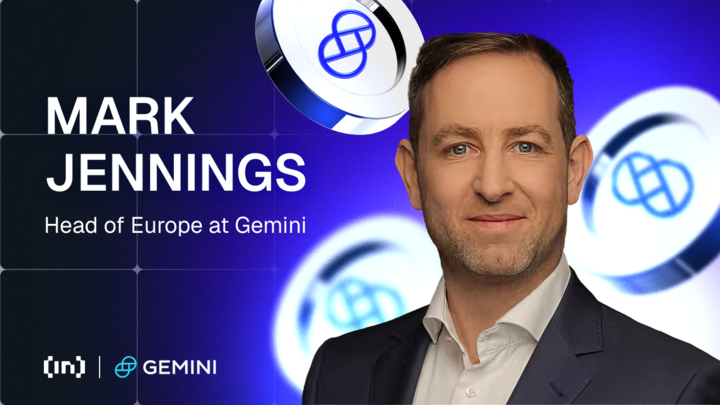
During the 2025 edition of the Paris Blockchain Week (PBS), BeInCrypto sat with Mark Jennings, Head of Europe at crypto exchange Gemini, for an in-depth conversation about the exchange’s regulatory-first strategy and its expanding European footprint. Gemini—founded by the Winklevoss twins—has spent the last decade cementing its reputation as a secure and compliant platform for digital assets.
With the implementation of MiCA in Europe and the company’s pending IPO, Jennings emphasized how regulatory clarity is paving the way for broader crypto adoption and Gemini’s next growth phase across the continent.
How Gemini Sets Itself Apart in a Crowded Exchange Market
If you look at it as a whole, Gemini was born in 2015 from the founders who saw the future around Bitcoin and were early investors there. The key that Gemini has looked at is “how do we secure longevity here?”. For our position, it’s always been “ask for permission”. So, we’ve always taken the regulatory route first in terms of establishing ourselves. If you look at the US, we were registered as a New York Trust and then you move into Europe, registered as a VASP in Ireland. We were the first to get that in Ireland.
I think the key for us has been what is happening in Europe this year when we see MiCA being implemented. It gives us a secure platform to grow into Europe, certainty in the regulatory environment, and how we grow. That’s been at the core of what Gemini has done for the last 10 years, and we see that’s a key way for us to continue to build and grow. One is that we’re a trusted, safe, and secure platform for you to unwrap your fear, trade, and provide secure custody. For us, it’s key for our customers to be able to go on that journey with them and understand if there’s a secure regulatory infrastructure to do that. And now that there’s clarity in Europe, we’re going to continue to build and grow our businesses.
Crypto Regulation in Europe vs. the US
In my role as head of Europe, I’m focused on what the European regulators are looking at and it’s a positive move to see MiCA come into effect at the end of last year.
What I do see as positive if you look to the US, a cryptocurrency stablecoin regulation is on the table for discussion; you know, we can’t manage different regulatory environments but we do see that there is a positive sentiment towards it. They’re looking to put a framework in place, and we see that as a positive for crypto as a whole. From my perspective, we can see that each regulator is now starting to address that.
Also, we’re serving different customers, and so we work under the regulation here in Europe, but each ecosystem has a regulator that should provide positive mechanisms.
User Experience on Gemini
If you see our user experience within the app and within our ActiveTrader desktop functionality, we’re looking at a simple and secure UI ; so being able to see your assets, being able to fund your account very easily, being able to trade easily and knowing that you’ve got the security of Gemini’s customer platform behind it.
For us, it’s a very clear UI and very clear action points for someone to be able to access the platform and Cryptopedia and other educational resources that we have because understanding the different tokens that are available and the different features is part of the journey. That’s also what Gemini wants to do: help with education.
Gemini’s Approach to Platform Security
We’re talking about security from an insurance perspective, and understanding that our insurance infrastructure was built on a proprietary technology that was built at Gemini. I think that’s important for us to own that. We know how important that is for the ecosystem as a whole. For us, it’s been developed on our original New York Trust infrastructure.
We’ve built and replicated that as part of our MiCA licensing. So, we see that this really robust framework is what is underpinning the security there. If you look at the AML frameworks as part of our European regulation, it’s an important part for us to make sure that we know who our customers are, that we’re able to onboard them, and give them a really secure place to trade crypto.
Emerging Market Trends
I think there will be more mainstream adoption, understanding that crypto assets are now an accepted asset as part of somebody’s investment decision, and they’re looking at that. So, I think as that developed, the regulatory infrastructure has given people confidence. And from some of the statistics we’ve seen, that’s one of the biggest barriers to entry.
People have been uncertain about the regulatory infrastructure and where people sit. So now that we see that barrier being clearly set in the sand, people can start to engage more with crypto assets in general.
Is Crypto Losing Its Edge or Gaining Maturity?
I wouldn’t say cryptos are becoming boring [laughs]. What we’re seeing is that there’s a maturation of the market, and the market goes in that direction. And then people are making investment decisions. Institutions are also involved there; if you look at the synergies between markets, where there are more players within that market, it changes the market’s characteristics as a whole. I don’t think cryptos are ever going to be boring.
If you see what’s happening—the underlying technologies being built, the different networks that are there, the increasing pass-through, the increase in the transaction process—I don’t find any of that boring. I think it’s really exciting.
Gemini and DeFi
We’re not really in the DeFi space. We’re continuing to build our on-chain products, but at the moment there’s nothing in the DeFi space specifically. I think it’s an area of innovation that we’re continuing to see grow. Gemini, at its core, is an exchange and a custodian, and I think that’s what we’ll play going forward. But the on-chain team is definitely building and growing. We’ll see if anything comes to that.
I think we’re focused on our core strengths. I think that’s the area where we continue to build and grow. If you look at it, every player in the market is looking to build in a different fashion and solve a different problem. For us, we’re there as one of the largest exchanges. We want to continue to facilitate that. So I wouldn’t say that.
The Profile of Gemini’s Clientele
I think we’ve got a broad client base. We serve retail customers and institutional customers the same. I think we’re engaged with people who value the safety and security aspects of what we do. The fact that we took that regulatory viewpoint very early on resonates with a lot of customers.
I think we’ve built a product that we feel is fit for the environment, and we see customers come to us for that. I don’t know if we’ve targeted customers directly. We’ve built what we think is the best product for customers who want it.
Strategy to Recruit New Customers
Education is one thing. Giving people an understanding of what we can bring to them, whether it’s safety and security of custody, the ability to trade, the ability to fund. I think education is key.
The second piece is the simplification of the process. How do we help them along that journey, from onboarding with us, to being able to fund their account, to being able to use these assets ? That’s key. We want to make sure it’s simple and straightforward and that they understand what’s there.
And the third piece would be to continue to innovate. The crypto space moves very quickly. We want to leverage those technologies to help improve the process and be able to allow people to engage with the crypto ecosystem using the Gemini platform.
These are the three pillars I see.
Gemini’s Vision for Growth
In my role as Head of Europe, the regular landscape has been key. We’re really looking to build our business in Europe. We want to provide a product that can engage all 32 countries that are under the EEA umbrella.
For us, it’s about a very simple and clean UI, getting people very clear access to the platform, and being able to cater to their needs, whether it’s from a funding perspective or from a trading perspective. Keep evolving our products. We get feedback from our customers; we want to continue to evolve on that.
Expectations from Paris Blockchain Week
There are a number of our partners and competitors here. Being involved in the ecosystem, you understand what people are working on, what startups are doing, and how they’re trying to solve some of our problems. I’m here to meet as many people as I can and learn. In this space as a whole, learning is the number one tool.
The second thing is to make people aware of Gemini and our plans in Europe to continue to grow the business. There are so many great businesses I want to know more about. If I get time throughout the day, I will certainly do. But I also want to make sure people see the Gemini team and that you get to speak to us face to face. We want to learn more, we love getting feedback, and we want to be able to adapt on that.
Disclaimer
In compliance with the Trust Project guidelines, this opinion article presents the author’s perspective and may not necessarily reflect the views of BeInCrypto. BeInCrypto remains committed to transparent reporting and upholding the highest standards of journalism. Readers are advised to verify information independently and consult with a professional before making decisions based on this content. Please note that our Terms and Conditions, Privacy Policy, and Disclaimers have been updated.


Ethereum (ETH) co-founder Vitalik Buterin has proposed a comprehensive roadmap to enhance user privacy on the blockchain.
The plan envisions creating a world where private transactions are the default, and users can interact across applications without publicly linking their activities.
Vitalik Buterin Unveils Privacy-Focused Ethereum Roadmap
Buterin shared the roadmap on April 11 on the Ethereum Magicians forum. It outlined practical, incremental improvements to make private transactions and anonymous on-chain interactions more accessible for everyday users without requiring major changes to Ethereum’s core consensus protocol.
“This roadmap can be combined with a longer-term roadmap that makes deeper changes to L1, or privacy-preserving application-specific rollups, or other more complex features,” Buterin stated.
The roadmap addresses four key privacy forms by implementing various short-term and long-term solutions. These are focused on improving on-chain payment privacy, partial anonymization of in-app activity, privacy of on-chain reads, and network-level anonymity.
Firstly, he advocated for integrating privacy tools into wallets. This would enable features like default “shielded balances,” allowing users to keep transactions private. The idea is to enhance privacy without requiring users to switch to a separate privacy-focused wallet.
Next, Buterin suggested a “one address per application” standard to limit traceability.
“This is a major step, and it entails significant convenience sacrifices, but IMO, this is a bullet that we should bite because this is the most practical way to remove public links between all of your activity across different applications,” he said.
Additionally, Buterin proposed making “send-to-self” transactions privacy-preserving by default. According to him, this is necessary for the address-per-application design to function effectively.
He also focused on using Trusted Execution Environments (TEEs) in the short term for RPC privacy. Buterin added that Private Information Retrieval (PIR) could be used in the future.
“If we also add security armoring to RPC nodes (ie. light client support), it becomes practical for a user to trust a much larger set of RPC servers. This reduces metadata leakage,” Buterin remarked.
The roadmap outlined deeper changes for the long term, such as EIP-7701 (account abstraction) and FOCIL (Fork-Choice enforced Inclusion Lists) implementation. This would allow privacy protocols to operate without centralized relays, making them more resilient to censorship. That’s not all. It would also contribute to increased privacy.
Buterin’s roadmap has generated substantial traction from the community, with many expressing optimism. The Ethereum ecosystem has long been calling for improvements in user privacy, and this new plan seems to resonate with those concerns.
“Vitalik’s finally giving privacy the attention it deserves, this roadmap looks like a solid step toward making Ethereum more user-friendly without messing with consensus,” an analyst posted.
Nonetheless, not all feedback was unequivocally positive. Some in the community remain cautious about the potential challenges involved in implementing such ambitious changes.
“Vitalik’s roadmap is solid but execution risk is high. Adopting zk tech is key if they want real privacy without bloating L1,” another analyst cautioned.
The proposal comes as the Ethereum ecosystem prepares for the Pectra upgrade. While Pectra focuses on performance and usability, Buterin’s privacy roadmap complements these efforts by addressing a critical user need. If executed, these changes could position Ethereum as a more privacy-conscious blockchain, potentially driving greater adoption as the network evolves.
Disclaimer
In adherence to the Trust Project guidelines, BeInCrypto is committed to unbiased, transparent reporting. This news article aims to provide accurate, timely information. However, readers are advised to verify facts independently and consult with a professional before making any decisions based on this content. Please note that our Terms and Conditions, Privacy Policy, and Disclaimers have been updated.
Aayush Jindal, a luminary in the world of financial markets, whose expertise spans over 15 illustrious years in the realms of Forex and cryptocurrency trading. Renowned for his unparalleled proficiency in providing technical analysis, Aayush is a trusted advisor and senior market expert to investors worldwide, guiding them through the intricate landscapes of modern finance with his keen insights and astute chart analysis.
From a young age, Aayush exhibited a natural aptitude for deciphering complex systems and unraveling patterns. Fueled by an insatiable curiosity for understanding market dynamics, he embarked on a journey that would lead him to become one of the foremost authorities in the fields of Forex and crypto trading. With a meticulous eye for detail and an unwavering commitment to excellence, Aayush honed his craft over the years, mastering the art of technical analysis and chart interpretation.
As a software engineer, Aayush harnesses the power of technology to optimize trading strategies and develop innovative solutions for navigating the volatile waters of financial markets. His background in software engineering has equipped him with a unique skill set, enabling him to leverage cutting-edge tools and algorithms to gain a competitive edge in an ever-evolving landscape.
In addition to his roles in finance and technology, Aayush serves as the director of a prestigious IT company, where he spearheads initiatives aimed at driving digital innovation and transformation. Under his visionary leadership, the company has flourished, cementing its position as a leader in the tech industry and paving the way for groundbreaking advancements in software development and IT solutions.
Despite his demanding professional commitments, Aayush is a firm believer in the importance of work-life balance. An avid traveler and adventurer, he finds solace in exploring new destinations, immersing himself in different cultures, and forging lasting memories along the way. Whether he’s trekking through the Himalayas, diving in the azure waters of the Maldives, or experiencing the vibrant energy of bustling metropolises, Aayush embraces every opportunity to broaden his horizons and create unforgettable experiences.
Aayush’s journey to success is marked by a relentless pursuit of excellence and a steadfast commitment to continuous learning and growth. His academic achievements are a testament to his dedication and passion for excellence, having completed his software engineering with honors and excelling in every department.
At his core, Aayush is driven by a profound passion for analyzing markets and uncovering profitable opportunities amidst volatility. Whether he’s poring over price charts, identifying key support and resistance levels, or providing insightful analysis to his clients and followers, Aayush’s unwavering dedication to his craft sets him apart as a true industry leader and a beacon of inspiration to aspiring traders around the globe.
In a world where uncertainty reigns supreme, Aayush Jindal stands as a guiding light, illuminating the path to financial success with his unparalleled expertise, unwavering integrity, and boundless enthusiasm for the markets.

6.96 Billion Dogecoin In 24 Hours As DOGE Price Adds 1%

MiCA Boosts Gemini’s Expansion Plans Across Europe
Why Pi Network Price Should Hit $10, Or Its Over for Pi Coin

How Vitalik Buterin Plans to Enhance Ethereum’s Privacy
Which Altcoins Made Grayscale’s Q2 2025 Cut?

BNB Price Recovery in Motion—Uphill Battle Ahead Near Crucial $600 Level

2.52 Million Altcoins Are Ruining Crypto’s Future

Animoca Brands Valuation Tanks 75% In Two Years, Here’s Why

Crypto exchange BingX hacked for $43 million

Are The Big Players Losing Interest?

Hong Kong’s Securities Association Tips Authorities On Crypto Self-Regulation

Coinbase cbBTC Set to go Live on Solana
2.52 Million Altcoins Are Ruining Crypto’s Future
Animoca Brands Valuation Tanks 75% In Two Years, Here’s Why
Crypto exchange BingX hacked for $43 million
Are The Big Players Losing Interest?
Hong Kong’s Securities Association Tips Authorities On Crypto Self-Regulation
Coinbase cbBTC Set to go Live on Solana
-

 Altcoin22 hours ago
Binance Lists BABY As Bitcoin Protocol Babylon Goes Live
-

 Regulation19 hours ago
Cash App’s Block Inc Settles for $40 Million Over AML Failures For Crypto Platform
-
 Bitcoin23 hours ago
Bullish Signal for Bitcoin in 2025?
-

 Market23 hours ago
Solana (SOL) Jumps But Smacks Into $120 Resistance Wall—Can It Break Through?
-
 Market22 hours ago
Onyxcoin Buyers Drive Strong Demand as XCN Surges Past $0.01
-

 Market21 hours ago
XRP Price Eyes $2.0 Breakout—Can It Hold and Ignite a Bullish Surge?
-

 Bitcoin18 hours ago
Florida Bitcoin Reserve Bill Passes House With Zero Votes Against
-
 Altcoin7 hours ago
XRP Price Risks 40% Drop to $1.20 If It Doesn’t Regain This Level