
Market
Solana (SOL) Breaks $140 Mark Despite Competition From BNB

Solana (SOL) is up nearly 9% in the last 24 hours, climbing above $140 for the first time since March 8, despite BNB surging to become the biggest chain in DEX volume last week.
While price action has strengthened, Solana’s market still shows mixed signals, with some large investors remaining cautious. Traders are now watching key resistance and support levels to gauge whether SOL can sustain its rally or face a potential pullback.
Solana RSI Rise Above 70 For The First Time Since March 2
Solana’s RSI has surged from 52.46 yesterday to 72.91 today, marking the first time it has entered overbought territory since March 2.
This sharp rise signals a sudden acceleration in buying momentum after nearly two weeks of neutral readings hovering around the mid-50s.
The breakout above the 70 level suggests a notable shift in sentiment, as traders have pushed SOL into a more aggressive bullish stance.
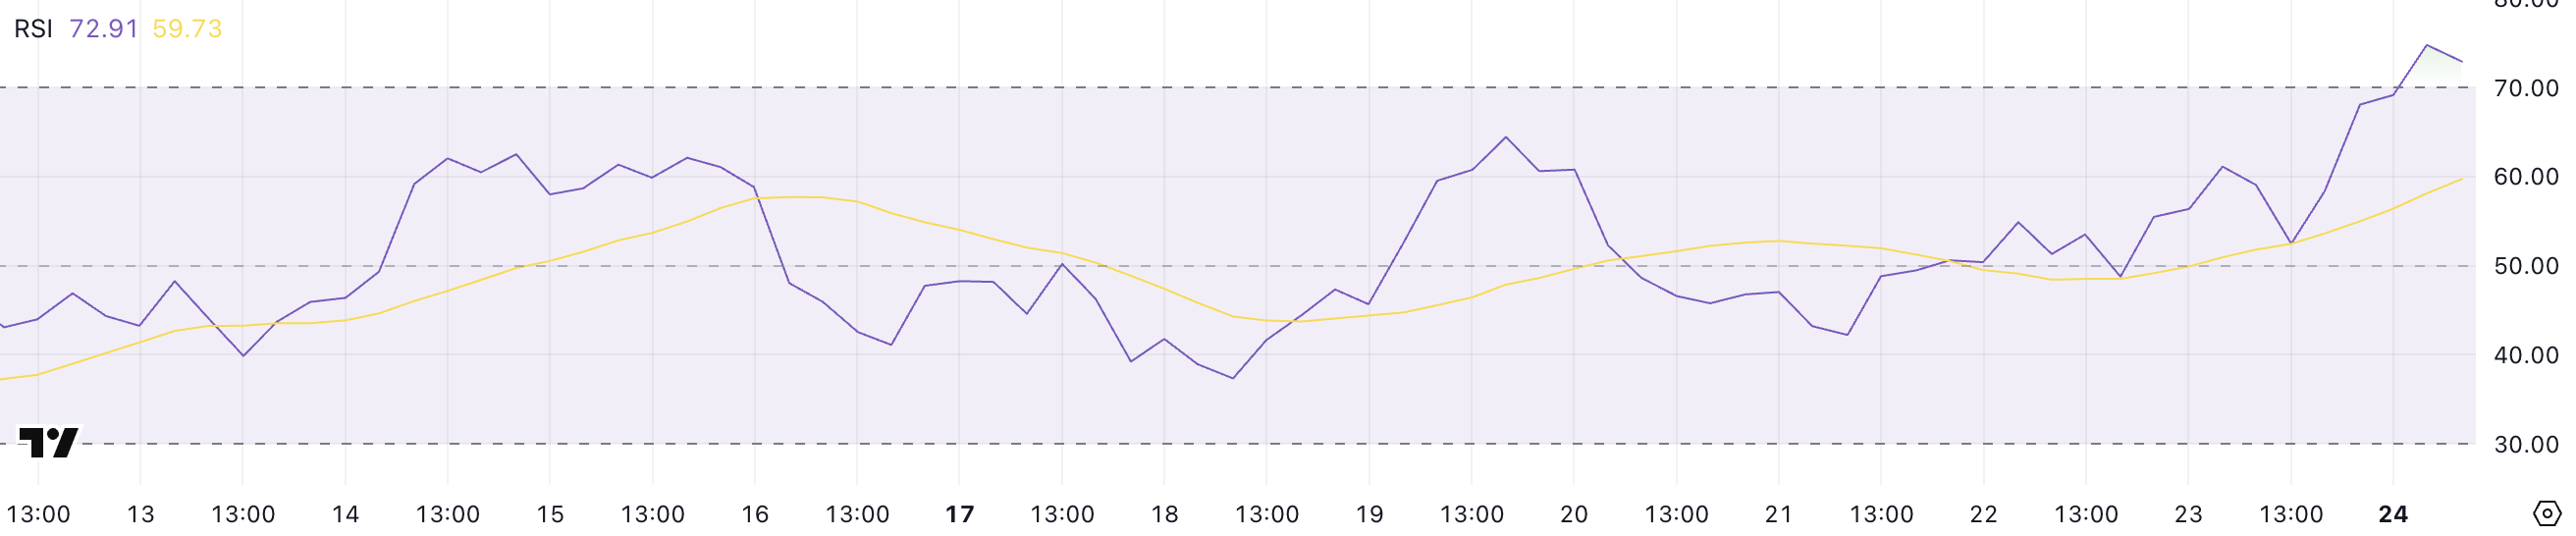
The Relative Strength Index (RSI) is a momentum oscillator that measures the speed and change of price movements. It helps traders identify potential overbought or oversold conditions.
Typically, an RSI value above 70 is considered overbought, indicating that an asset may be due for a corrective pullback. Readings below 30 are viewed as oversold, suggesting possible upside reversals. Solana’s RSI, currently at 72.91, highlights a strong bullish push but also raises caution about a potential short-term correction as BNB overtakes Solana in DEX volume.
Given that SOL had been trading in a neutral zone for the past 12 days, this sudden spike could either mark the start of a stronger rally or signal a temporary overheating in price momentum.
SOL Whales Are Still Hesitant
The number of Solana whales – wallets holding at least 10,000 SOL – is currently at 5,019, slightly down from the recent peak of 5,041 recorded on March 18.
This fluctuation highlights ongoing shifts in large-holder behavior, as whale activity has yet to stabilize fully. While the recent whale count remains elevated compared to earlier levels this month, it still suggests hesitation among large investors to re-enter the market fully.
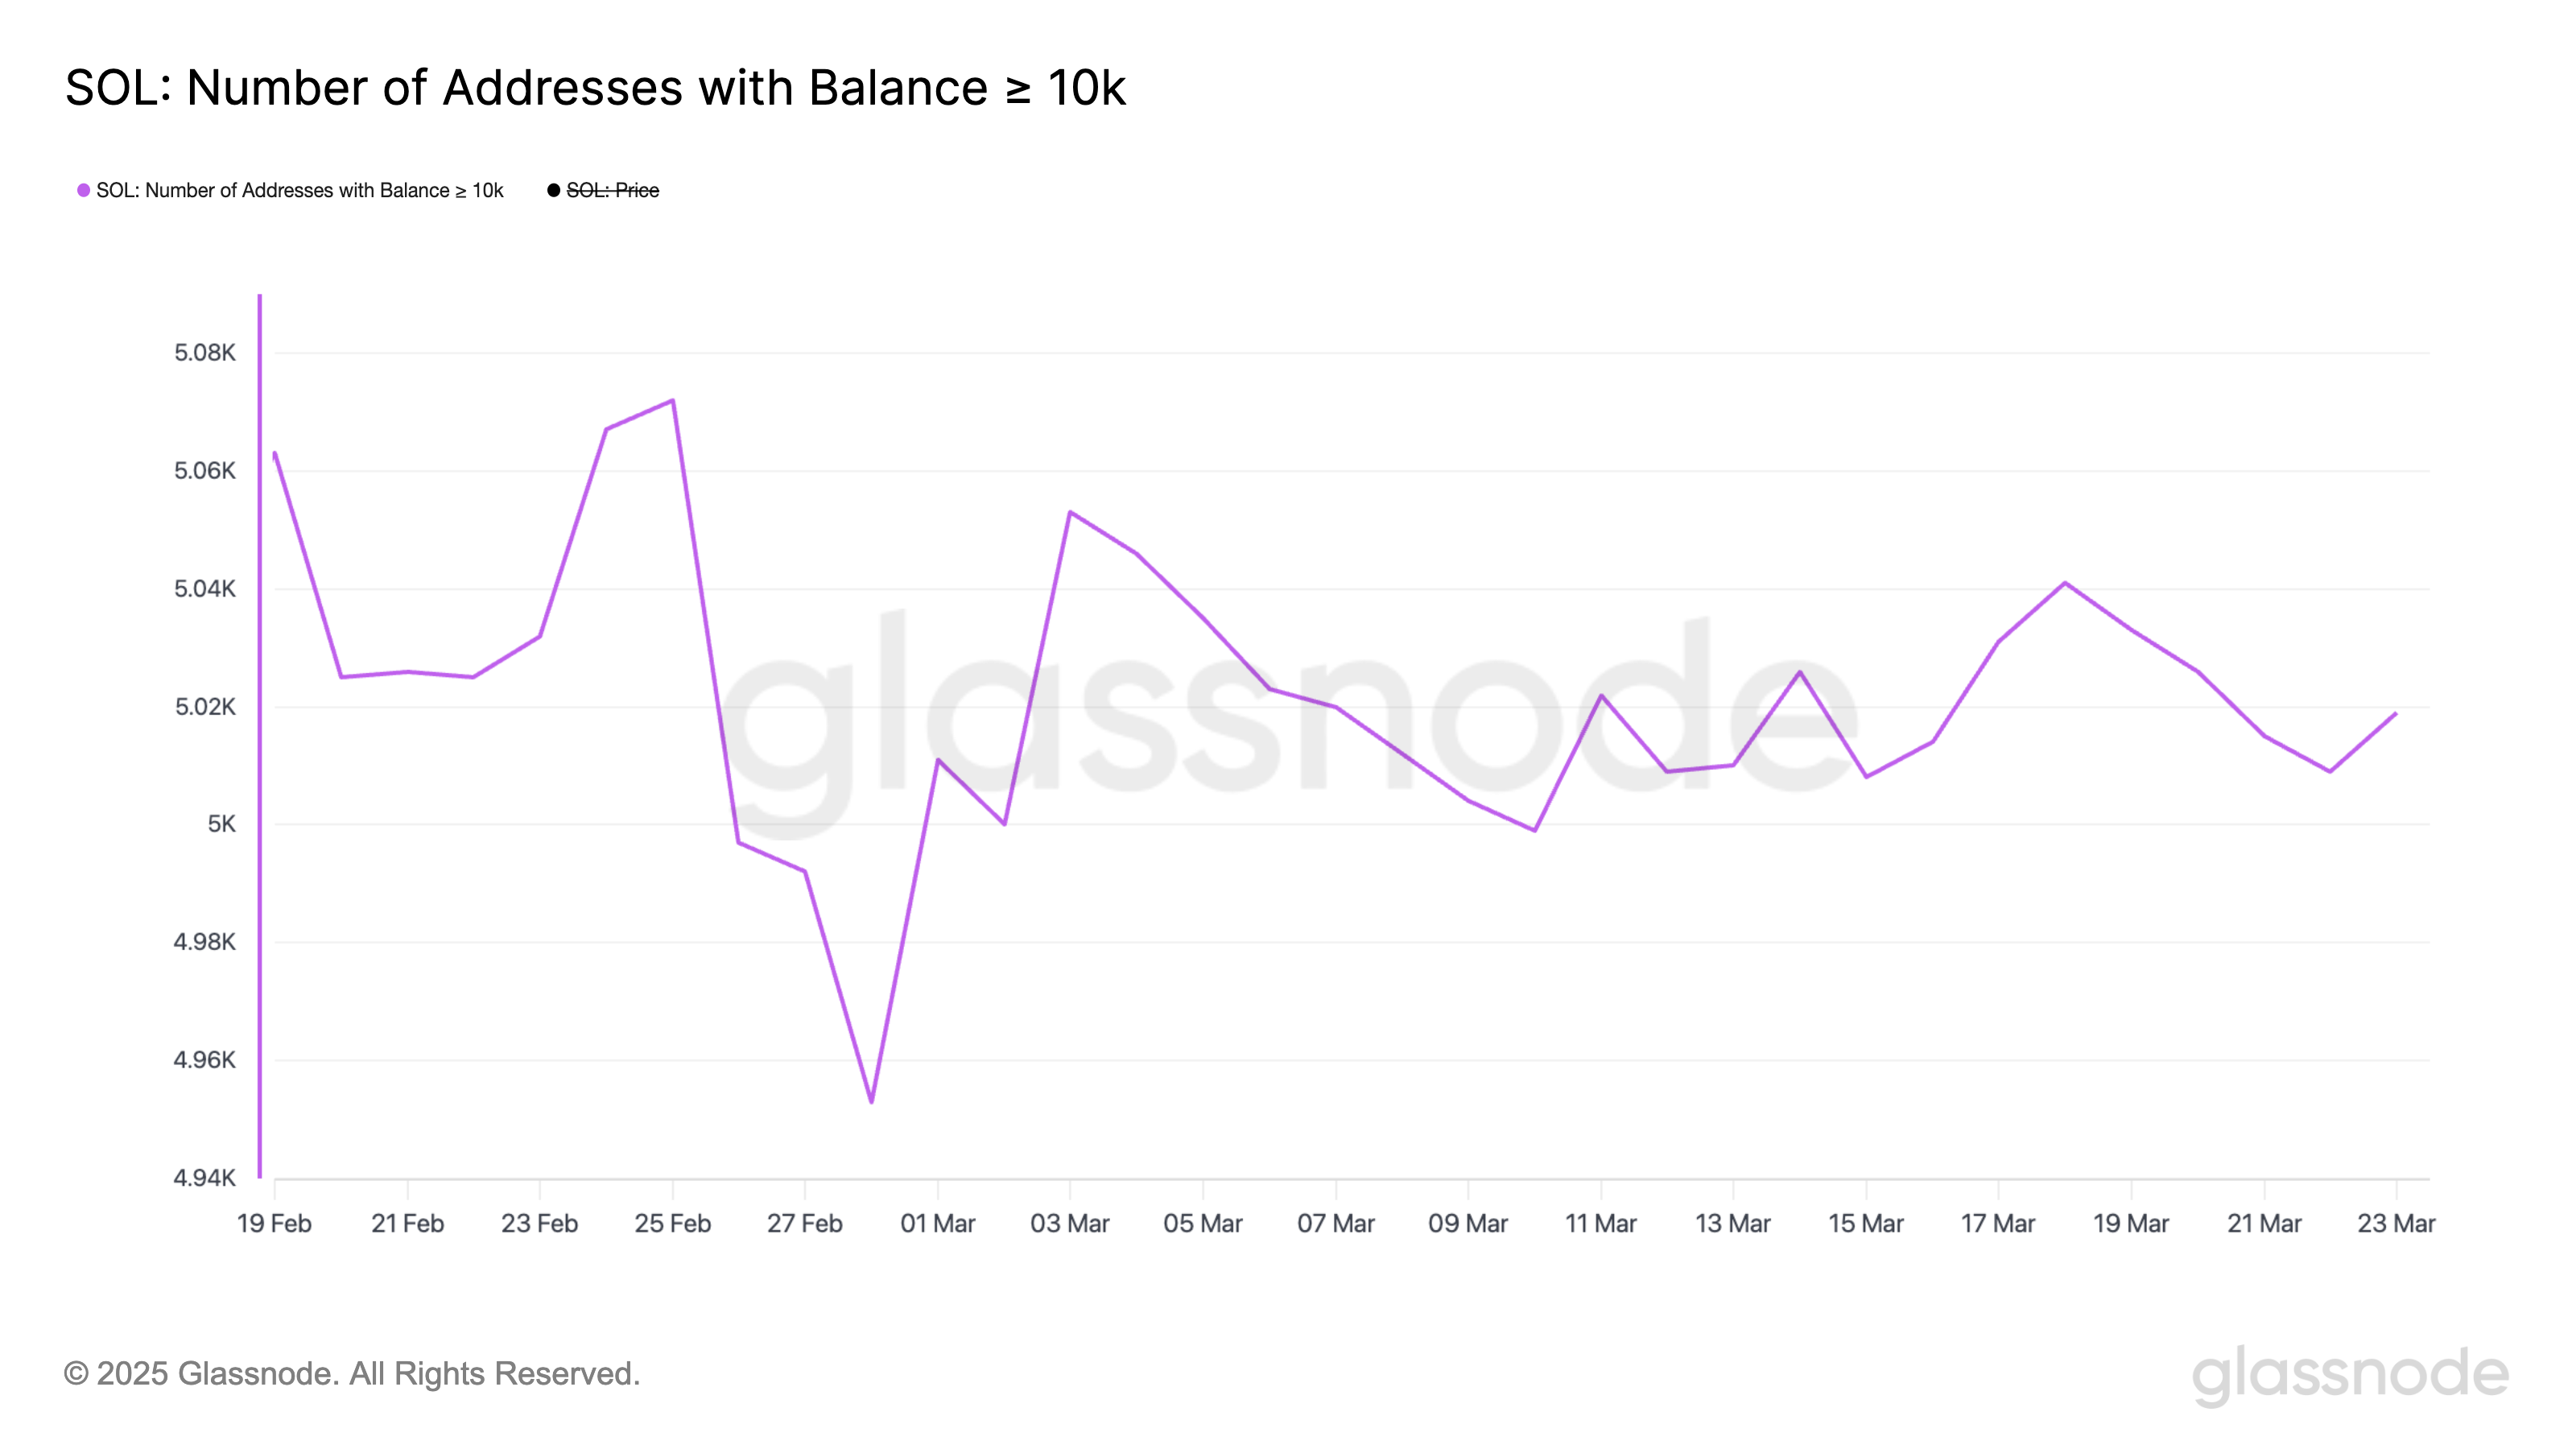
Tracking whale activity is crucial because these large holders often significantly influence market trends and liquidity. An increase in whale addresses can indicate accumulation and growing confidence, while a decline may signal distribution or caution.
With the current whale count showing signs of volatility and retreating slightly from recent highs, it suggests that major players are still uncertain about Solana’s short-term direction.
Until this number shows more consistent growth, it could imply that SOL’s price may remain sensitive to fluctuations and lack the solid backing typically seen during stronger bullish trends.
Can Solana Sustain The Current Levels?
Solana’s EMA lines recently confirmed a golden cross, signaling the potential for a bullish continuation. Further golden crosses may form soon.
If the current uptrend strengthens, Solana’s price could rise to challenge the resistance at $152.90 and, if momentum persists, extend gains toward the $180 mark.
Despite concerns within the community regarding the competition between PumpFun and Raydium, Chris Chung, founder of Solana-based swap platform Titan, argues that this rivalry could actually benefit Solana’s broader ecosystem:
“Pump.fun launching its own DEX was inevitable as they believe they have a strong enough brand now to eliminate the Raydium tech stack and collect AMM fees themselves. In addition, Raydium announced plans for its own launchpad, showing that competition in the Solana ecosystem is heating up – and fast. It’s great to see new players enter with ideas to improve the speed and usability of end users. This type of competitive behavior helps build robust financial products and DeFi protocols and simply makes Solana’s activity grow,” Chung told BeInCrypto.
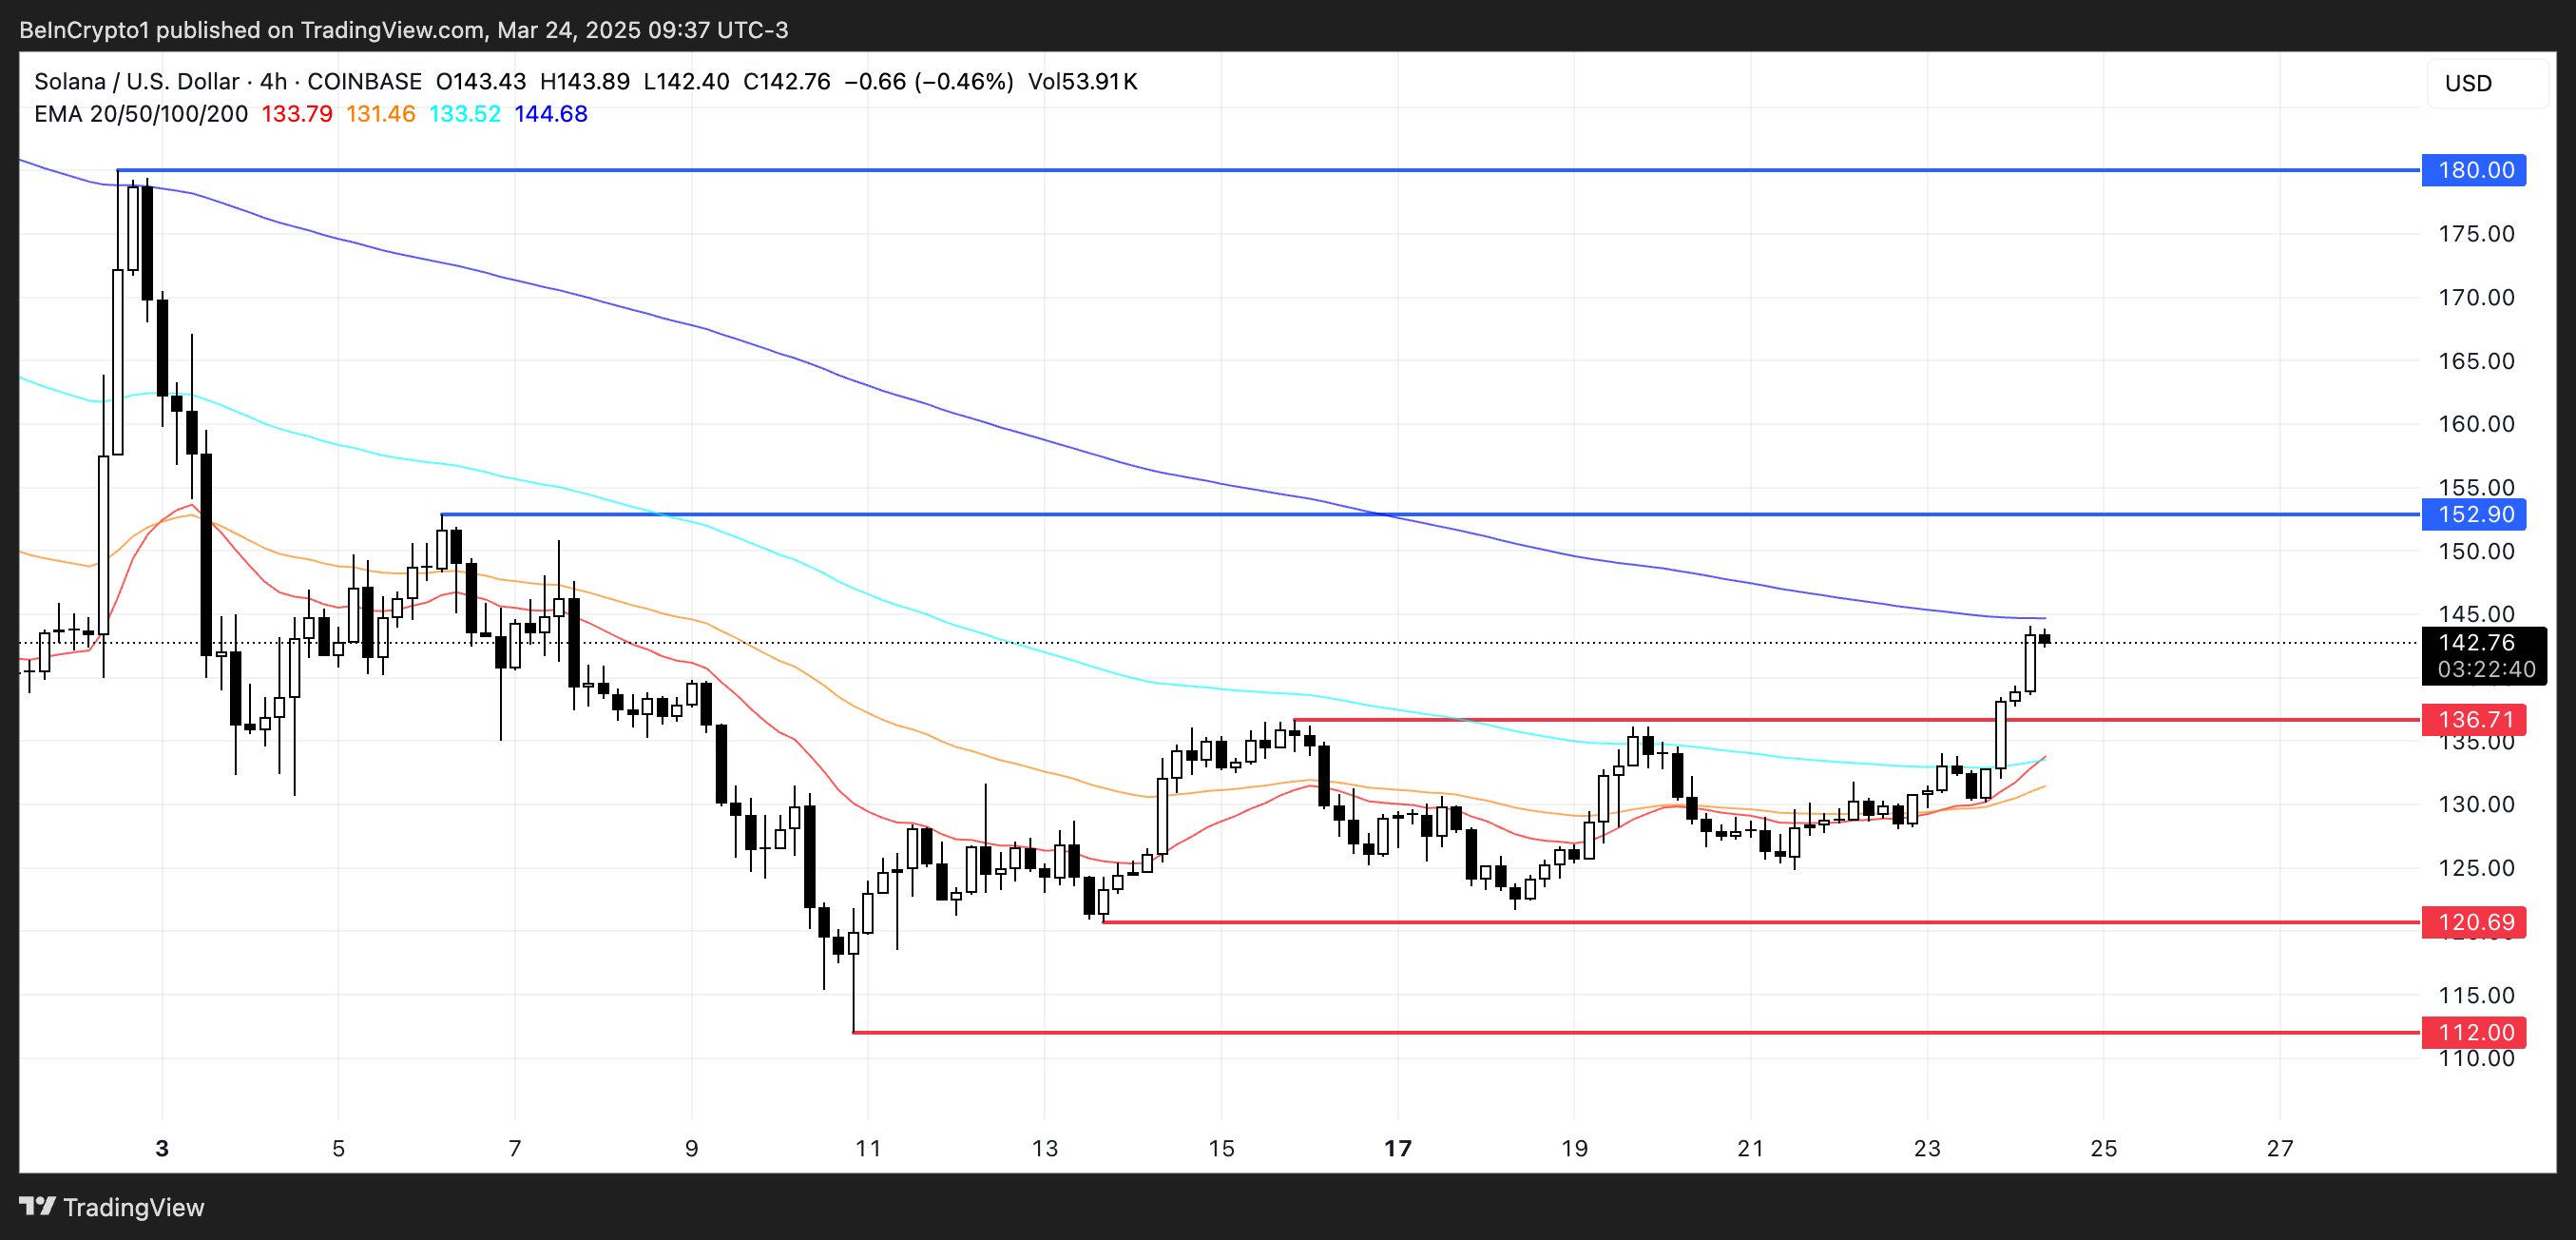
However, if bullish momentum weakens and the uptrend reverses, SOL could retest key support at $136.71.
A break below this level could expose Solana to further downside, with a target of $120 and potentially $112 if selling pressure intensifies.
Disclaimer
In line with the Trust Project guidelines, this price analysis article is for informational purposes only and should not be considered financial or investment advice. BeInCrypto is committed to accurate, unbiased reporting, but market conditions are subject to change without notice. Always conduct your own research and consult with a professional before making any financial decisions. Please note that our Terms and Conditions, Privacy Policy, and Disclaimers have been updated.


Reason to trust
![]()
Strict editorial policy that focuses on accuracy, relevance, and impartiality
Created by industry experts and meticulously reviewed
The highest standards in reporting and publishing
Strict editorial policy that focuses on accuracy, relevance, and impartiality
Morbi pretium leo et nisl aliquam mollis. Quisque arcu lorem, ultricies quis pellentesque nec, ullamcorper eu odio.
Ethereum price started a fresh decline from the $1,690 zone. ETH is now consolidating and might decline further below the $1,580 support zone.
- Ethereum started a fresh decline after it failed to clear $1,700 and $1,720.
- The price is trading below $1,620 and the 100-hourly Simple Moving Average.
- There was a break below a new connecting bullish trend line with support at $1,625 on the hourly chart of ETH/USD (data feed via Kraken).
- The pair could start a fresh increase if it clears the $1,640 resistance zone.
Ethereum Price Faces Rejection
Ethereum price formed a base above $1,550 and started a fresh increase, like Bitcoin. ETH gained pace for a move above the $1,600 and $1,620 resistance levels.
The bulls even pumped the price above the $1,650 zone. A high was formed at $1,690 and the price recently corrected gains. There was a move below the $1,640 support zone. Besides, there was a break below a new connecting bullish trend line with support at $1,625 on the hourly chart of ETH/USD.
The price tested the 50% Fib retracement level of the upward move from the $1,472 swing low to the $1,690 high. Ethereum price is now trading below $1,625 and the 100-hourly Simple Moving Average.
On the upside, the price seems to be facing hurdles near the $1,620 level. The next key resistance is near the $1,640 level. The first major resistance is near the $1,650 level. A clear move above the $1,650 resistance might send the price toward the $1,690 resistance.

An upside break above the $1,690 resistance might call for more gains in the coming sessions. In the stated case, Ether could rise toward the $1,750 resistance zone or even $1,800 in the near term.
More Losses In ETH?
If Ethereum fails to clear the $1,640 resistance, it could start another decline. Initial support on the downside is near the $1,580 level. The first major support sits near the $1,555 zone and the 61.8% Fib retracement level of the upward move from the $1,472 swing low to the $1,690 high.
A clear move below the $1,555 support might push the price toward the $1,525 support. Any more losses might send the price toward the $1,450 support level in the near term. The next key support sits at $1,420.
Technical Indicators
Hourly MACD – The MACD for ETH/USD is gaining momentum in the bearish zone.
Hourly RSI – The RSI for ETH/USD is now below the 50 zone.
Major Support Level – $1,580
Major Resistance Level – $1,640

Semler Scientific (SMLR), a US-based medical technology company, has revealed plans to acquire more Bitcoin (BTC) despite facing a 5.0% unrealized loss on its previous BTC investments.
The firm has filed a Form S-3 registration with the US Securities and Exchange Commission (SEC) to raise up to $500 million through a securities offering. The proceeds would be allocated for general corporate purposes, including expanding its Bitcoin portfolio.
Semler Scientific Files S-3 to Fund Bitcoin Investments
According to the official filing, the firm plans to issue common stock, preferred stock, debt securities, and warrants as part of the securities offering. The SEC filing does not specify the exact amount allocated for Bitcoin purchases. Nonetheless, Semler’s recent activity suggests a strong focus on cryptocurrency.
“We have not determined the amount of net proceeds to be used specifically for such purposes. As a result, management will retain broad discretion over the allocation of the net proceeds of any offering,” the filing read.
This move follows Semler’s previous acquisition of 871 BTC for $88.5 million at an average price of $101,616 per Bitcoin. The purchases were made between January 11 and February 3.
The acquisition increased Semler’s total Bitcoin holdings to 3,192 BTC. The holdings worth $266.1 million represent 80.6% of the company’s total market capitalization of 330.1 million. This indicates that a significant portion of its value is tied to its Bitcoin investments.
“From January 1, 2025, to February 3, 2025, Semler Scientific’s BTC Yield was 21.9%. From July 1, 2024 (the first full quarter after Semler Scientific adopted its bitcoin treasury strategy) to February 3, 2025, Semler Scientific’s BTC Yield was 152.2%,” the firm revealed.
However, the tides have shifted since then. According to Bitcoin Treasuries, Semler’s average BTC acquisition cost is $87,850 per coin. As of the latest data from BeInCrypto, Bitcoin’s market price stood at $83,397, placing Semler at a 5.0% loss on its investment.

Previously, BeInCrypto noted that the losses surged to 14.7% as BTC fell below the $80,000 mark. Despite this, Semler’s leadership appears committed to its Bitcoin strategy, viewing the cryptocurrency as a long-term store of value.
Semler’s strategic push into Bitcoin mirrors those of other firms, such as Strategy (formerly MicroStrategy) and Metaplanet. Earlier this week, the firms acquired BTC worth $285 million and $26.3 million, respectively.
However, Semler’s decision to double down on Bitcoin comes amid financial and legal challenges. On April 15, the company announced a preliminary $29.75 million settlement with the US Department of Justice (DOJ) to resolve allegations of violating federal anti-fraud laws related to marketing its QuantaFlo product.
The settlement is pending final approval. Yet, it adds pressure to Semler’s balance sheet as it navigates its ambitious fundraising and Bitcoin investment plans.
Disclaimer
In adherence to the Trust Project guidelines, BeInCrypto is committed to unbiased, transparent reporting. This news article aims to provide accurate, timely information. However, readers are advised to verify facts independently and consult with a professional before making any decisions based on this content. Please note that our Terms and Conditions, Privacy Policy, and Disclaimers have been updated.

Cardano price started a fresh decline from the $0.680 zone. ADA is consolidating near $0.620 and remains at risk of more losses.
- ADA price started a recovery wave from the $0.5850 zone.
- The price is trading below $0.640 and the 100-hourly simple moving average.
- There is a connecting bearish trend line forming with resistance at $0.6350 on the hourly chart of the ADA/USD pair (data source from Kraken).
- The pair could start another increase if it clears the $0.640 resistance zone.
Cardano Price Faces Resistance
In the past few sessions, Cardano saw a fresh decline from the $0.680 level, like Bitcoin and Ethereum. ADA declined below the $0.650 and $0.640 support levels.
A low was formed at $0.6040 and the price is now consolidating losses. There was a minor move above the $0.6120 level. The price tested the 23.6% Fib retracement level of the recent decline from the $0.6481 swing high to the $0.6040 low.
Cardano price is now trading below $0.640 and the 100-hourly simple moving average. On the upside, the price might face resistance near the $0.6260 zone and the 50% Fib retracement level of the recent decline from the $0.6481 swing high to the $0.6040 low.
The first resistance is near $0.6350. There is also a connecting bearish trend line forming with resistance at $0.6350 on the hourly chart of the ADA/USD pair. The next key resistance might be $0.6480.

If there is a close above the $0.6480 resistance, the price could start a strong rally. In the stated case, the price could rise toward the $0.680 region. Any more gains might call for a move toward $0.70 in the near term.
Another Drop in ADA?
If Cardano’s price fails to climb above the $0.6350 resistance level, it could start another decline. Immediate support on the downside is near the $0.6040 level.
The next major support is near the $0.60 level. A downside break below the $0.60 level could open the doors for a test of $0.580. The next major support is near the $0.5550 level where the bulls might emerge.
Technical Indicators
Hourly MACD – The MACD for ADA/USD is gaining momentum in the bearish zone.
Hourly RSI (Relative Strength Index) – The RSI for ADA/USD is now below the 50 level.
Major Support Levels – $0.6040 and $0.580.
Major Resistance Levels – $0.6350 and $0.6480.

Ethereum Price Dips Again—Time to Panic or Opportunity to Buy?

Did Ethereum Survive The Storm? Analyst Eyes Breakout Next

Bitcoin & Others Slip As Trump Imposes Up To 245% Tariff On China

Semler Doubles Down on Bitcoin Investments Despite Losses

China Liquidates Seized Crypto to Boost Struggling Treasury

Expert Reveals Current Status Of 9 Ripple ETFs

2.52 Million Altcoins Are Ruining Crypto’s Future

Animoca Brands Valuation Tanks 75% In Two Years, Here’s Why

Crypto exchange BingX hacked for $43 million

Are The Big Players Losing Interest?

Hong Kong’s Securities Association Tips Authorities On Crypto Self-Regulation

Coinbase cbBTC Set to go Live on Solana
2.52 Million Altcoins Are Ruining Crypto’s Future
Animoca Brands Valuation Tanks 75% In Two Years, Here’s Why
Crypto exchange BingX hacked for $43 million
Are The Big Players Losing Interest?
Hong Kong’s Securities Association Tips Authorities On Crypto Self-Regulation
Coinbase cbBTC Set to go Live on Solana
-

 Market23 hours ago
Ethereum Price Consolidation Hints at Strength—Is a Move Higher Coming?
-

 Market22 hours ago
Pi Network Price Rise To $1 is Now In The Hands Of Bitcoin
-

 Altcoin19 hours ago
Whispers Of Insider Selling As Mantra DAO Relocates Nearly $27 Million In OM To Binance
-

 Market18 hours ago
Trump Family Plans Crypto Game Inspired by Monopoly
-

 Bitcoin24 hours ago
Bolivia Reverses Crypto-for-Fuel Plan Amid Energy Crisis
-

 Market15 hours ago
Bitcoin Eyes $90,000, But Key Resistance Levels Loom
-
 Altcoin22 hours ago
Has XRP Price Already Bottomed? Analyst On How Ripple Coin Can Hit $15
-

 Market19 hours ago
Forget XRP At $3, Analyst Reveals How High Price Will Be In A Few Months
