
Market
Shiba Inu (SHIB) Price Halts With Surge in Exchange Deposits

In this analysis, we delve into Shiba Inu’s (SHIB) recent price action, examining key technical indicators and market signals across daily and four-hour timeframes.
Our focus includes the role of the Ichimoku cloud, the significance of the Tenkan-sen plateaus, and recent trends in exchange depositing addresses to provide a comprehensive outlook for SHIB.
Daily and Four-Hour Timeframe Analysis
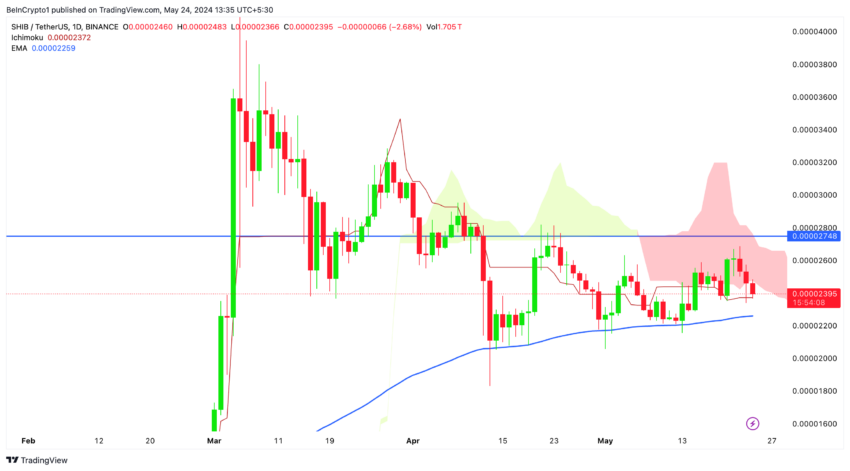
Let’s delve into Shiba Inu (SHIB) ‘s price action on the daily and four-hour timeframes. Currently, SHIB is trading at $0.00002393. Notably, the price has failed to enter the daily Ichimoku cloud on the upside, which is a major support level.
The price is now approaching a mid-term support level, represented by the red Tenkan-sen plateau on the chart. The 100 EMA (Exponential Moving Average) on the daily timeframe serves as a crucial mid-term support level for SHIB’s price.
The Tenkan-sen, or conversion line, is a key part of the Ichimoku system in technical analysis. It shows the average of the highest and lowest prices over the past nine periods, giving a short-term view of price trends.
Importance of Tenkan-Sen Plateaus
- Plateau Formation: When the Tenkan-sen flattens, it indicates a balance between buyers and sellers, creating important market levels.
- Support: If the price is above a Tenkan-sen plateau and falls, the plateau can act as a support level, where buyers are likely to step in.
- Resistance: If the price is below a Tenkan-sen plateau and rises, the plateau can act as a resistance level, where sellers are likely to step in.
Read More: How To Buy Shiba Inu (SHIB) and Everything You Need To Know
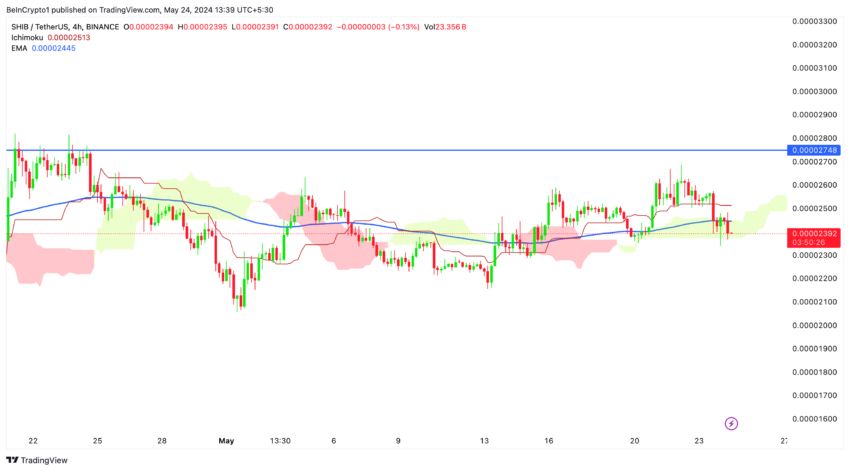
Zooming into the four-hour timeframe, we see a similar pattern. The price attempts to break below the Ichimoku cloud, which could accelerate the downward movement. If it tests this level, the lower boundary of the cloud will act as a critical support level to watch.
Additionally, the price has broken below the 100 EMA in the four-hour timeframe, which is also a bearish signal.
These combined signals highlight the importance of this zone as a resistance area. A break above this zone could trigger a substantial upward movement of 10% to 20%. Conversely, if the price remains below the 4H 100EMA, it could indicate a bearish continuation, potentially driving the price down to $0.00002000.
SHIB/BTC Chart Analysis
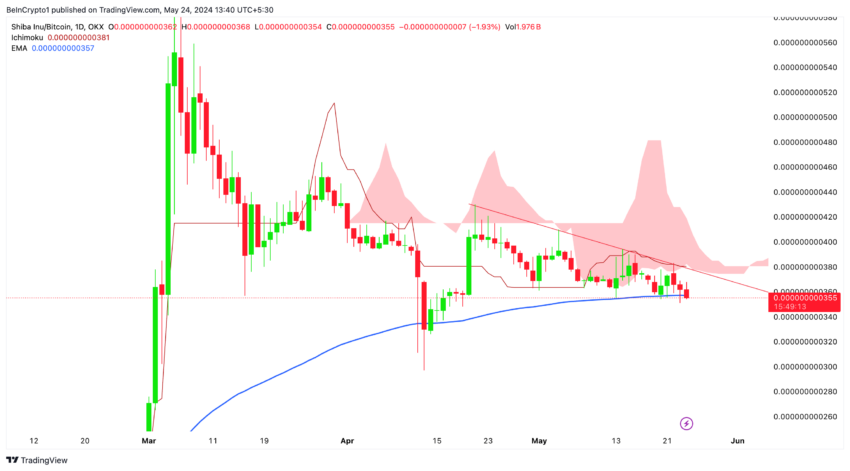
The SHIB/BTC chart also exhibits bearish signals for Shiba Inu.
SHIB/BTC has tested the lower boundary on the daily timeframe and is now attempting to break below the 100 EMA, signaling a highly bearish outlook for SHIB.
If SHIB enters the cloud to the upside and Bitcoin’s price appreciates to $70,000, SHIB could potentially break above the $0.0000265 price range. However, if these conditions are not met, the bearish outlook for SHIB may persist.
Recent Spike in Exchange Depositing Addresses: Bearish Implications
The chart shows a significant spike in the number of exchange depositing addresses at the end of May. This sudden increase suggests that many SHIB holders transfer their tokens to exchanges.
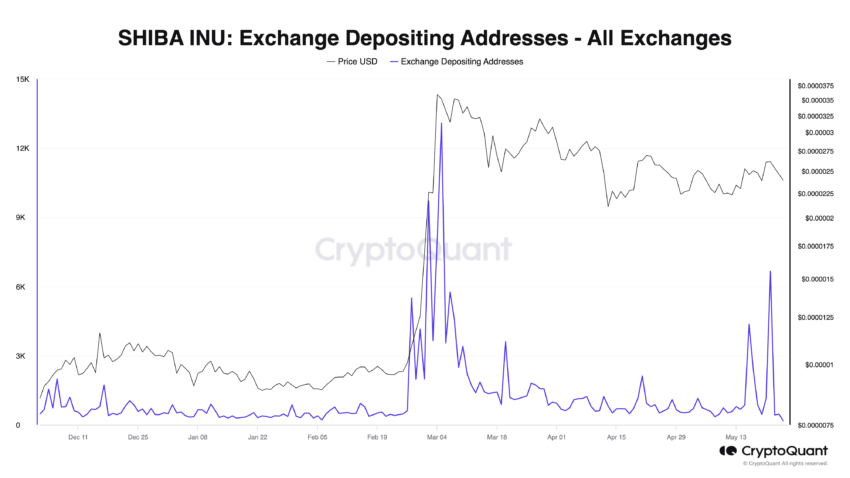
Potential Selling Pressure: Historically, increasing depositing addresses often precedes a sell-off. When holders move their tokens to exchanges, they typically liquidate their positions, creating selling pressure in the market.
Read More: Shiba Inu (SHIB) Price Prediction 2024/2025/2030
Bearish Implications: The recent spike indicates that more SHIB holders might be preparing to sell their assets. This influx of sell orders can increase supply on exchanges, potentially driving the price down if the demand does not match the supply.
Strategic Recommendations
Outlook: Bearish to Neutral
The current price action suggests a bearish trend, especially with the price attempting to break below the Ichimoku cloud in the four-hour timeframe.
The recent break below the 4H 100 EMA on the four-hour chart reinforces the bearish outlook. Monitor for further declines if the price fails to hold above key support levels, particularly the lower boundary of the 4H Ichimoku cloud.
The bearish outlook could be invalidated if SHIB manages to reenter the daily Ichimoku cloud. A key level to watch is the upper boundary of the daily Ichimoku cloud at $0.000265. A break above this level could shift the outlook to neutral or even bullish.
Disclaimer
In line with the Trust Project guidelines, this price analysis article is for informational purposes only and should not be considered financial or investment advice. BeInCrypto is committed to accurate, unbiased reporting, but market conditions are subject to change without notice. Always conduct your own research and consult with a professional before making any financial decisions. Please note that our Terms and Conditions, Privacy Policy, and Disclaimers have been updated.


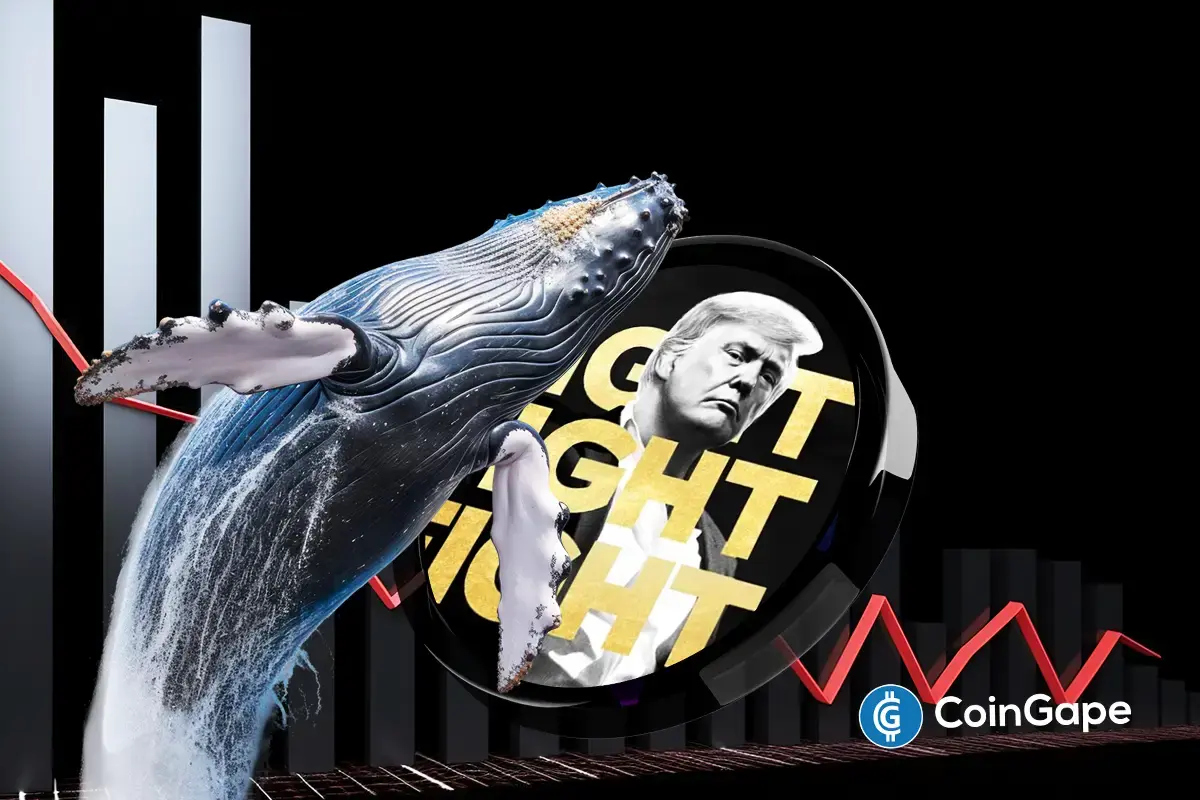

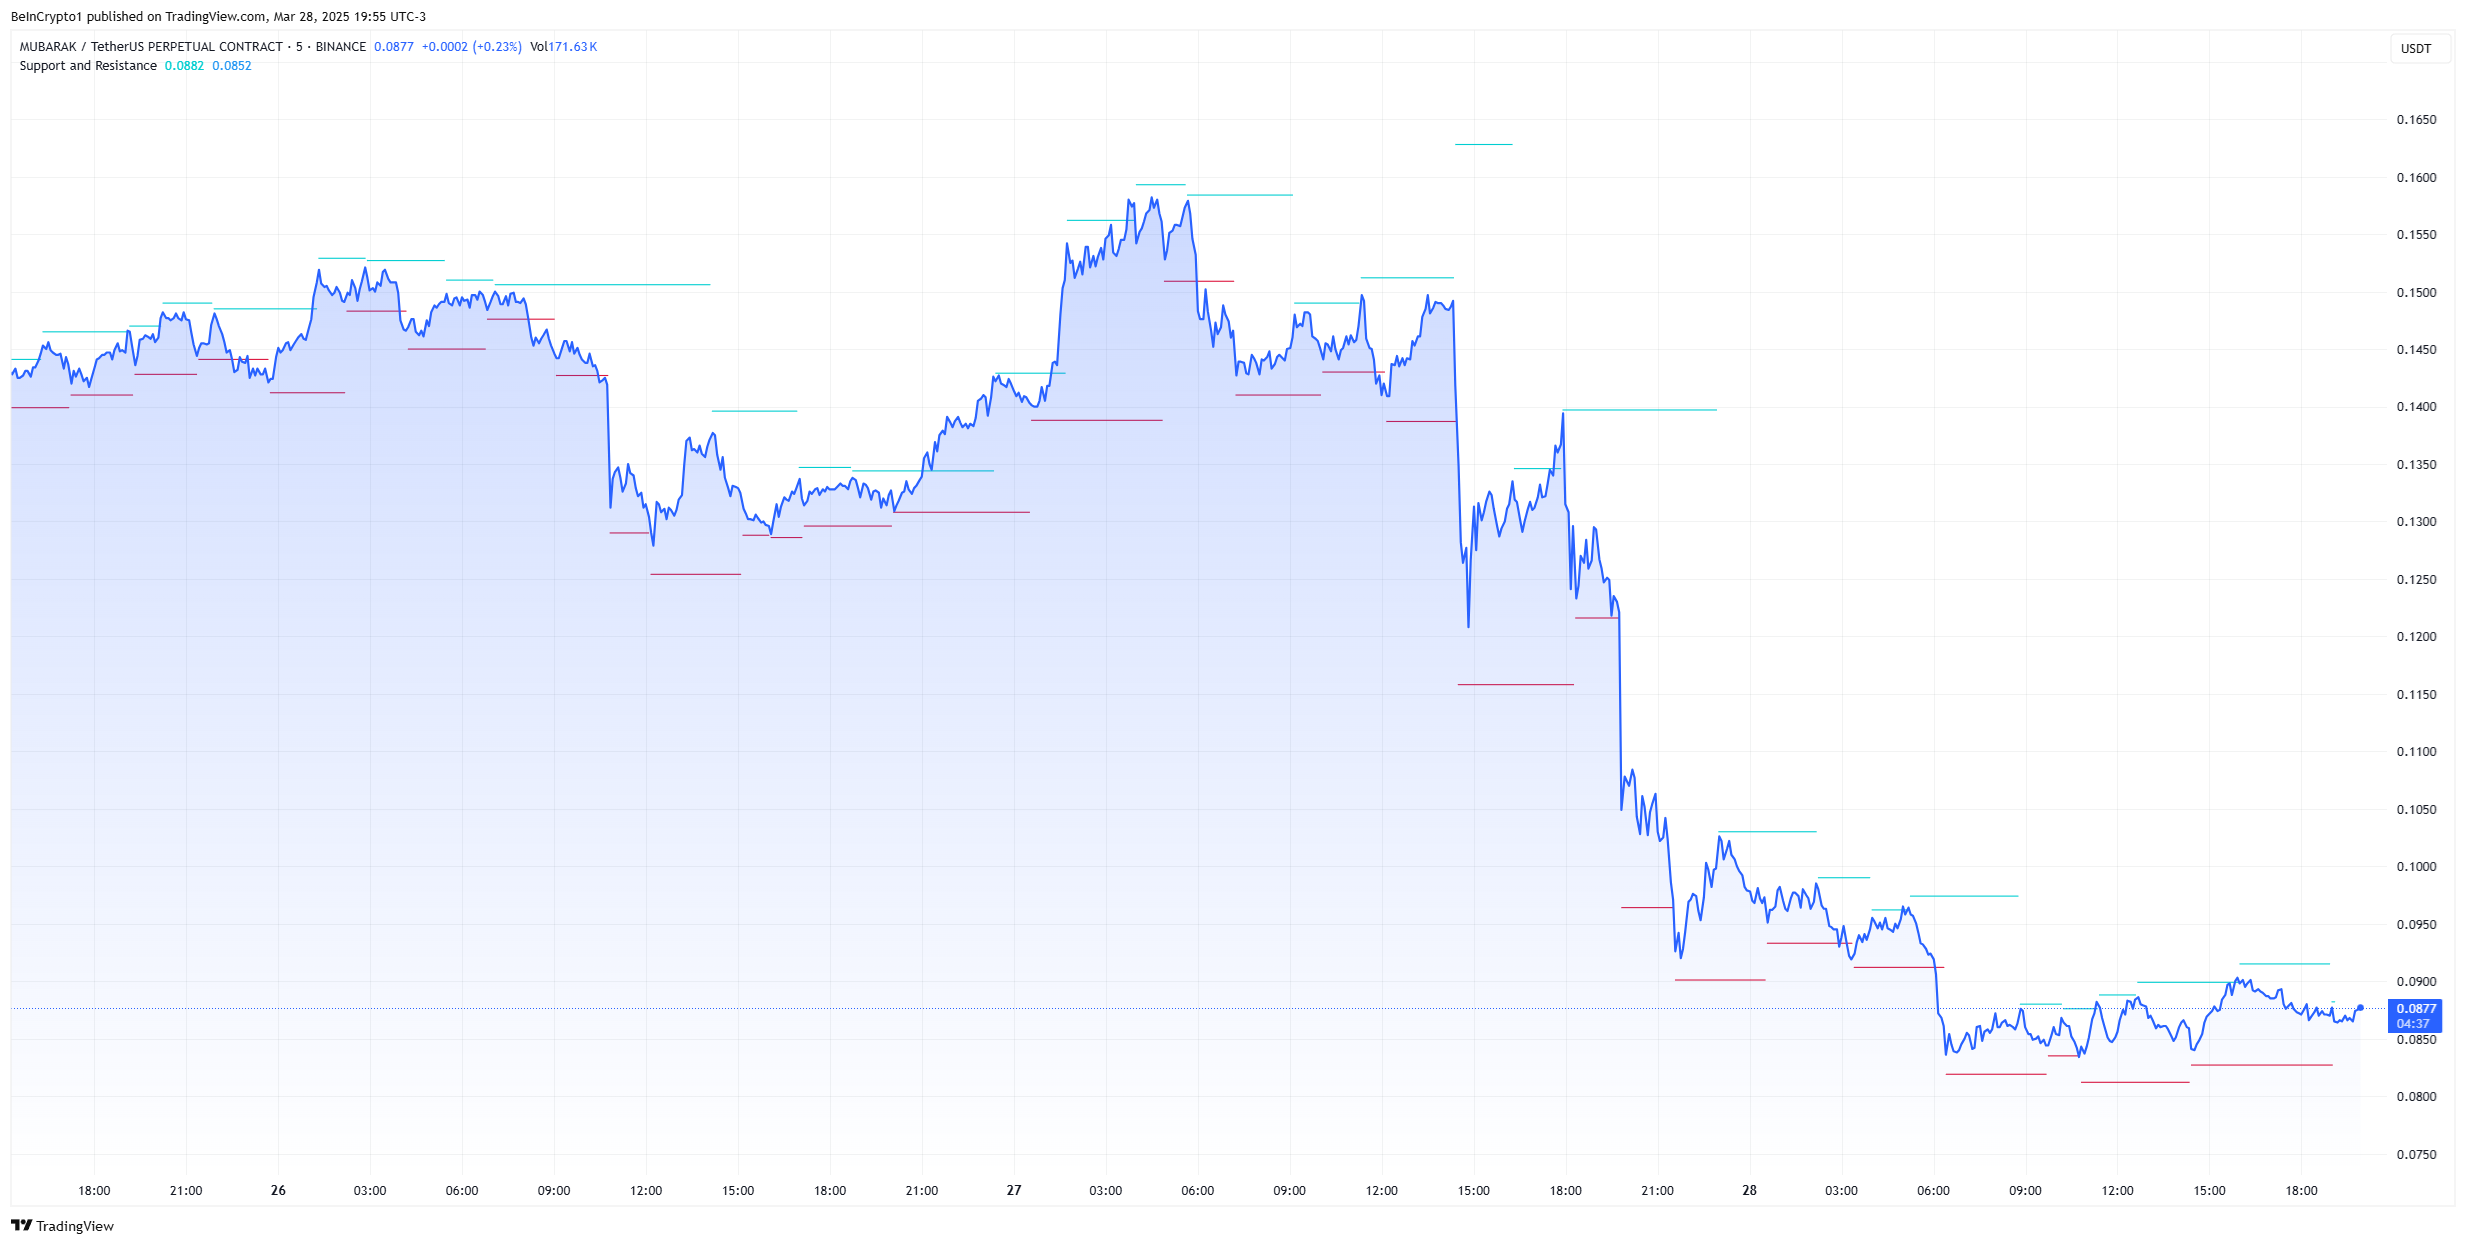
MUBARAK’s sharp 40% drop after its Binance listing has reignited debate around centralized exchange listing practices and the broader state of the meme coin ecosystem.
This came alongside growing scrutiny over speculative meme coin launches like JELLY, which recently triggered a short squeeze and dragged HYPE down, sparking fears of deeper structural risks.
The steep drop in MUBARAK, now down 40% since its Binance debut, has reignited concerns about the quality of recent listings on centralized exchanges. Binance recently ended its first listing vote, with BROCCOLI and Tutorial surging.
Critics argue that these incidents undermine trust in both DeFi and CEX platforms, as meme coins continue to dominate headlines while more stable crypto sectors struggle for attention.
Still, some platforms like Pump.fun are pushing for innovation, introducing features like token burning and revenue sharing in an effort to steer meme coins toward a more sustainable future.
These concerns have only grown louder following the listing of speculative meme coins on Binance, including BNB Chain tokens like JELLY, which have added to the scrutiny.
Binance founder Changpeng Zhao (CZ) has addressed this criticism, stating that token listings should not dictate long-term price action.
While listings can offer liquidity and improve market access, CZ emphasized that any price impact should be short-term. In the long run, token value should reflect real fundamentals—such as team commitment, development activity, and network performance.
Still, even as the community pushes for more transparency, Binance Alpha has continued to list controversial tokens, including two Studio Ghibli-themed meme coins.
Hyperliquid Crisis Made Users Question Meme Coins
MUBARAK’s drop was not the only crisis in the meme coin ecosystem this week. HYPE experienced a sharp decline following the JELLY short squeeze, triggering widespread speculation about the role of Hyperliquid and meme coins in the crypto ecosystem.
Some users have even questioned if this could be the beginning of an FTX-style collapse as concerns grow over the unchecked volatility tied to meme coin derivatives.
The JELLY controversy has ignited debate around the fragility of emerging platforms and whether enough safeguards are in place to prevent systemic fallout from meme-driven market events. In response to the backlash, Hyperliquid announced it would strengthen its security measures to prevent similar incidents in the future.
Jean Rausis, co-founder of the decentralized finance ecosystem SMARDEX, told BeInCrypto that the DeFi ecosystem needs to think about the image it sends to the market:
“If we want DeFi to be adopted, the ecosystem needs to gain trust not only with its existing users but also in terms of the image it presents in the news. And it’s clear that with projects wrongly labelling themselves as “decentralized”, more incidents like this will happen.”
Sectors Like RWA Could Help To Grow Crypto Credibility
Kevin Rusher, founder of decentralized lending protocol RAAC, described the situation as a major blow to DeFi’s credibility. “This is another setback for DeFi adoption, but it’s not a surprise,” he said, noting that meme coins have reignited retail greed and diverted liquidity away from more sustainable sectors of the ecosystem.
He warned that tokens like TRUMP and MELANIA had captured too much mindshare during the last market surge, leaving DeFi vulnerable to speculative chaos.
Still, Rusher pointed to the growing involvement of institutions like BlackRock as a sign of hope:
“But it looks like institutions and big players like BlackRock also understand this need for stability in crypto, which is why they are now seriously focused on the tokenization of Real World Assets (RWAs). The unfortunate reality is that memecoins are likely here to stay, and they will be a real obstacle for DeFi growth in the short term. However, with RWAs bringing huge liquidity into the system from traditional finance, this sector will finally have the opportunity to grow without memecoin frenzies putting the whole ecosystem in danger.” – Rusher told BeInCrypto.
More Innovation Could Bring Renewed Interest In Meme Coins
In a recent conversation with Bankless, PumpFun co-founder Alon Cohen shared insights about the meme coins market, highlighting PumpFun’s 4Chan-inspired aesthetic, bonding curve pricing model, and new creator-focused initiatives.
Pump.fun has generated over 8.8 million tokens and once peaked with a record $14 million in daily revenue, totaling $600 million since launch.
Alon emphasized that while the meme coin market is cooling—down nearly 49% from its $125 billion peak in December 2024—Pump.fun remains committed to supporting creative and community-driven projects.
To boost long-term sustainability, the team is now introducing revenue-sharing mechanisms for token creators, a transparent fee structure, and token-burning features to reduce the extractive nature of meme coin launches.
With new mechanisms like this, more buyers could come in, and a new generation of meme coin traders could emerge as the ecosystem tries to become more sustainable.
Disclaimer
In line with the Trust Project guidelines, this price analysis article is for informational purposes only and should not be considered financial or investment advice. BeInCrypto is committed to accurate, unbiased reporting, but market conditions are subject to change without notice. Always conduct your own research and consult with a professional before making any financial decisions. Please note that our Terms and Conditions, Privacy Policy, and Disclaimers have been updated.

Crypto whales bought Optimism (OP), Dogecoin (DOGE), and Worldcoin (WLD) in recent days. OP saw a rise in large holders despite being down 73% over the past year, while DOGE whale wallets climbed to a two-week high as meme coin sentiment shows signs of recovery.
WLD also attracted accumulation, even after a 19% drop in the last 30 days, with whales adding to their positions over the last four days. This shift in on-chain behavior suggests that some big players may be preparing for a potential rebound across these assets.
Optimism (OP)
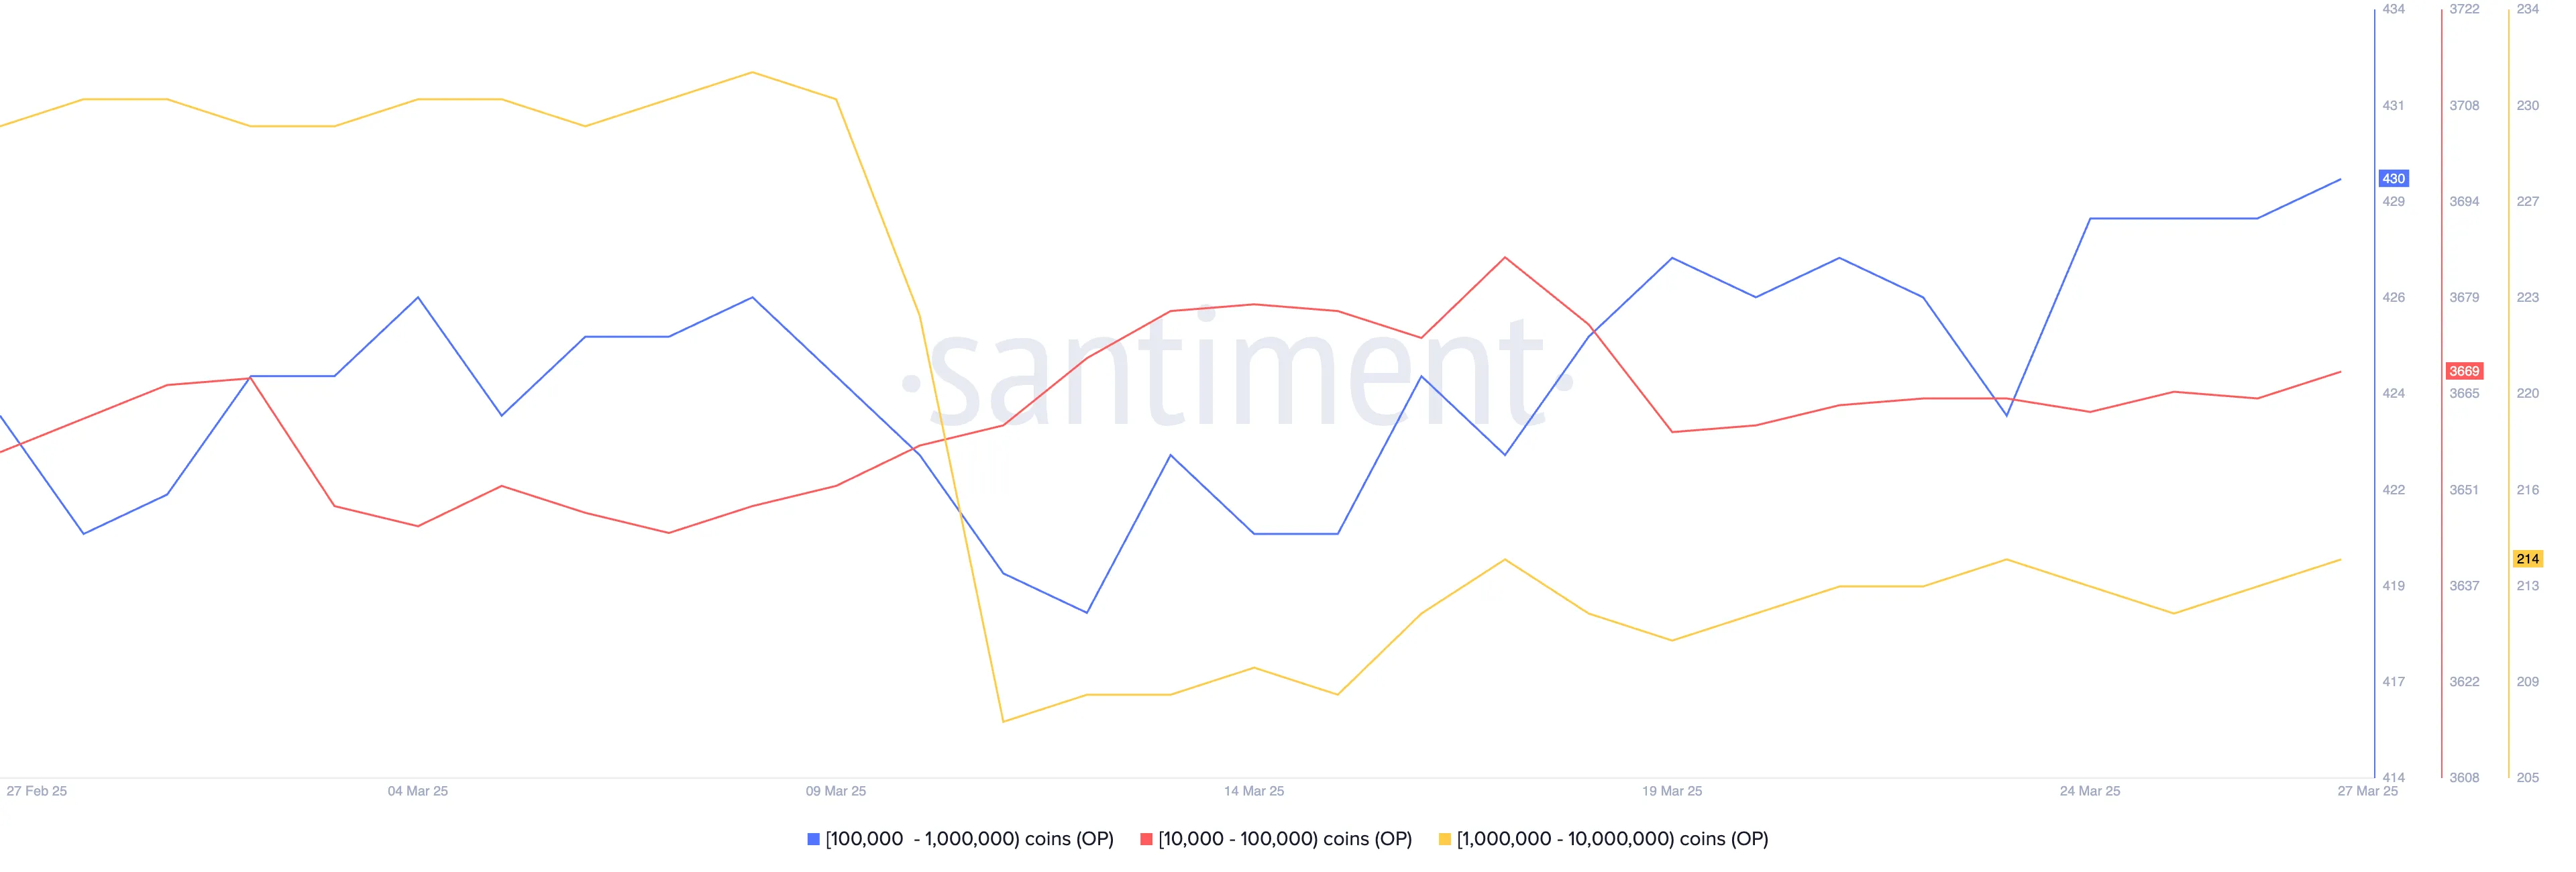
Despite Optimism experiencing a prolonged downtrend and a nearly 73% drop over the past year, on-chain data reveals a subtle but notable shift: the number of wallets holding at least 10,000 OP has increased from 4,303 to 4,313 in the last five days.
This uptick suggests that some larger investors may be accumulating OP at lower prices, potentially positioning for a long-term reversal.
While OP has struggled to gain traction this cycle—remaining below the $2 mark since early January—this quiet accumulation could be an early sign of growing confidence among more seasoned holders.
If this accumulation translates into renewed bullish momentum, OP may attempt to reclaim key resistance levels, starting with $0.93.
A successful breakout could lead to a push toward $1.06, and if buying pressure accelerates, $1.20 becomes a reasonable upside target.
On the flip side, if selling pressure remains dominant and no meaningful shift in momentum occurs, OP could continue its slide, with $0.74 acting as a key support level. A break below that could send the price below $0.70, reinforcing the downtrend and keeping investors cautious in the near term.
Dogecoin (DOGE)
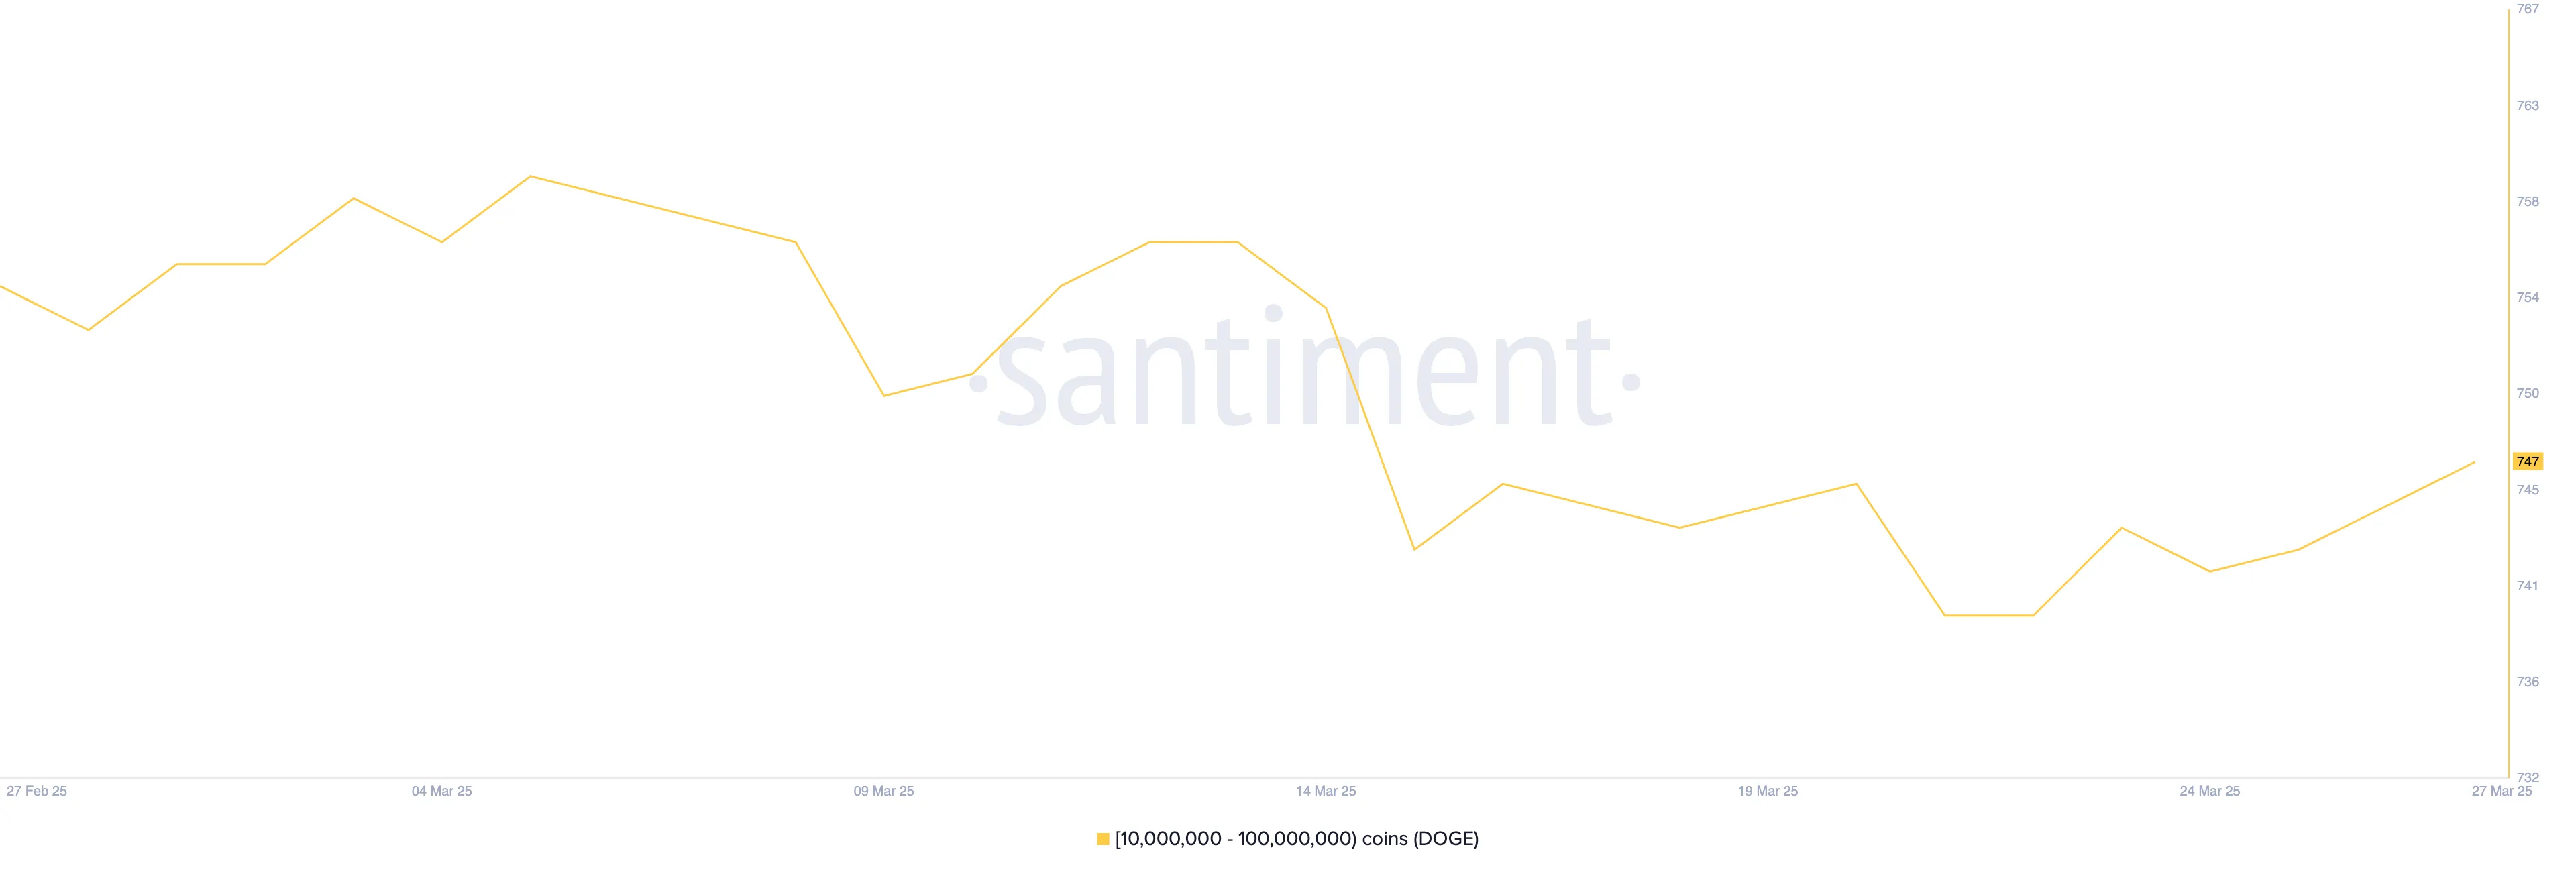
Dogecoin, the largest meme coin by market cap, is seeing renewed interest from large holders. On-chain data reveals that crypto whales bought DOGE over the past week.
Specifically, the number of wallets holding between 10 million and 100 million DOGE rose from 740 to 747—the highest level in two weeks.
This suggests that big players may be positioning ahead of a potential rebound in the meme coin space, anticipating a shift in market sentiment. With DOGE historically responding strongly to meme coin hype, this uptick in whale activity could be a key early signal.
If momentum builds and meme coins stage a broader recovery, DOGE could be one of the biggest beneficiaries. A bullish breakout could send the price to test resistance around $0.19, and if that level is broken, further gains toward $0.22 and even $0.24 may follow.
However, if the current market correction deepens, DOGE may retest support at $0.16, with a possible drop to $0.143 if selling pressure increases.
For now, whale accumulation offers a promising sign—but price direction will likely hinge on whether broader meme coin momentum returns.
Worldcoin (WLD)
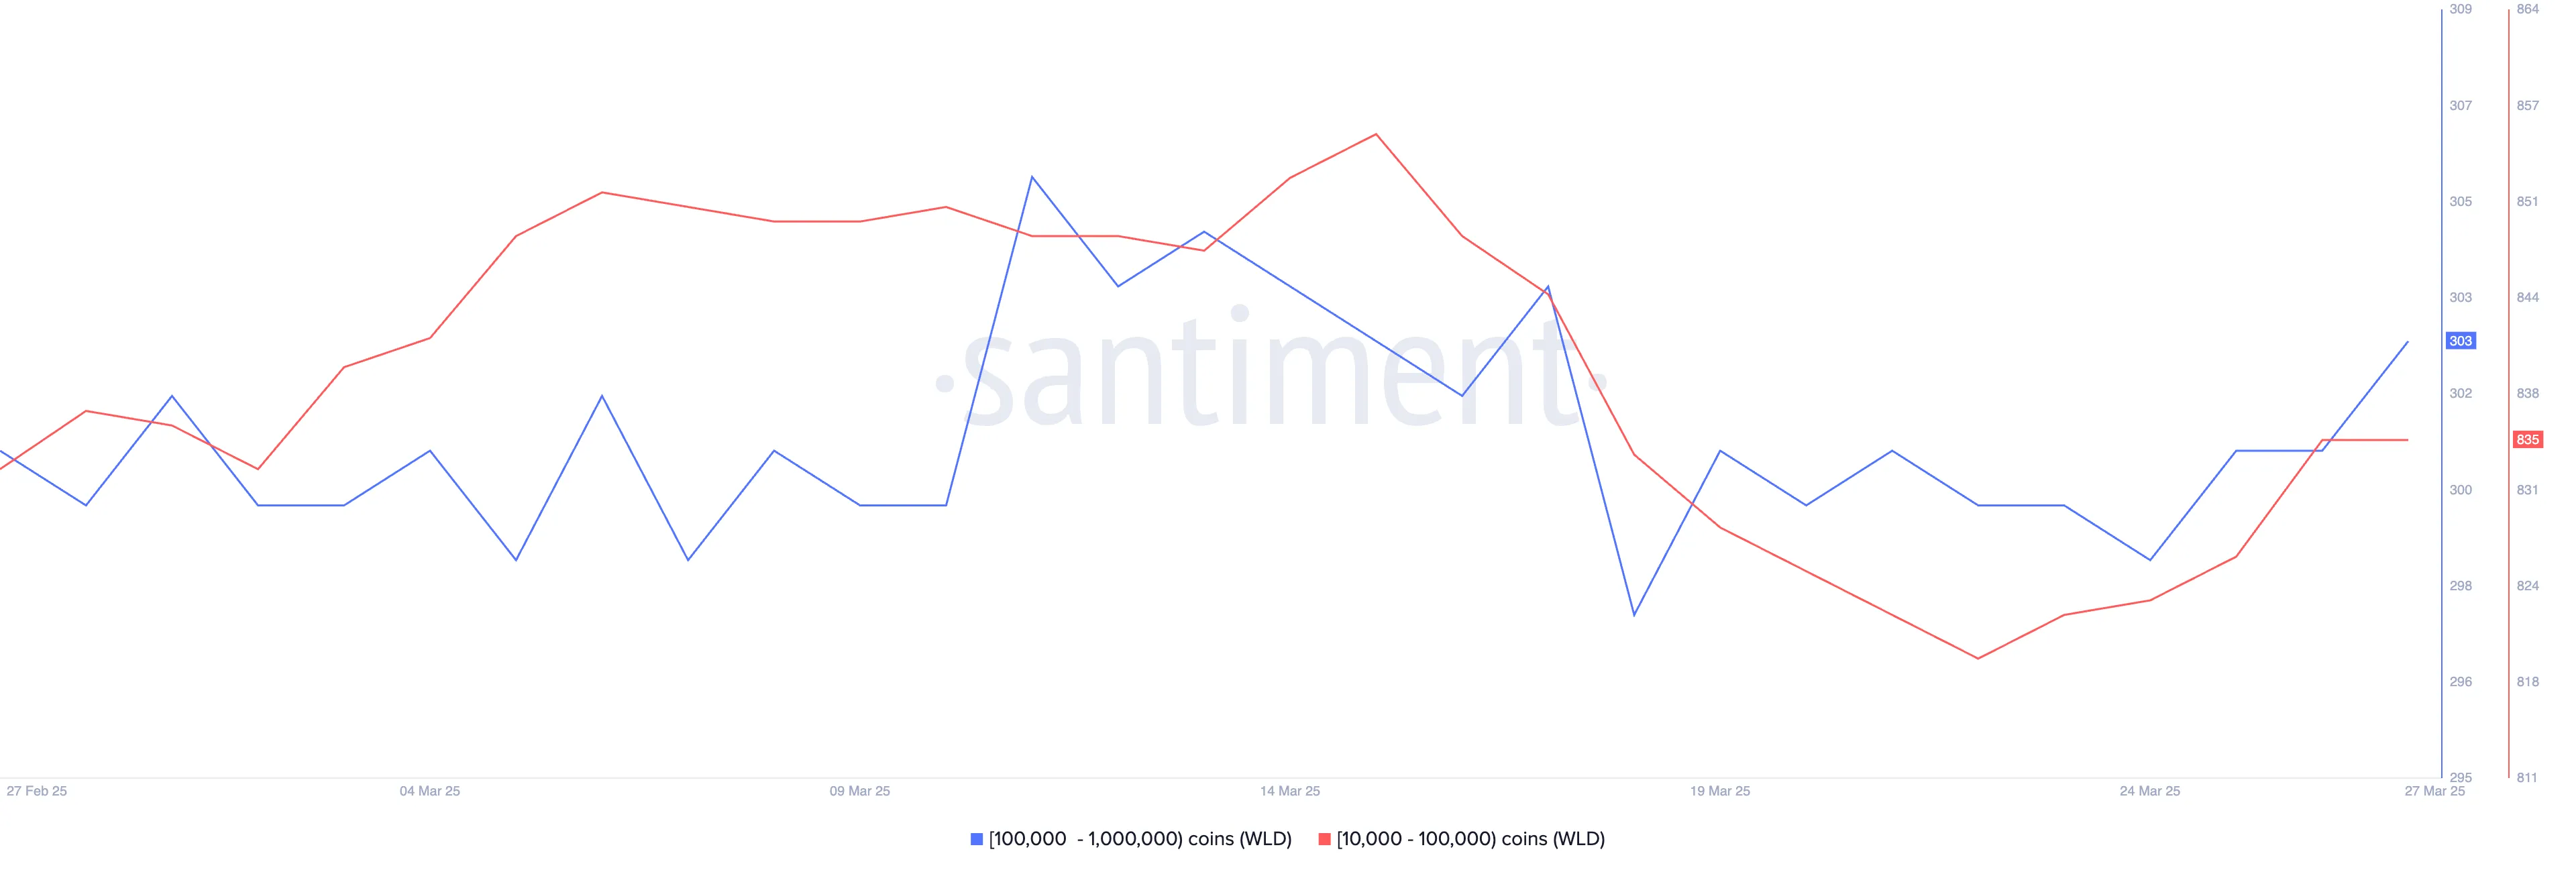
Worldcoin, once one of the most hyped AI-related cryptocurrencies, has struggled to maintain its momentum in recent months, with its price falling nearly 19% over the past 30 days.
Despite this decline, recent on-chain data shows that crypto whales have started accumulating WLD again. Over the last four days, the number of wallets holding between 10,000 and 1,000,000 WLD increased from 1,123 to 1,138.
This accumulation could signal growing confidence that WLD may soon find a bottom.
If buying momentum continues to build, WLD could attempt a short-term recovery. The first key resistance level is $0.91.
A breakout above that could fuel a stronger rally toward $1.25, helping Worldcoin regain some of its lost ground.
However, if bearish sentiment remains dominant, WLD may retest support at $0.80, and a break below that level could send it down further to $0.69.
Disclaimer
In line with the Trust Project guidelines, this price analysis article is for informational purposes only and should not be considered financial or investment advice. BeInCrypto is committed to accurate, unbiased reporting, but market conditions are subject to change without notice. Always conduct your own research and consult with a professional before making any financial decisions. Please note that our Terms and Conditions, Privacy Policy, and Disclaimers have been updated.
President Trump just issued a pardon for BitMEX’s three founders, who pled guilty to money laundering charges in 2022. Unlike the case of Ross Ulbricht, there was no popular movement for these pardons, sparking community confusion.
Since the pardons went out, Sam Bankman-Fried’s Polymarket odds of receiving a pardon have skyrocketed. However, this has also created a sense of unease, especially with the rampant scams and frauds in crypto today.
Trump Issues BitMEX Pardons
BitMEX is a centralized exchange with a long history in the crypto space, but it has faced its share of controversies. In 2020, it was sued in the US for alleged money laundering.
Its founders, Arthur Hayes, Benjamin Delo, and Samuel Reed, pled guilty to violating the Bank Secrecy Act, but President Trump just pardoned all three in a shocking move.
Trump did little to publicize these pardons, as neither he nor any of the recipients have yet made a public statement regarding the move. These men only faced fines, probation, and house arrest, and all were completely free at the time. Arthur Hayes remains an influential commentator, but he has no further involvement with BitMEX.
To call this move unexpected would be an understatement. Trump has given other crypto-related pardons, like with Ross Ulbricht, to be fair.
However, Ulbricht’s case was a cause célèbre in the community. There were no corresponding vocal calls to issue BitMEX pardons, especially considering the founders’ light sentences.
In short, most of the crypto space’s reactions have been negative. At the time, even government crypto allies like “Crypto Mom” Hester Peirce supported the BitMEX arrests, and money laundering has never been popular in the space. The crypto community is struggling to find a clear motivation for Trump’s pardons other than outright corruption.
“My God, everything is for sale. I think he’ll pardon Sam Bankman-Fried,” said author Jacob Silverman.
For the last few months, FTX mastermind Sam Bankman-Fried and his family have been lobbying President Trump for a pardon. The community mostly considered this possibility a long shot, especially because Bankman-Fried directly opposed Trump in the 2020 election. Since the BitMEX pardons, Bankman-Fried’s Polymarket odds have shot up:
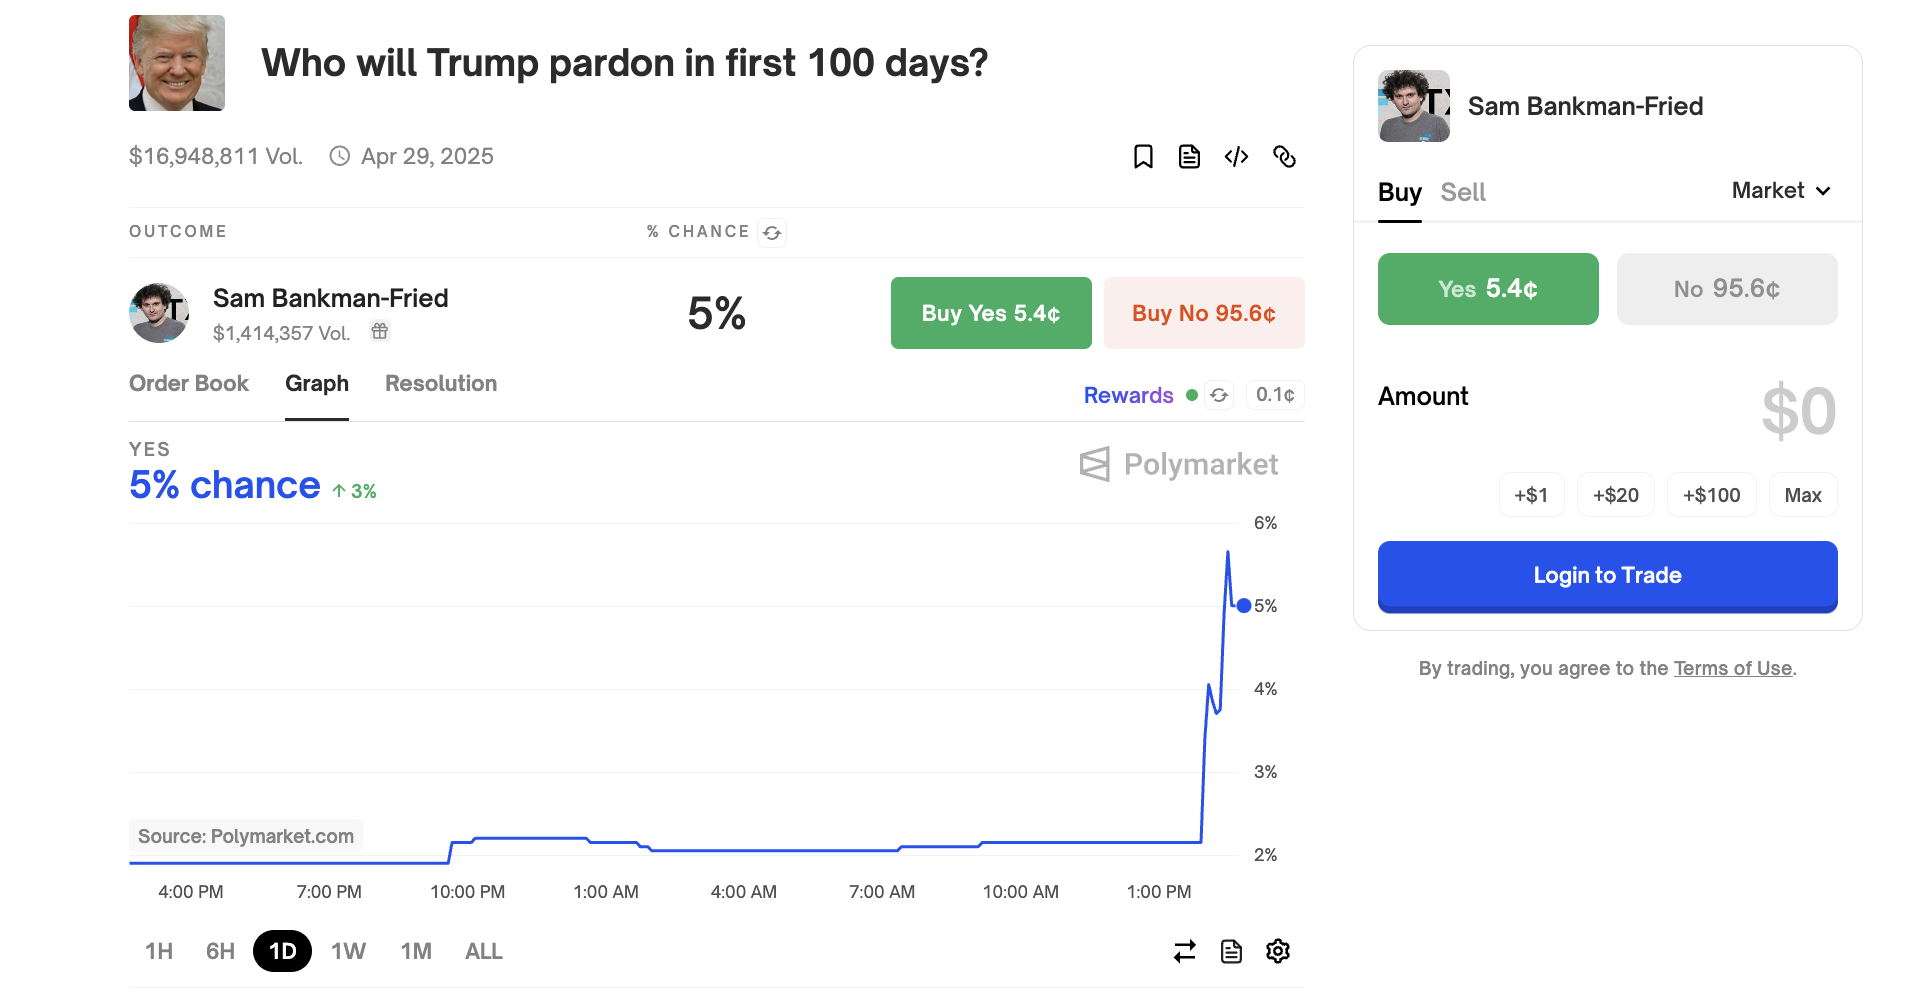
In short, it doesn’t even look like this will be bullish for the markets. The crypto industry is in an unprecedented wave of scams, and some commentators worry that it could damage industry confidence. If Trump continues issuing pardons without a clear reason, it may embolden bad actors.
Disclaimer
In adherence to the Trust Project guidelines, BeInCrypto is committed to unbiased, transparent reporting. This news article aims to provide accurate, timely information. However, readers are advised to verify facts independently and consult with a professional before making any decisions based on this content. Please note that our Terms and Conditions, Privacy Policy, and Disclaimers have been updated.

Analyst Reveals Bullishness On Ethereum Price At This Point, Can It Hit $4,000 Again?

Why Did MUBARAK Drop 40% Despite Binance Listing?
Crypto Whales Bought These 3 Coins Recently

Trump Pardons BitMEX Founders, Sparking Community Unease

Ethereum Price Hits 300-Week MA For The Second Time Ever, Here’s What Happened In 2022

US SEC Drops Charges Against Hawk Tuah Girl Hailey Welch

2.52 Million Altcoins Are Ruining Crypto’s Future

Animoca Brands Valuation Tanks 75% In Two Years, Here’s Why

Crypto exchange BingX hacked for $43 million

Are The Big Players Losing Interest?

Hong Kong’s Securities Association Tips Authorities On Crypto Self-Regulation

Coinbase cbBTC Set to go Live on Solana
2.52 Million Altcoins Are Ruining Crypto’s Future
Animoca Brands Valuation Tanks 75% In Two Years, Here’s Why
Crypto exchange BingX hacked for $43 million
Are The Big Players Losing Interest?
Hong Kong’s Securities Association Tips Authorities On Crypto Self-Regulation
Coinbase cbBTC Set to go Live on Solana
-
 Market21 hours ago
Why BTC Price Stayed Unchanged
-

 Market20 hours ago
Bitcoin Price Stalls at $88K—Can Bulls Overcome Key Resistance?
-
 Bitcoin24 hours ago
Bitcoin Bet Grows Bigger: The Blockchain Group Snaps Up 580 BTC
-

 Market23 hours ago
HyperLiquid Responds to JELLY Crisis Amid Community Backlash
-

 Market22 hours ago
Binance Alpha Lists Ghibli Meme Coins Amid ChatGPT Hype
-
 Altcoin22 hours ago
Dogecoin Cup And Handle Pattern Signals Recovery To $0.4, Here’s How
-
 Market19 hours ago
Pi Network Integrates With Telegram’s Crypto Wallet
-

 Market18 hours ago
Ethereum Price Struggles—Is Another Breakdown on The Horizon?