
Market
Polkadot (DOT) Bearish Trends Amid Declining Interest

Polkadot (DOT) faces bearish price trends with nearly a 50% decline from the local high of $12.
Analyzing Key Indicators Such as Total Open Interest and Social Dominance.
Technical Analysis of Polkadot
The price of DOT has once again rejected the Ichimoku Cloud and is currently testing the Ichimoku Baseline in red, which aligns with the lower boundary of the Ichimoku Cloud. The trading price stands at $6.45.
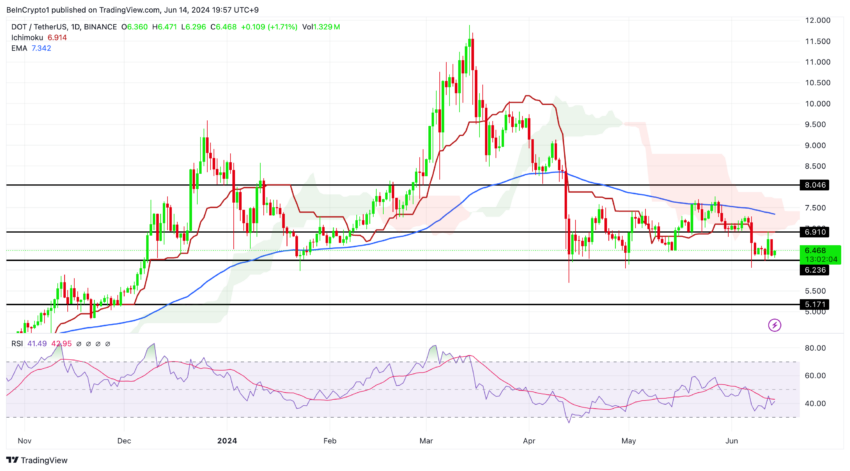
The RSI trend indicates a downward movement, with the 14-day simple moving average (SMA) of the RSI reflecting this bearish momentum. Recently, the RSI has been trending towards the oversold territory, nearing the critical level of 30. This downward trend points to increasing selling pressure and potential further declines in price if the RSI falls below 30.
The 4-hour chart highlights crucial resistance and support zones. The price recently fell below the 4-hour Ichimoku Cloud, indicating a bearish trend in this timeframe. The $6.23 price level has emerged as significant support.
Read More: What Is Polkadot (DOT)?
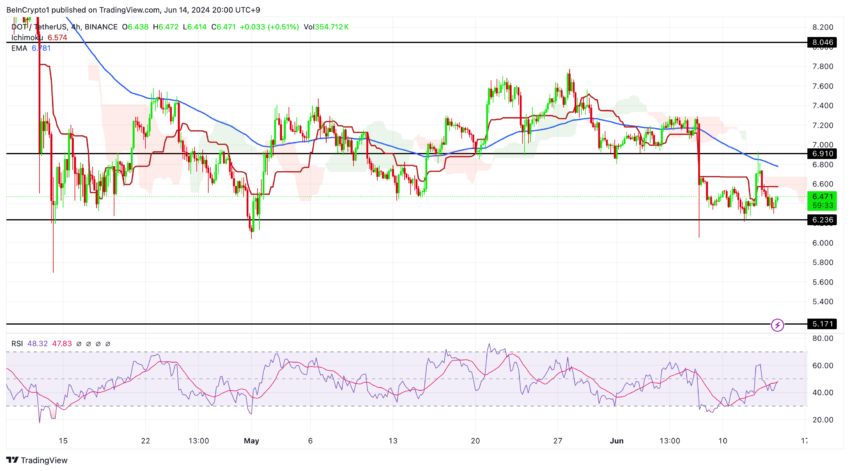
If DOT drops below this support level, it could signal a continuation of the bearish trend. Conversely, if the price climbs above the Ichimoku Cloud and the red baseline of the 4-hour Ichimoku Cloud, it could suggest a trend reversal and a potential shift to a bullish outlook.
DOT Total Open Interest: Understanding the Bearish Trends
From June 1 to June 13, the total open interest in USD for DOT across all exchanges showed a notable decline. Open interest was relatively higher on June 1 but began a downward trend, indicating reduced trading activity and interest.
By June 13, open interest had decreased significantly, suggesting potential market uncertainty or a reduction in speculative positions. This trend aligns with the broader price action observed during the same period, indicating a bearish sentiment among traders.
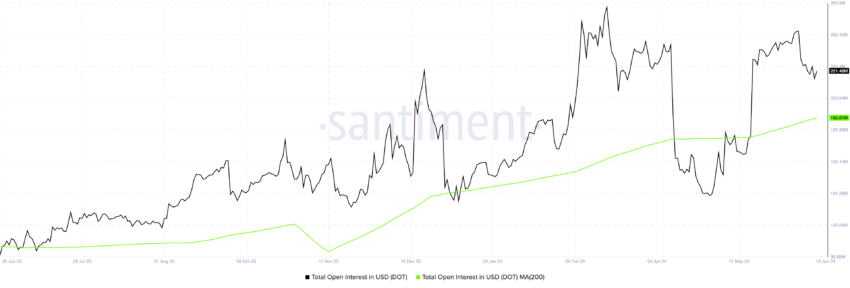
The correlation between Polkadot’s price and total open interest in USD from May 14 to June 14, 2024, is approximately 0.44. This positive correlation suggests a relationship between these two variables. Indicating that as open interest increases, Polkadot’s price tends to rise as well.
This relationship highlights that growing market participation and investment interest in Polkadot often accompanies an upward movement in its price. However, the correlation is not strong, implying that other factors significantly influence Polkadot’s price movements.
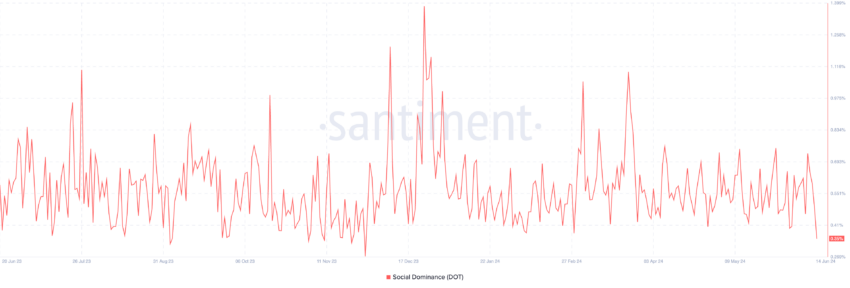
Social dominance peaked at 0.7537 on May 27, a 64.56% increase from 0.4579 on May 14. This rise indicates heightened community interest and engagement. Social interest sharply declined by 53.92% to 0.3474 by June 13.
This aligns with the price drop and suggests waning social media activity or interest in DOT.
Read More: 5 Best Polkadot (DOT) Wallets To Consider In 2024
Polkadot is approaching a critical support level at $6.23. If the price breaks below this level, it could signal a continuation of the bearish trend. Conversely, if the price reverts and moves above the 4-hour Ichimoku Cloud, it might indicate a potential shift in outlook.
The social dominance clearly highlights the current bearish trend that Polkadot is facing, reflecting a noticeable decline in interest from social media users regarding cryptocurrency.
Technical analysis highlights that a confirmed bullish trend will require the price to enter the daily Ichimoku Cloud and break above the daily Ichimoku Baseline.
Disclaimer
In line with the Trust Project guidelines, this price analysis article is for informational purposes only and should not be considered financial or investment advice. BeInCrypto is committed to accurate, unbiased reporting, but market conditions are subject to change without notice. Always conduct your own research and consult with a professional before making any financial decisions. Please note that our Terms and Conditions, Privacy Policy, and Disclaimers have been updated.


Reason to trust
![]()
Strict editorial policy that focuses on accuracy, relevance, and impartiality
Created by industry experts and meticulously reviewed
The highest standards in reporting and publishing
Strict editorial policy that focuses on accuracy, relevance, and impartiality
Morbi pretium leo et nisl aliquam mollis. Quisque arcu lorem, ultricies quis pellentesque nec, ullamcorper eu odio.
XRP has been trading under pressure in recent weeks, losing much of the momentum it built during its late 2024 to early 2025 rally. After reaching highs above $3.40, the asset has experienced an 18.3% decline over the past month, reflecting broader market softness.
At the time of writing, XRP trades significantly below its peak at a price of $2.06, with subdued investor activity and falling market participation across both spot and derivatives markets.
Related Reading
XRP On-Chain Activity Slows, But Price Remains Relatively Stable
Amid XRP’s decline, a CryptoQuant analyst known as EgyHash has recently shared his analysis on the altcoin in a post titled, “XRP’s Market Paradox: With Ledger Activity Dipping 80%, Is a Rebound on the Horizon?”
According to EgyHash, XRP’s on-chain and futures market data presents a mixed picture—declining activity but resilience in price. EgyHash noted that XRP Ledger activity has fallen sharply since December, with the percentage of active addresses down by 80%.
Similar declines have been observed in the futures market, where open interest has dropped roughly 70% from its highs, and funding rates have occasionally turned negative.

He added that the Estimated Leverage Ratio, which gauges average user leverage by comparing open interest to coin reserves, has also dropped significantly.
Despite these indicators pointing to weakening momentum, the altcoin’s price has only declined about 35% from its peak. This is a milder correction compared to other assets such as Ethereum, which has fallen roughly 60% over the same period.
Additionally, the altcoin’s Exchange Reserve has continued to decline, reaching levels last observed in July 2023. Lower reserves typically suggest that fewer tokens are available for immediate sale, a factor that can help support prices during market downturns.

According to EgyHash, this trend, along with relatively stable pricing, could indicate growing long-term confidence in the asset.
Institutional Developments Could Strengthen Market Sentiment
While on-chain metrics remain a focus, institutional developments may also play a role in shaping XRP’s future trajectory. Hong Kong-based investment firm HashKey Capital recently announced the launch of the HashKey XRP Tracker Fund—the first XRP-focused investment vehicle in Asia.
Backed by Ripple as the anchor investor, the fund is expected to transition into an exchange-traded fund (ETF) in the future. The initiative is designed to attract more institutional capital into the XRP ecosystem.
HashKey Capital is launching Asia’s first XRP Tracker Fund—with @Ripple as an early investor.
This marks a major step in expanding institutional access to XRP, the third-largest token by market cap. 🧵👇
— HashKey Capital (@HashKey_Capital) April 18, 2025
HashKey Capital has also indicated that this collaboration with Ripple could lead to further projects, including tokenized investment products and decentralized finance (DeFi) solutions.
Related Reading
Vivien Wong, a partner at HashKey, emphasized the strategic value of integrating Ripple’s network with regulated investment infrastructure across Asia.
Although the altcoin faces near-term pressure, long-term developments, including decreasing exchange reserves and rising institutional interest, may support its recovery as the broader market stabilizes.
Featured image created with DALL-E, Chart from TradingView


In an engaging session during Paris Blockchain Week, BeInCrypto caught up with Petrix Barbosa, the innovative mind behind Matchain, a blockchain venture that’s reshaping how digital identity and data sovereignty are approached.
Barbosa, who transitioned from a successful career as a venture capitalist, where he managed investments across 250 projects, brings a wealth of experience and a unique perspective to the blockchain landscape. Petrix Barbosa’s insights reveal a compelling vision for the future of blockchain, focusing on user empowerment and innovative use of technology to solve enduring problems in digital identity and data management.
Petrix Barbosa Discusses Matchain and its Mission
Matchain is a layer 2 blockchain platform that primarily addresses the challenges of identity and data sovereignty. Our mission is to empower users by giving them control over their digital identities and data, thus ensuring that they’re the primary beneficiaries of their online presence.
Barbosa on His Pivot from Venture Capital
In my time as an investor, I witnessed many great ideas fail to reach their potential due to the lack of a substantial user base or poor market timing. This inspired me to transition from funding projects to creating a platform that not only serves my vision but also provides tangible solutions to widespread issues in the blockchain community—primarily, user engagement and application.
Matchain’s Innovations in the Area of Identity Sovereignty
Matchain introduces a novel approach to managing digital identity. Unlike traditional models where user data is siloed across various platforms, Matchain allows users to have a single digital identity that spans across both Web2 and Web3. This is crucial for enabling a seamless transition and interaction between these two worlds.
How Matchain Integrates Existing Web2 Infrastructure
Our platform acts as a bridge between the decentralized ecosystem of Web3 and the more traditional Web2 infrastructure. By allowing users to manage their digital identities across both platforms, we facilitate a smoother interaction that enhances user experience while maintaining high security and trust.
Future Developments From Matchain
Looking ahead, we aim to expand our user base significantly. Currently, we are backed by strategic partnerships, like the one with Paris Saint-Germain, which not only broadens our exposure but also integrates our technology into mainstream applications.
In the next two years, we plan to onboard millions of users, leveraging our innovative solutions to enhance their digital interactions.
Barbosa on Unique Challenges in Developing Matchain
The biggest challenge was shifting the focus from simply creating a blockchain solution to ensuring it was user-centric and capable of addressing real-world problems. This involved integrating AI to manage and analyze data effectively, ensuring that our platform could deliver personalized and contextually relevant experiences to users.
Matchain Over the Next Five Years
In five years, I envision Matchain at the forefront of blockchain technology, leading the charge in digital identity management and data sovereignty. Our platform will likely become a critical tool for users and companies looking to navigate the complexities of the digital age securely and efficiently.
Disclaimer
In compliance with the Trust Project guidelines, this opinion article presents the author’s perspective and may not necessarily reflect the views of BeInCrypto. BeInCrypto remains committed to transparent reporting and upholding the highest standards of journalism. Readers are advised to verify information independently and consult with a professional before making decisions based on this content. Please note that our Terms and Conditions, Privacy Policy, and Disclaimers have been updated.

Content Coins are a new trend gaining attention in the crypto space, especially on Base. They are positioned as digital content with value driven by culture and virality. Supporters see them as a new form of expression.
Critics say they’re just meme coins with a different name. Base is pushing the idea forward, hoping it helps the chain stand out from the rest.
Are Content Coins Really Different From Meme Coins?
Content coins are a new concept gaining traction within crypto communities, especially on Base chain. According to Base founder Jesse Pollak, a content coin “represents a single piece of content,” with the core idea being that the coin is the content and the content is the coin — no more, no less.
These tokens are often created in a specific context, either on platforms like Zora.
Essentially, creators design them to function as standalone pieces of digital content, driving the token’s value through cultural impact, virality, or meme-worthiness—rather than any utility or fundamental backing.

Despite the growing popularity of the term, not everyone is convinced. User Kash (@kashdhanda) dismissed the label, saying, “contentcoins are a silly name for memecoins”. He also pointed out that “memecoins are actually closer to financial content than they are to finance.”
David Tso (@davidtsocy), who works at Base, brings a more supportive spin, comparing content coins to “Instagram posts and TikToks that show their value in real time.”
Is Base Is For Everyone Just Another Meme Coin?
Base is for everyone was the first content coin officially launched and promoted by Base. It made an explosive debut, with a market cap nearing $18 million within its first few hours.
Shortly after its peak, the token plummeted nearly 75%. Since then, it has shown signs of recovery, with its market cap now hovering around $9.6 million.
The coin has gained significant traction in terms of activity, currently boasting nearly 21,000 holders, over 29,000 transactions in the last 24 hours, and a daily trading volume close to $9 million.

Base is using this momentum to push a broader narrative: that all content should live on-chain. Base is actively leveraging this philosophy, framing content coins as a new form of internet-native expression where each token represents a piece of digital culture stored permanently on the blockchain.
Yet, despite this push, Base is for everyone remains the only content coin to break out meaningfully—most others haven’t crossed the $100,000 market cap threshold. While the concept aims to separate itself from typical meme coins by embedding value in cultural relevance rather than pure speculation, many remain unconvinced.
Critics argue that content coins are merely meme coins in new packaging. Still, if the trend takes off, it could position Base to outperform other chains like Solana. It would do this by capturing this narrative and driving unique user activity to its ecosystem.
Disclaimer
In line with the Trust Project guidelines, this price analysis article is for informational purposes only and should not be considered financial or investment advice. BeInCrypto is committed to accurate, unbiased reporting, but market conditions are subject to change without notice. Always conduct your own research and consult with a professional before making any financial decisions. Please note that our Terms and Conditions, Privacy Policy, and Disclaimers have been updated.
Chainlink Price To Hit $26 If LINK Breaks Past This Crucial Level

Despite an 18% Drop, XRP’s Exchange Supply Hits Lows—Bullish Setup Ahead?

Lorenzo Protocol (BANK) Price Rallies 150% After This Binance Announcement

Matchain’s Petrix Barbosa Talks the Future of Digital Identity

Base Launches Strong, But Content Coins Draw Doubt

Pi Network, Grayscale’s Altcoin Shake-Up

2.52 Million Altcoins Are Ruining Crypto’s Future

Animoca Brands Valuation Tanks 75% In Two Years, Here’s Why

Crypto exchange BingX hacked for $43 million

Are The Big Players Losing Interest?

Hong Kong’s Securities Association Tips Authorities On Crypto Self-Regulation

Coinbase cbBTC Set to go Live on Solana
2.52 Million Altcoins Are Ruining Crypto’s Future
Animoca Brands Valuation Tanks 75% In Two Years, Here’s Why
Crypto exchange BingX hacked for $43 million
Are The Big Players Losing Interest?
Hong Kong’s Securities Association Tips Authorities On Crypto Self-Regulation
Coinbase cbBTC Set to go Live on Solana
-

 Market24 hours ago
Bitcoin Price Gears Up for Next Leg Higher—Upside Potential Builds
-
 Altcoin18 hours ago
Ethereum ETFs Record $32M Weekly Outflow; ETH Price Crash To $1.1K Imminent?
-

 Market10 hours ago
Pi Network Roadmap Frustrates Users Over Missing Timeline
-

 Market9 hours ago
Solana (SOL) Price Rises 13% But Fails to Break $136 Resistance
-
 Market22 hours ago
100 Million Tokens Could Trigger Decline
-

 Market20 hours ago
Why Relying on TVL Could Mislead Your DeFi Strategy
-

 Market19 hours ago
CZ’s Plan to Streamline BNB Staking Could Boost DeFi
-

 Market11 hours ago
MEME Rallies 73%, BONE Follows