
Market
Onyxcoin (XCN) Drops 40% In March as Bears Take Over

Onyxcoin (XCN) has been under significant selling pressure, correcting by 9.4% over the last seven days and plunging by 43% in the past 30 days.
The downtrend has left XCN struggling to regain its footing as technical indicators continue to point toward a bearish market structure. Despite short-lived attempts at recovery, the asset has remained weighed down by persistent bearish momentum.
Onyxcoin RSI Has Been Below 50 For Almost 5 Days
Onyxcoin RSI is currently sitting at 41.09, marking a decline from yesterday’s level of 47.95. This drop indicates that bearish momentum has been gaining ground over the past 24 hours, pushing the RSI further away from the neutral 50 mark.
Since March 15, XCN’s RSI has remained consistently below 50, signaling that the asset has been under persistent selling pressure.
The continued weakness reflected in the RSI suggests that bulls are struggling to regain control, keeping the price in a bearish or consolidative phase.
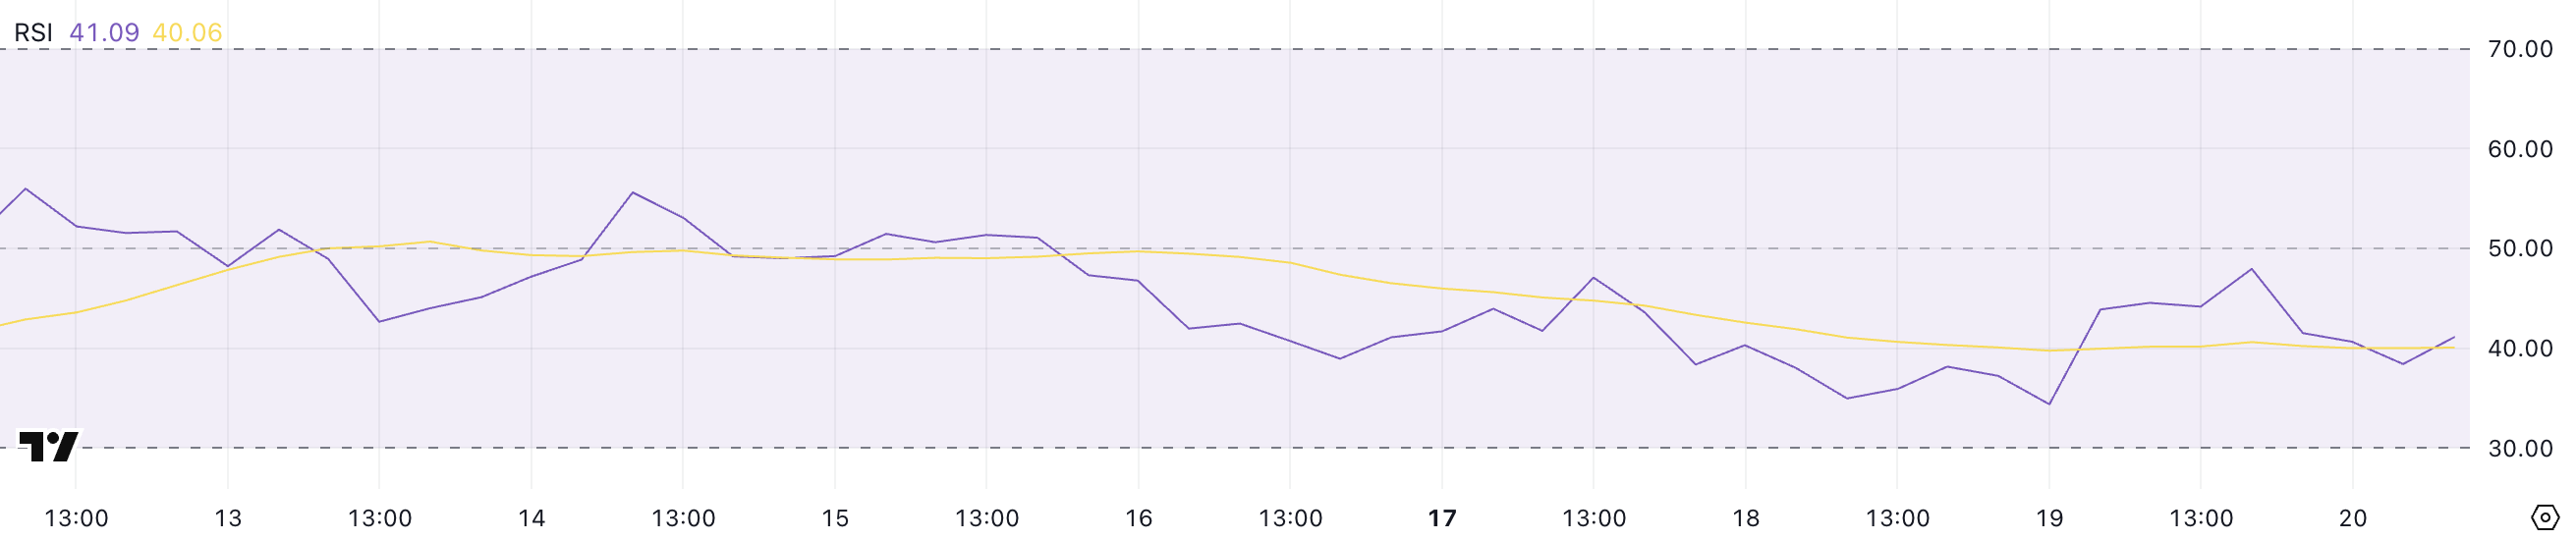
The RSI (Relative Strength Index) is a momentum oscillator that measures the speed and magnitude of recent price changes to evaluate overbought or oversold conditions.
Typically, an RSI above 70 signals that an asset might be overbought and due for a pullback, while an RSI below 30 indicates that the asset could be oversold and might see a bounce. With XCN’s RSI at 41.09 and stuck below 50 for several days, it suggests the market remains tilted toward bearish sentiment.
While it’s not yet in oversold territory, the ongoing sub-50 readings highlight the lack of bullish momentum and could imply continued sideways or downward movement unless buyers step in to reverse the trend.
XCN BBTrend Shows Selling Pressure Is Still Here
Onyxcoin BBTrend is currently at -9.5 and has remained in negative territory for the past two days, signaling a bearish environment.
Earlier, on March 17, BBTrend briefly turned positive at 0.83 but failed to sustain upward momentum, quickly reverting back below zero. This inability to maintain positive readings suggests that bullish attempts have been weak and short-lived, reinforcing the notion that sellers continue to dominate the market.
The deepening negative value of the BBTrend reflects ongoing pressure on XCN’s price, keeping it under strain.
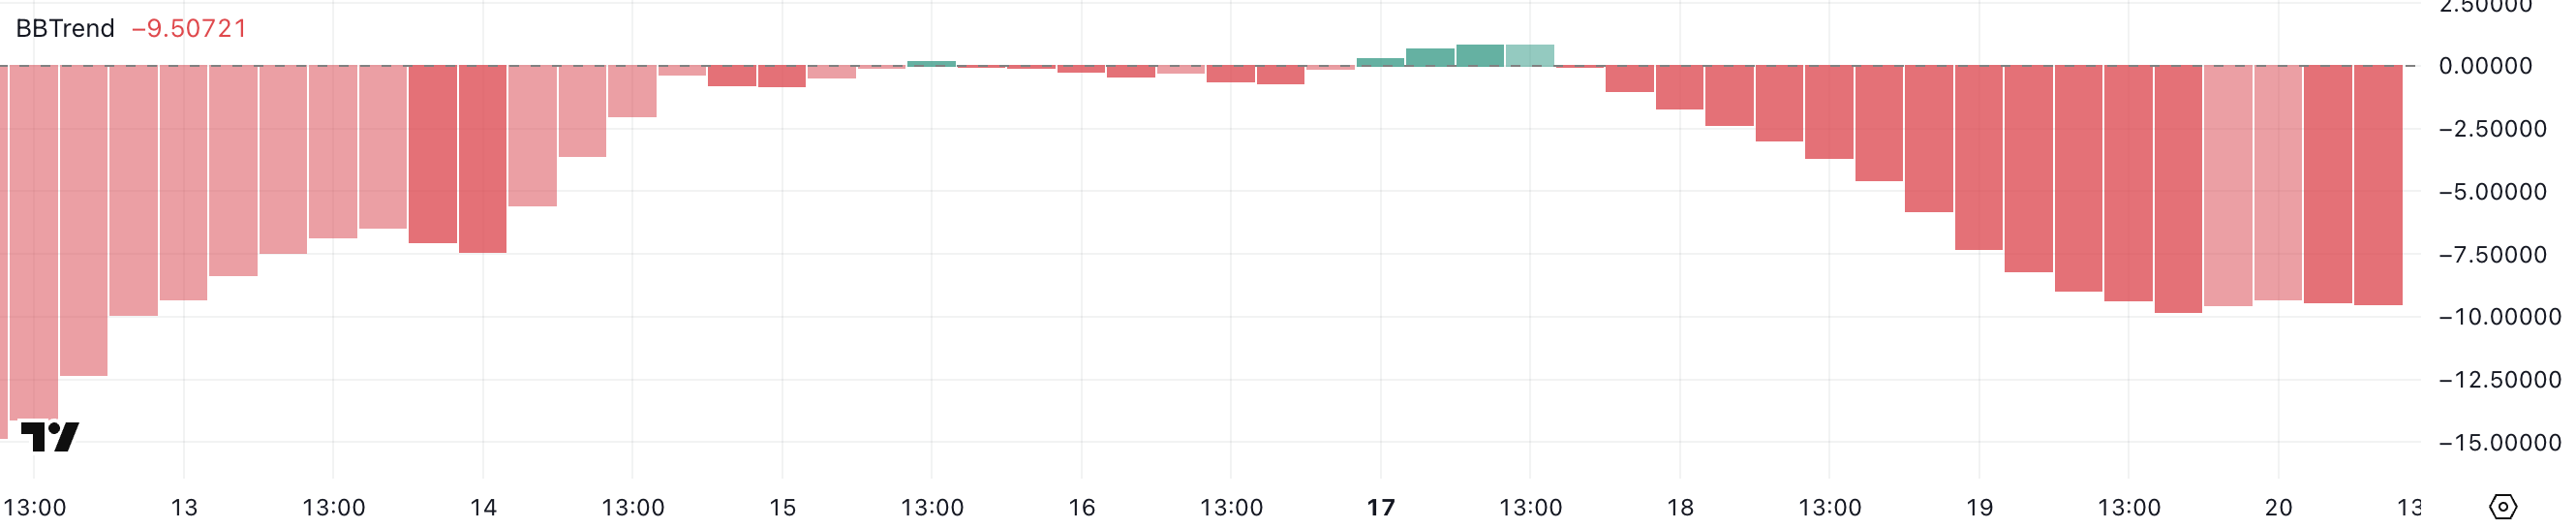
The BBTrend, or Bollinger Band Trend indicator, measures price trends based on the positioning of price action relative to the Bollinger Bands.
When BBTrend values are above zero, it indicates that the price is trading above the midline (typically the 20-period moving average), suggesting bullish momentum. Conversely, negative values point to prices trending below the midline, indicating bearish momentum.
With XCN’s BBTrend at -9.5 and struggling to establish positive values, it signals that the asset continues to lack strong bullish pressure, leaving the price vulnerable to further downside or prolonged consolidation.
Will Onyxcoin Fall Below $0.010 In March?
Onyxcoin EMA lines are showing a bearish configuration, with short-term moving averages positioned below the long-term ones.
This alignment suggests that downward momentum is prevailing, increasing the likelihood of further price declines. If XCN continues to trend lower, it could fall below the key support at $0.010, a level not seen since January 17.
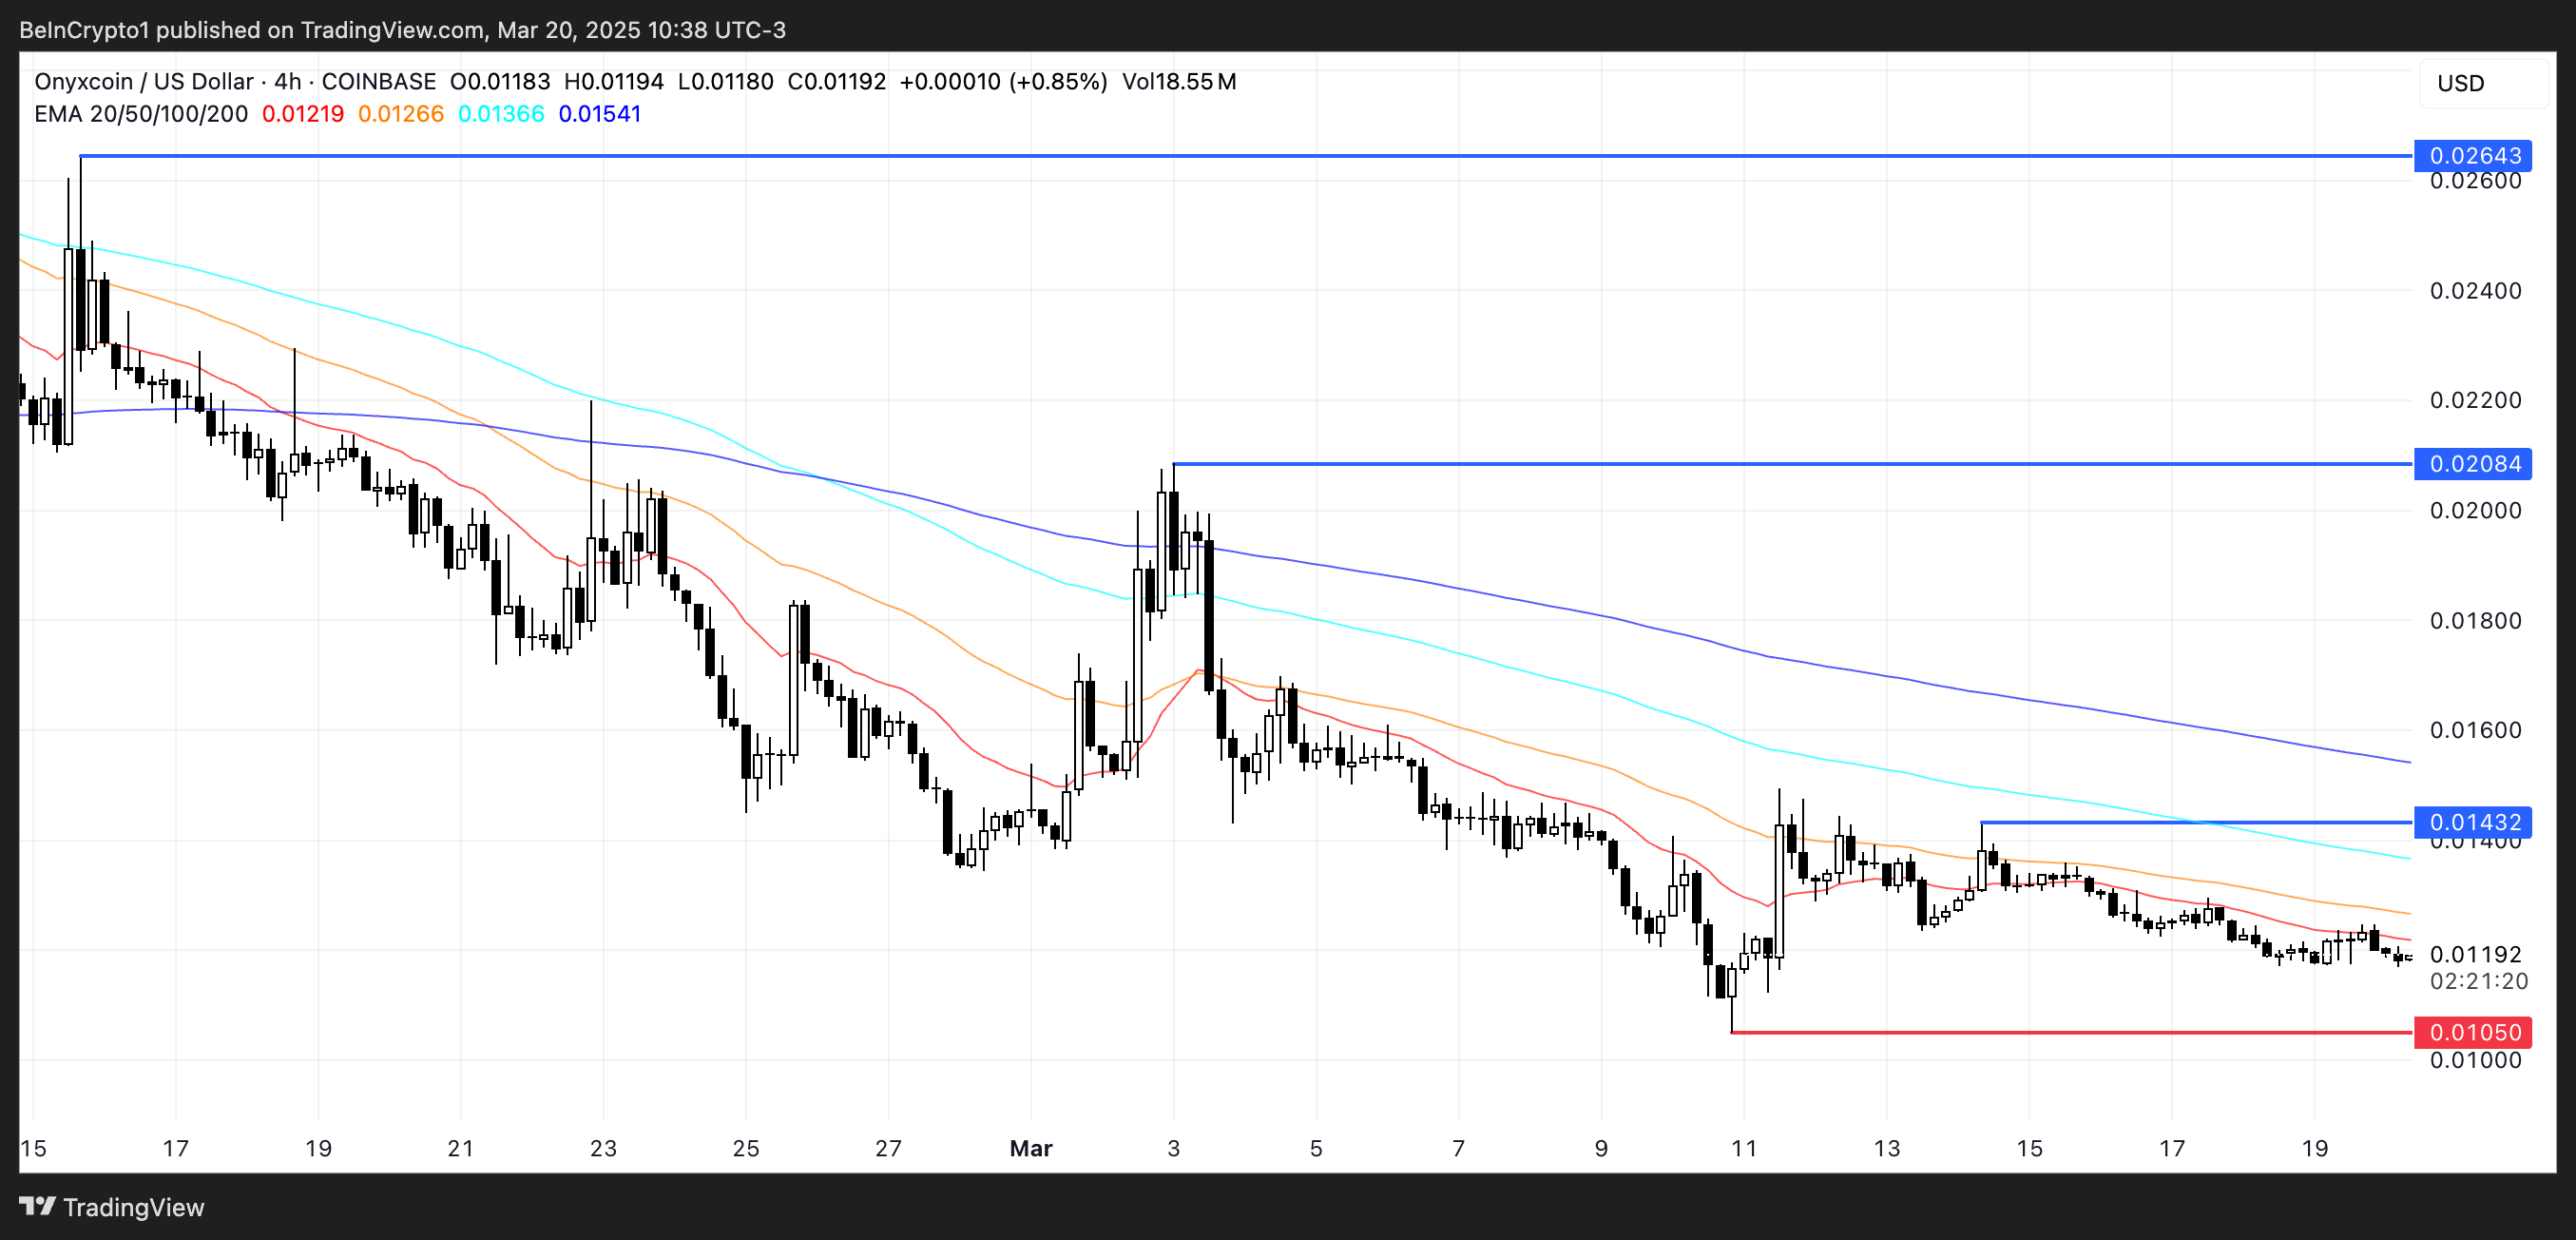
However, if Onyxcoin manages to regain the strong bullish momentum it demonstrated at the end of January – when it became one of the best-performing altcoins in the market – it could reverse this setup.
In that case, XCN might challenge resistance levels at $0.014 and $0.020, with the potential to climb as high as $0.026 if buyers step in aggressively.
Disclaimer
In line with the Trust Project guidelines, this price analysis article is for informational purposes only and should not be considered financial or investment advice. BeInCrypto is committed to accurate, unbiased reporting, but market conditions are subject to change without notice. Always conduct your own research and consult with a professional before making any financial decisions. Please note that our Terms and Conditions, Privacy Policy, and Disclaimers have been updated.


The total value of real-world assets (RWAs) on the Arbitrum network has surged over 1,000-fold since the start of 2024.
From a modest $100,000 to $200,000 in early January last year, Arbitrum now hosts more than $200 million in tokenized RWAs. This reflects one of the most explosive growth trajectories in decentralized finance (DeFi) this year.
RWA Total Value on Arbitrum Increases 1,000X
This exponential expansion is largely attributed to Arbitrum DAO’s Stable Treasury Endowment Program (STEP), which is currently in its 2.0 phase. The program allocated 85 million ARB tokens to support stable, liquid, yield-generating RWAs.
“The DAO just approved 35M ARB for RWAs via STEP 2.0. This brings the total RWA investments from the DAO treasury to 85M ARB, one of the largest DAO-led RWA allocations in Web3,” Arbitrum said in February.
The strategy aims to reduce the DAO’s exposure to volatile native crypto assets and help build a more resilient treasury, and it appears to be yielding results.

US Treasuries dominate Arbitrum’s RWA ecosystem, making up 97% of the sector. Franklin Templeton’s BENJI leads the pack, which holds a 36% market share, followed by SPIKO’s European treasuries, accounting for 18%.
This diversification beyond US-centric instruments is a healthy sign for global institutional engagement with Arbitrum.
“The eco welcomes global diversification beyond US instruments,” The Learning Pill remarked.
New entrants like Dinari have also added to the ecosystem’s momentum, offering tokenized versions of traditional securities. These include stocks, ETFs (exchange-traded funds), and REITs via its dShares platform.
More than 18 tokenized RWA products live on Arbitrum, covering various asset classes from bonds to real estate. Arbitrum itself highlighted this institutional influx on X (Twitter)
“RWA and Stablecoin adoption on Arbitrum has been monumental! Some of the largest institutions are bringing their tokenized assets to the land of liquidity with $4.7 billion in Stablecoins and over $214 million in RWAs already onchain,” the network stated.
Teams like Securitize, DigiFT, and SPIKO are tokenizing everything from sovereign debt to real estate portfolios, signaling the early formation of a new financial substrate.
Yet, despite the strong ecosystem development, ARB, the network’s native token, is down 88% from its all-time high.

Further downside pressure looms, with a 92.63 million ARB token unlock imminent. With only 46% of the total supply currently in circulation, concerns about dilution and lack of direct token accrual from RWA growth remain key market overhangs.

Tokenized RWA Cross $11 Billion, Ethereum Dominates Onchain Finance Frontier
Beyond Arbitrum, the broader real-world asset sector has quietly become one of the most significant trends in crypto, even if it does not dominate headlines.
According to DeFiLlama, on-chain RWAs have surpassed $11.169 billion in total value locked, up 2.5X over the past year.

Tokenized US Treasuries and tokenized gold are the engines behind this boom. BlackRock’s BUIDL fund now holds over $2.38 billion in tokenized Treasuries alone. Meanwhile, blockchain-based gold assets, driven by both market demand and rising metal prices, have crossed $1.2 billion, according to a recent BeInCrypto report.
Ethereum remains in the frontline, hosting approximately 80% of all on-chain RWAs. As TradFi giants seek programmable exposure to dollar yields and real assets, Ethereum offers the infrastructure and liquidity needed to bridge capital markets with blockchain rails.
“The top RWA protocols aren’t chasing crypto narratives. They are offering something TradFi understands: yield, dollar exposure, and gold. This is not the future of DeFi. It’s the future of finance,” DeFi analyst Patrick Scott observed.
Builders point out that adoption is already deeply embedded in on-chain-native applications like Pendle, Morpho, Frax, and various automated market makers (AMMs) and staking layers. The “real yield” thesis has arrived, coded into the new financial system’s base layer.
“The TradFi narrative is nice, but the adoption so far is on-chain-native,” DeFi builder Artem Tolkachev noted.
While flashy DeFi experiments often mimic casinos, RWAs show that slow, stable, and scalable wins the race.
The next frontier lies in improving access, liquidity, and incentives, particularly on non-Ethereum chains like Arbitrum, where the technical groundwork is strong, but market confidence remains in flux.
Tokenized RWAs may not be the loudest narrative in crypto, but they are becoming its most consequential.
“Onchain RWAs are quietly becoming the backbone of future finance, not hype, just real value TradFi gets: yield, dollars, and gold,” Validatus.com quipped.
Disclaimer
In adherence to the Trust Project guidelines, BeInCrypto is committed to unbiased, transparent reporting. This news article aims to provide accurate, timely information. However, readers are advised to verify facts independently and consult with a professional before making any decisions based on this content. Please note that our Terms and Conditions, Privacy Policy, and Disclaimers have been updated.
XRP price started a fresh increase above the $2.20 resistance. The price is now correcting gains and might find bids near the $2.050 zone.
- XRP price started a downside correction from the $2.250 resistance zone.
- The price is now trading below $2.120 and the 100-hourly Simple Moving Average.
- There was a break below a connecting bullish trend line with support at $2.140 on the hourly chart of the XRP/USD pair (data source from Kraken).
- The pair might extend losses if there is a close below the $2.050 support zone.
XRP Price Dips Again
XRP price started a fresh increase above the $1.980 resistance, like Bitcoin and Ethereum. The price climbed above the $2.020 and $2.050 resistance levels.
A high was formed at $2.244 and the price recently started a downside correction. There was a move below the $2.120 support zone. Besides, there was a break below a connecting bullish trend line with support at $2.140 on the hourly chart of the XRP/USD pair.
The price even spiked below the 50% Fib retracement level of the upward move from the $1.920 swing low to the $2.244 high. The price is now trading below $2.120 and the 100-hourly Simple Moving Average.

On the upside, the price might face resistance near the $2.120 level. The first major resistance is near the $2.180 level. The next resistance is $2.20. A clear move above the $2.20 resistance might send the price toward the $2.250 resistance. Any more gains might send the price toward the $2.320 resistance or even $2.350 in the near term. The next major hurdle for the bulls might be $2.50.
Another Decline?
If XRP fails to clear the $2.120 resistance zone, it could start another decline. Initial support on the downside is near the $2.050 level and the 61.8% Fib retracement level of the upward move from the $1.920 swing low to the $2.244 high. The next major support is near the $2.00 level.
If there is a downside break and a close below the $2.00 level, the price might continue to decline toward the $1.920 support. The next major support sits near the $1.840 zone.
Technical Indicators
Hourly MACD – The MACD for XRP/USD is now gaining pace in the bearish zone.
Hourly RSI (Relative Strength Index) – The RSI for XRP/USD is now below the 50 level.
Major Support Levels – $2.050 and $2.00.
Major Resistance Levels – $2.120 and $2.180.
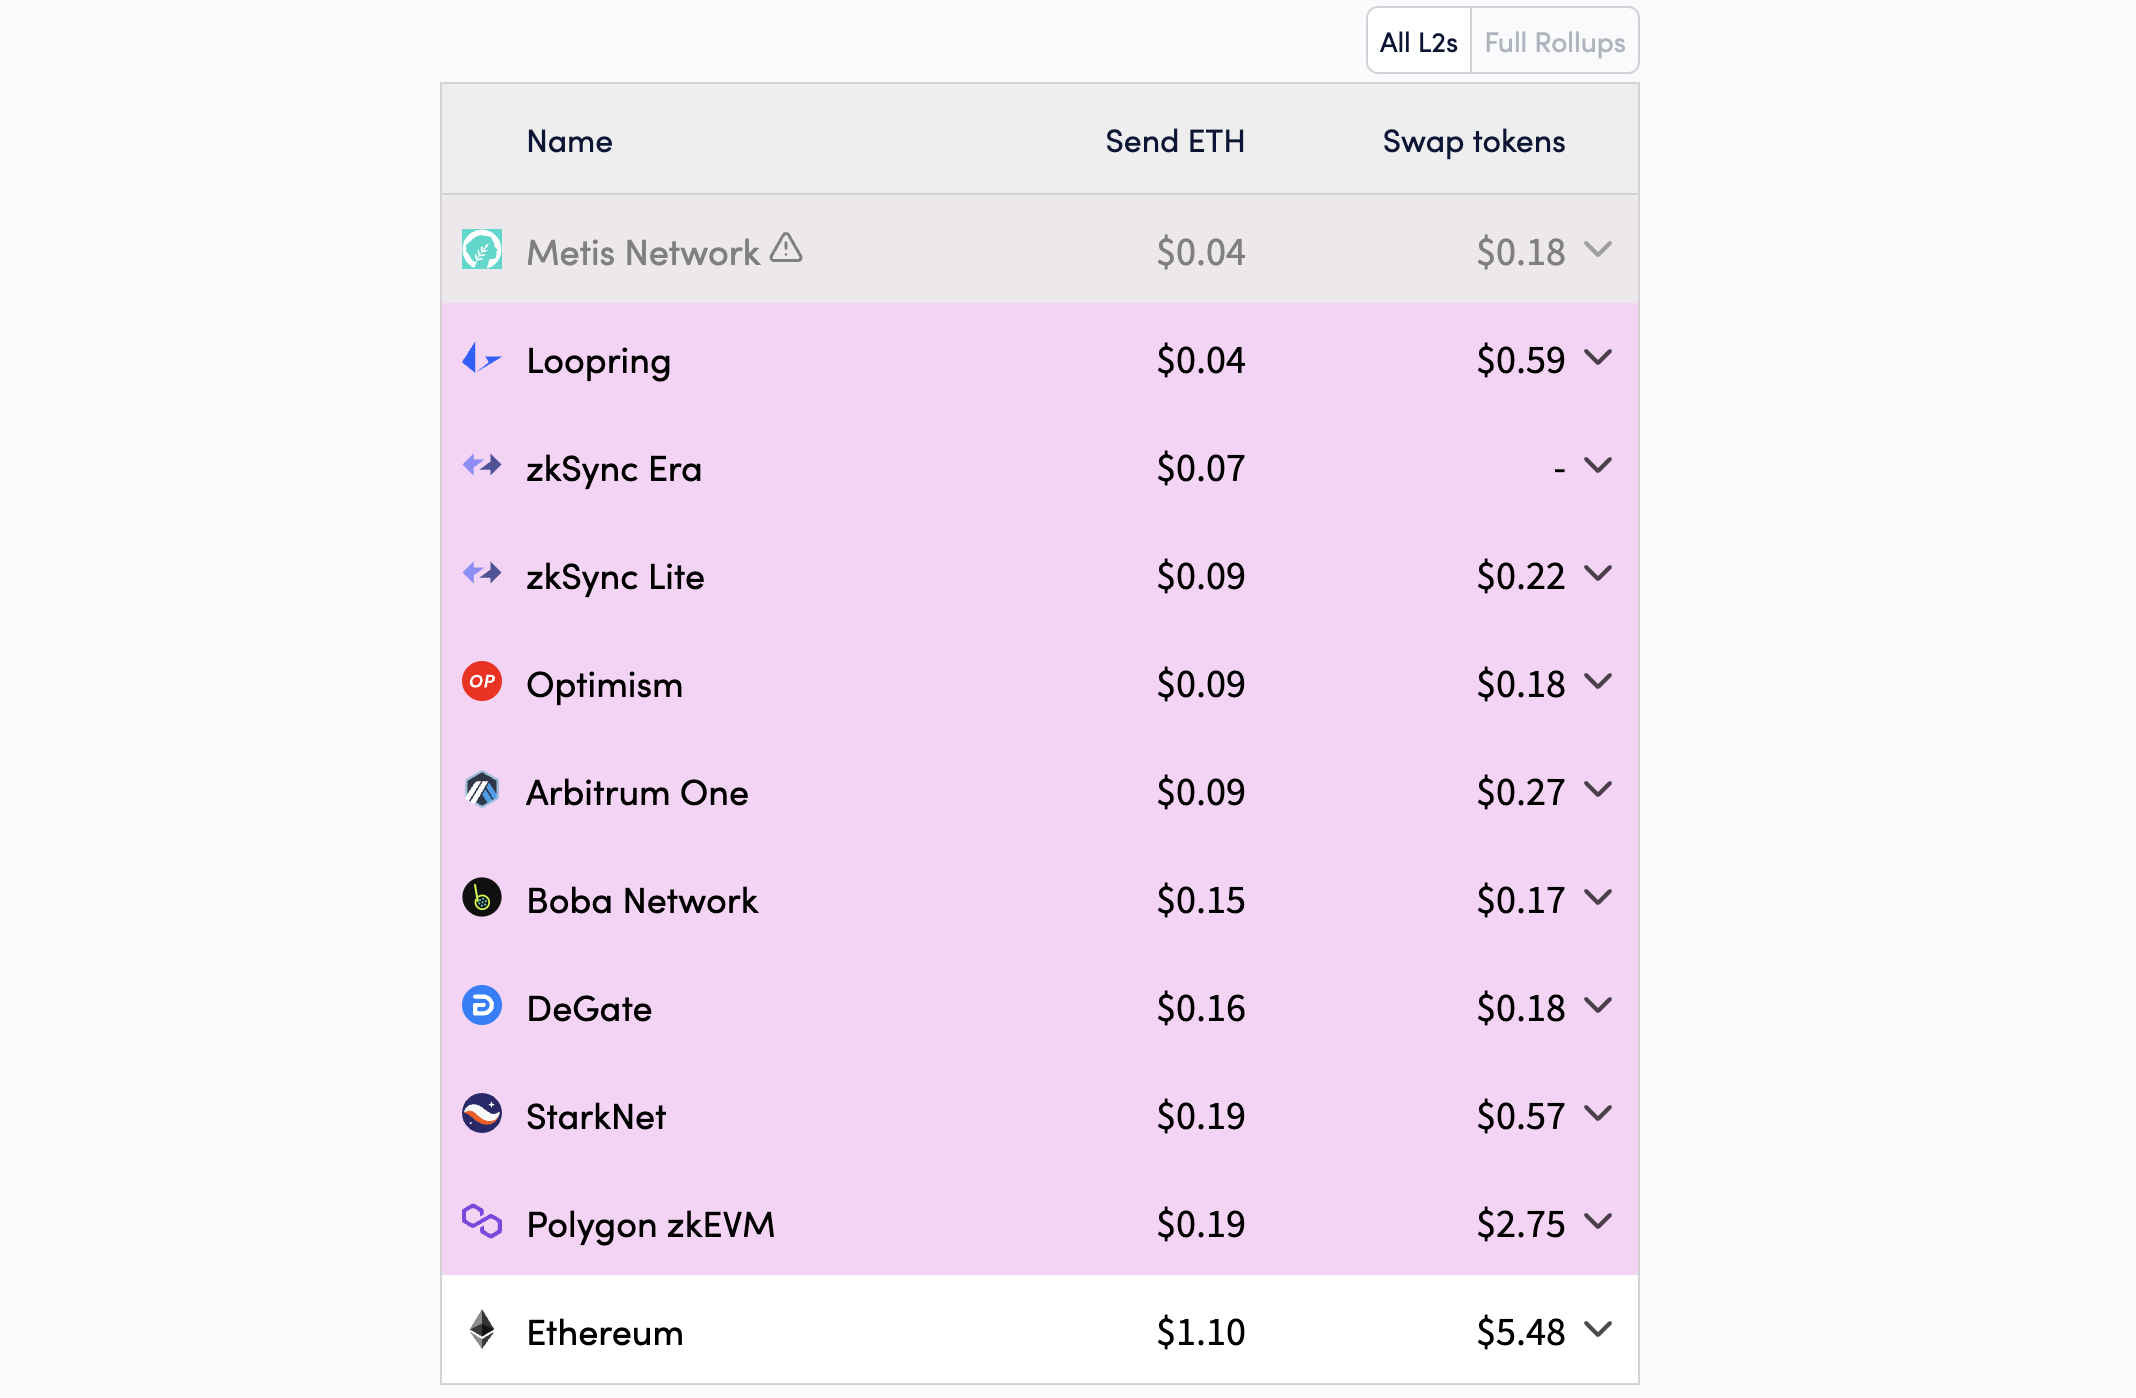
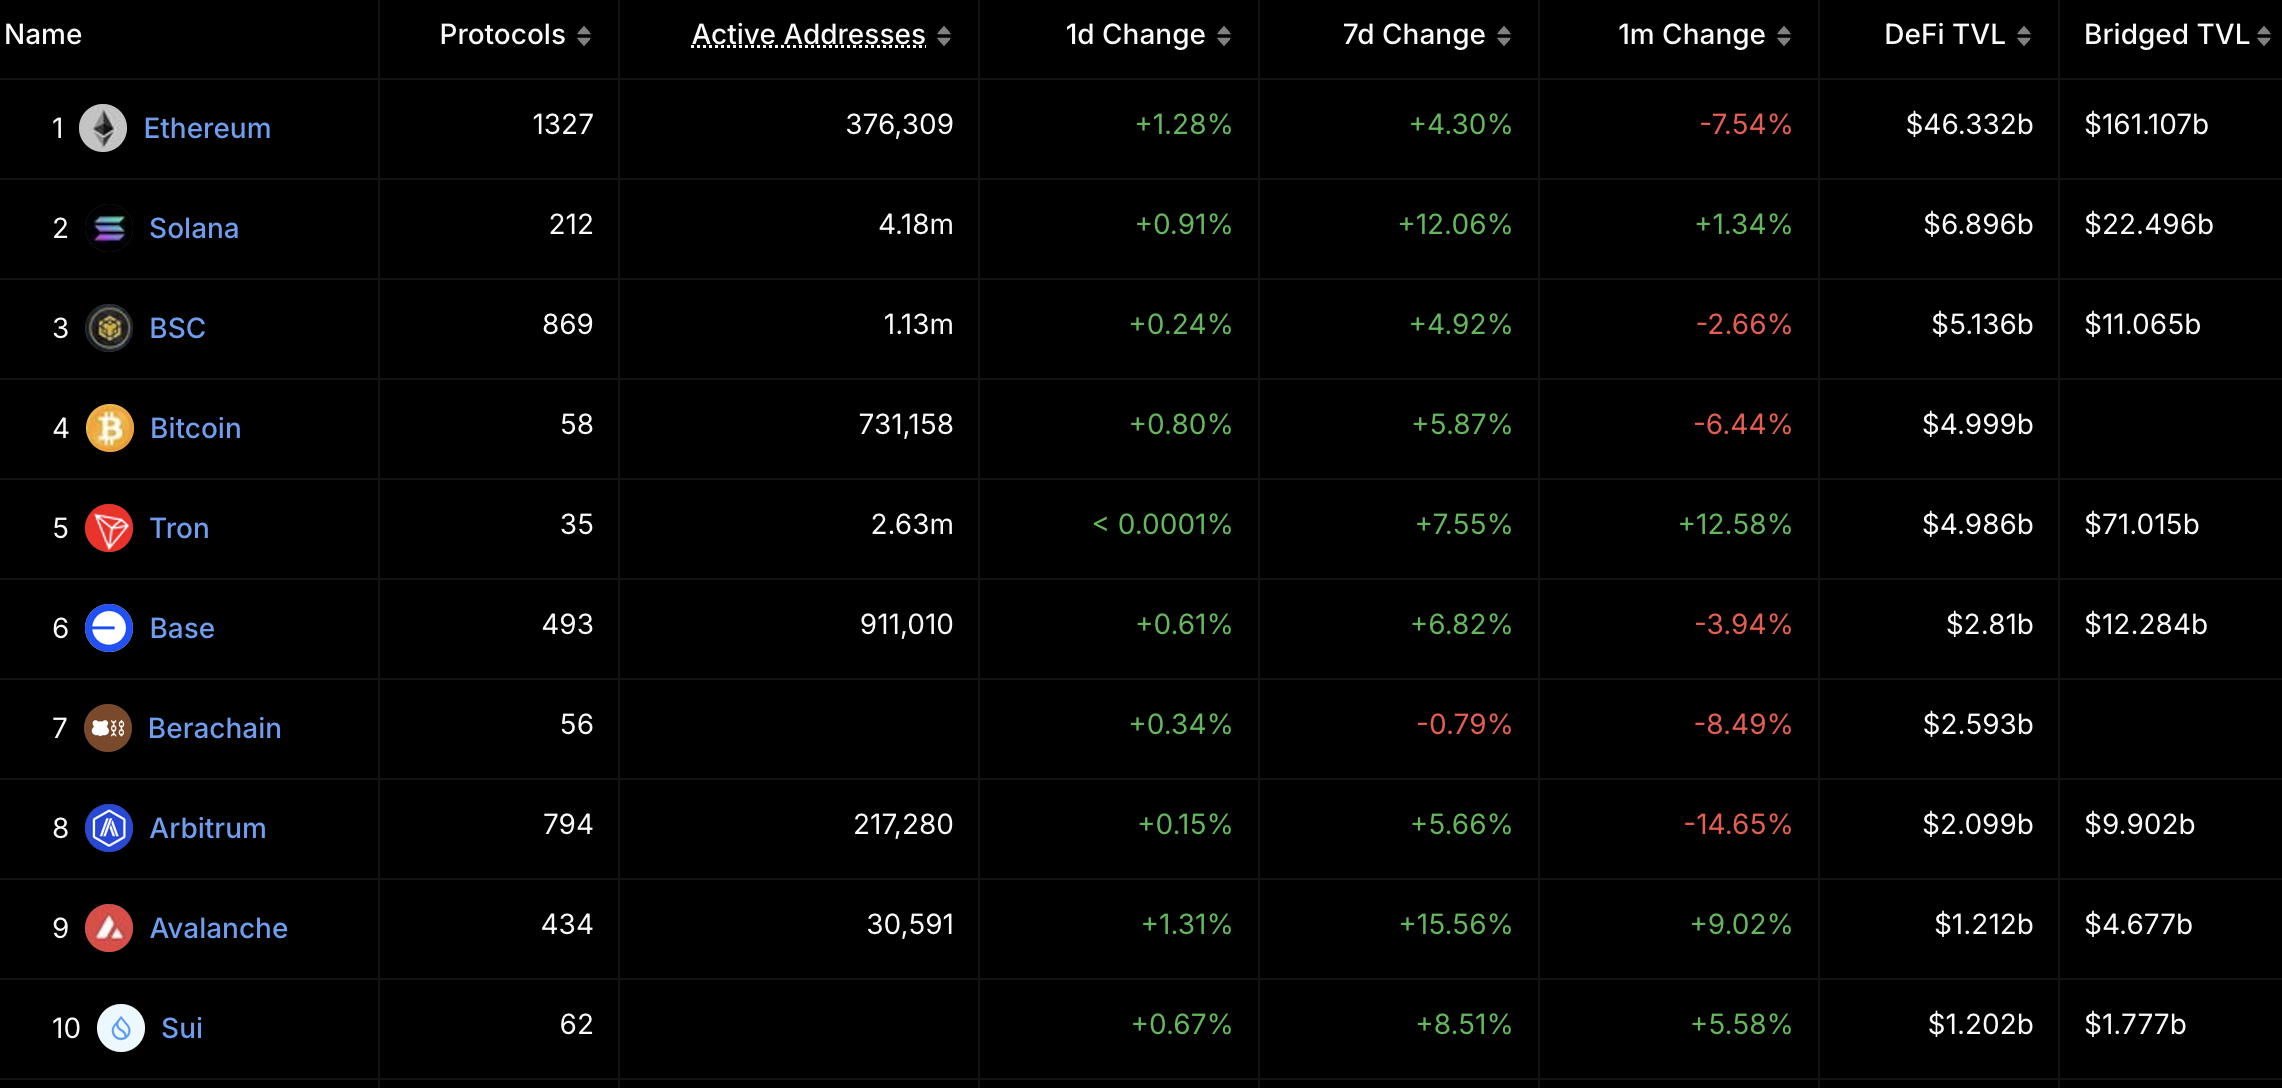
In Q1 2025, Ethereum solidified its leading position in the decentralized application (DApp) platform sector, generating $1.021 billion in fee revenue.
Other networks such as Base (Coinbase’s Layer-2), BNB Chain, Arbitrum, and Avalanche C-Chain also recorded significant revenue but lagged far behind Ethereum.
Fee Revenue Landscape Among Blockchains
According to Token Terminal, Ethereum maintained its top position among DApp platforms, with DApp fee revenue reaching $1.021 billion in Q1 2025. This figure highlights Ethereum’s dominance and strong growth within the DApp ecosystem.

Base, a Coinbase Layer-2 network, ranked second with $193 million in DApp fee revenue, showing notable growth but still trailing Ethereum. BNB Chain followed in third with $170 million, Arbitrum with $73.8 million, and Avalanche C-Chain in fifth with $27.68 million.
DApp fee revenue is a key metric for measuring a blockchain’s activity and user value. On Ethereum, popular DApps include DeFi protocols like Uniswap and Aave, NFT platforms like OpenSea, blockchain games, and social applications. The growth in Ethereum’s DApp fee revenue indicates sustained high demand for these applications despite competition from other networks and often high transaction costs (gas fees) on the mainnet.
Why Ethereum Leads
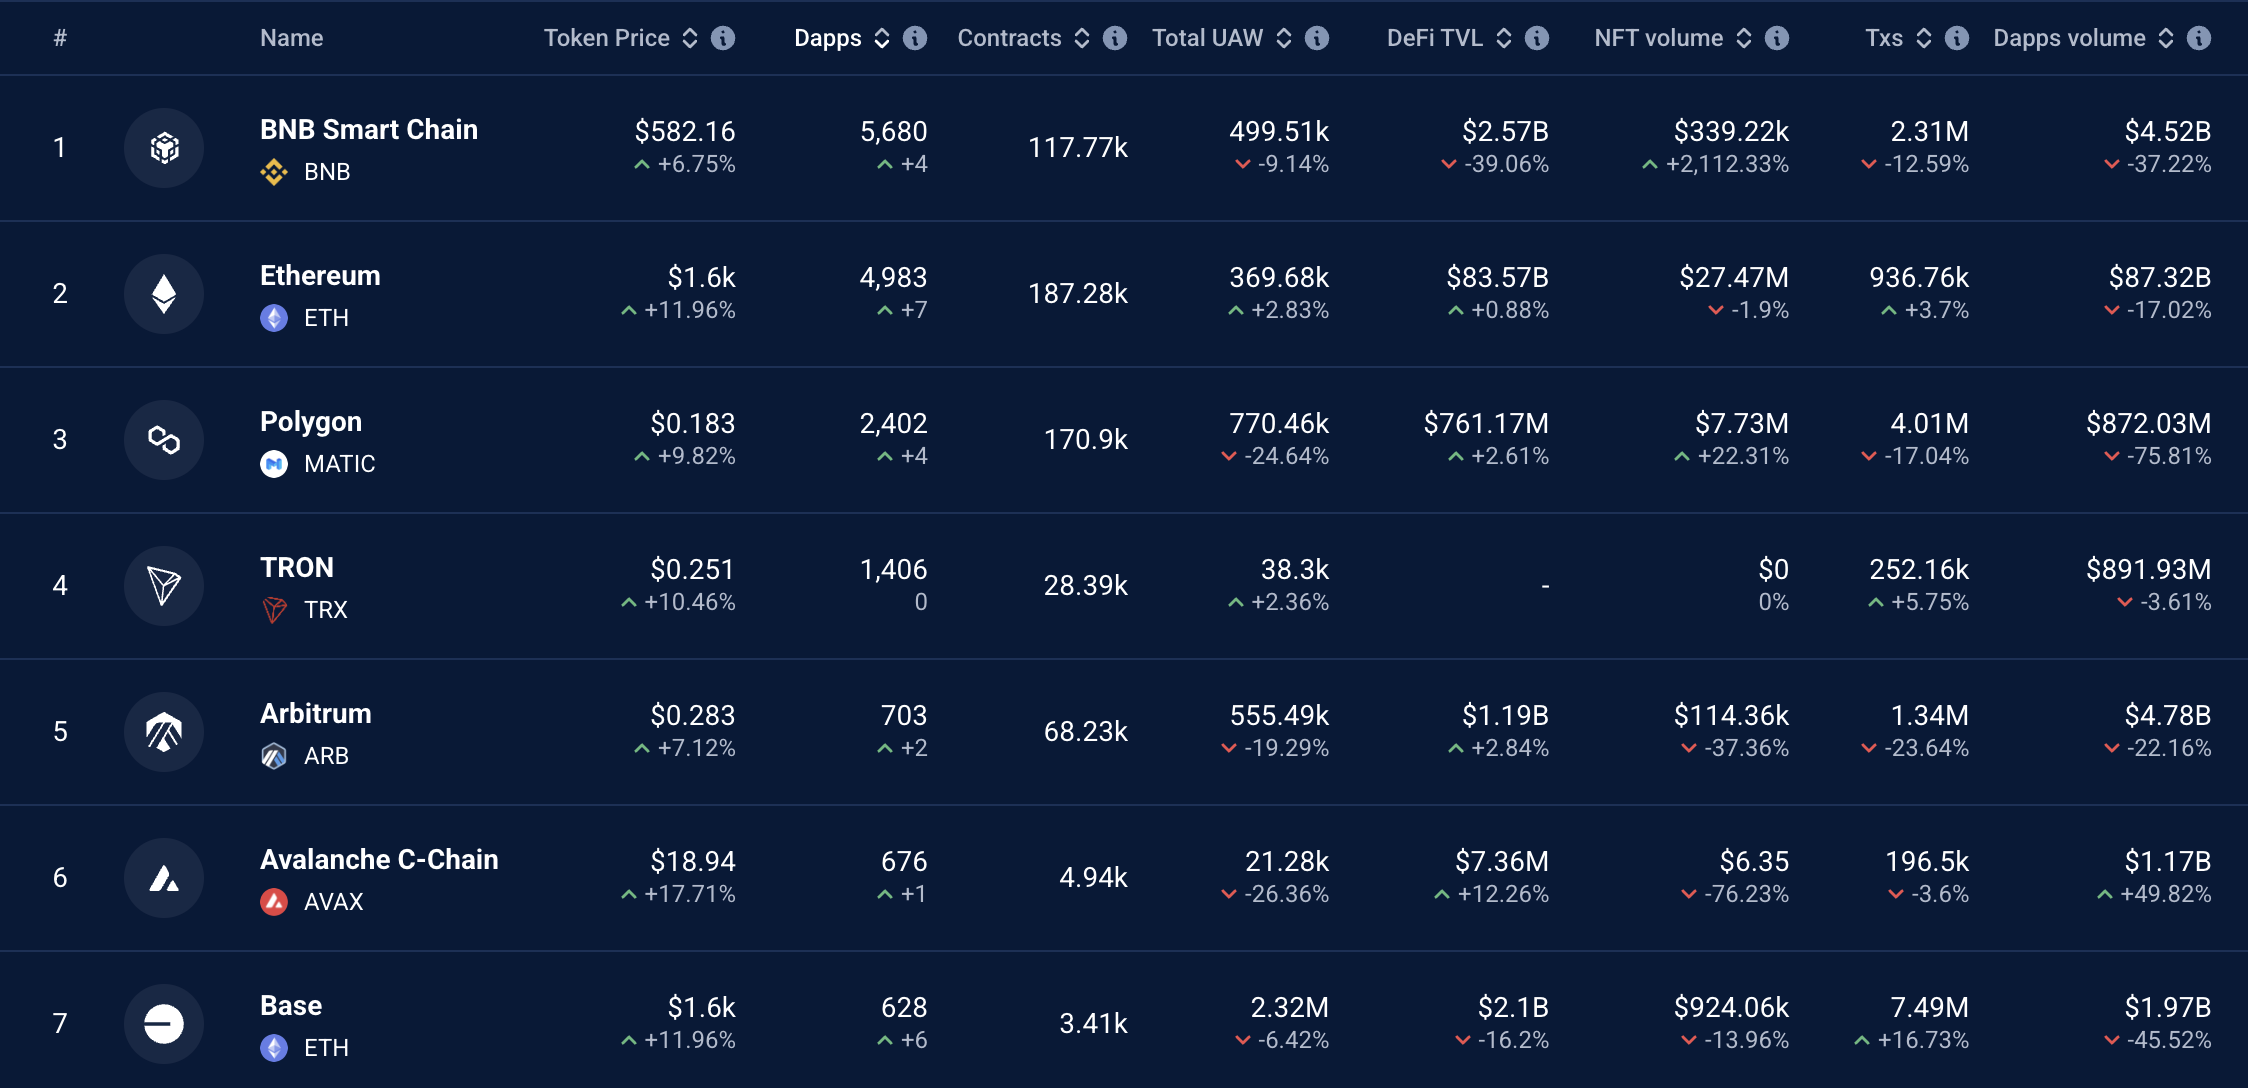
Several factors explain Ethereum’s continued leadership in DApp fee revenue. Firstly, Ethereum was the first blockchain to support smart contracts, laying the foundation for its DApp ecosystem. According to DappRadar data, Ethereum remains the blockchain with the largest DApps, hosting over 4,983 active DApps, below the BNB Chain.
Second, Ethereum’s high security and reliability make it the preferred choice for developers and users. Despite high mainnet transaction costs, Ethereum has improved performance through upgrades like Dencun (implemented in 2024), which reduced costs on Layer-2 networks and enhanced scalability.
Third, Ethereum’s DeFi ecosystem remains a primary driver of fee revenue. According to DefiLlama, the Total Value Locked (TVL) in Ethereum’s DeFi protocols reached $46 billion, representing 51% of the total TVL in the DeFi market.
While Ethereum leads, other networks are also showing significant growth. According to Token Terminal, Base, Coinbase’s Layer-2, generated $193 million in DApp fee revenue, a 45% increase from Q4 2024.
BNB Chain, with $170 million, remains a strong competitor due to low costs and a diverse DApp ecosystem, including platforms like PancakeSwap. Arbitrum, another Ethereum Layer-2, recorded $73.8 million, driven by the expansion of DeFi and blockchain gaming DApps. With $27.68 million, Avalanche C-Chain excels in finance and NFTs but cannot match Ethereum’s scale.
Disclaimer
In adherence to the Trust Project guidelines, BeInCrypto is committed to unbiased, transparent reporting. This news article aims to provide accurate, timely information. However, readers are advised to verify facts independently and consult with a professional before making any decisions based on this content. Please note that our Terms and Conditions, Privacy Policy, and Disclaimers have been updated.

Arbitrum RWA Market Soars – But ARB Still Struggles

Ripple Whale Moves $273M As Analyst Predicts XRP Price Crash To $1.90

XRP Price Pulls Back: Healthy Correction or Start of a Fresh Downtrend?

Ethereum Leads Q1 2025 DApp Fees With $1.02 Billion

Bitcoin Price on The Brink? Signs Point to Renewed Decline

3 US Crypto Stocks to Watch Today: CORZ, MSTR, and COIN

2.52 Million Altcoins Are Ruining Crypto’s Future

Animoca Brands Valuation Tanks 75% In Two Years, Here’s Why

Crypto exchange BingX hacked for $43 million

Are The Big Players Losing Interest?

Hong Kong’s Securities Association Tips Authorities On Crypto Self-Regulation

Coinbase cbBTC Set to go Live on Solana
2.52 Million Altcoins Are Ruining Crypto’s Future
Animoca Brands Valuation Tanks 75% In Two Years, Here’s Why
Crypto exchange BingX hacked for $43 million
Are The Big Players Losing Interest?
Hong Kong’s Securities Association Tips Authorities On Crypto Self-Regulation
Coinbase cbBTC Set to go Live on Solana
-

 Market21 hours ago
Can Pi Network Avoid a Similar Fate?
-

 Market24 hours ago
XRP Price Could Regain Momentum—Is a Bullish Reversal in Sight?
-

 Market20 hours ago
Ethereum Price Consolidation Hints at Strength—Is a Move Higher Coming?
-

 Market23 hours ago
Cardano Buyers Eye $0.70 as ADA Rallies 10%
-
 Bitcoin22 hours ago
Bitcoin Poised for Summer Rally as Gold Leads and Liquidity Peaks
-
 Altcoin21 hours ago
Binance Delists This Crypto Causing 40% Price Crash, Here’s All
-

 Bitcoin20 hours ago
Bolivia Reverses Crypto-for-Fuel Plan Amid Energy Crisis
-

 Market19 hours ago
Pi Network Price Rise To $1 is Now In The Hands Of Bitcoin
