
Market
Onyxcoin Whales Sell 630 Million XCN; Price Falls 34% In A Week

Onyxcoin (XCN) has experienced a significant downtrend recently, with its price falling 34% in just one week.
This sharp decline has worsened the situation for XCN holders, especially as large-scale investors, also known as whales, are pulling out of the market. Their sell-off has only added to the negative sentiment surrounding the coin.
Onyxcoin Whales Are Pulling Back
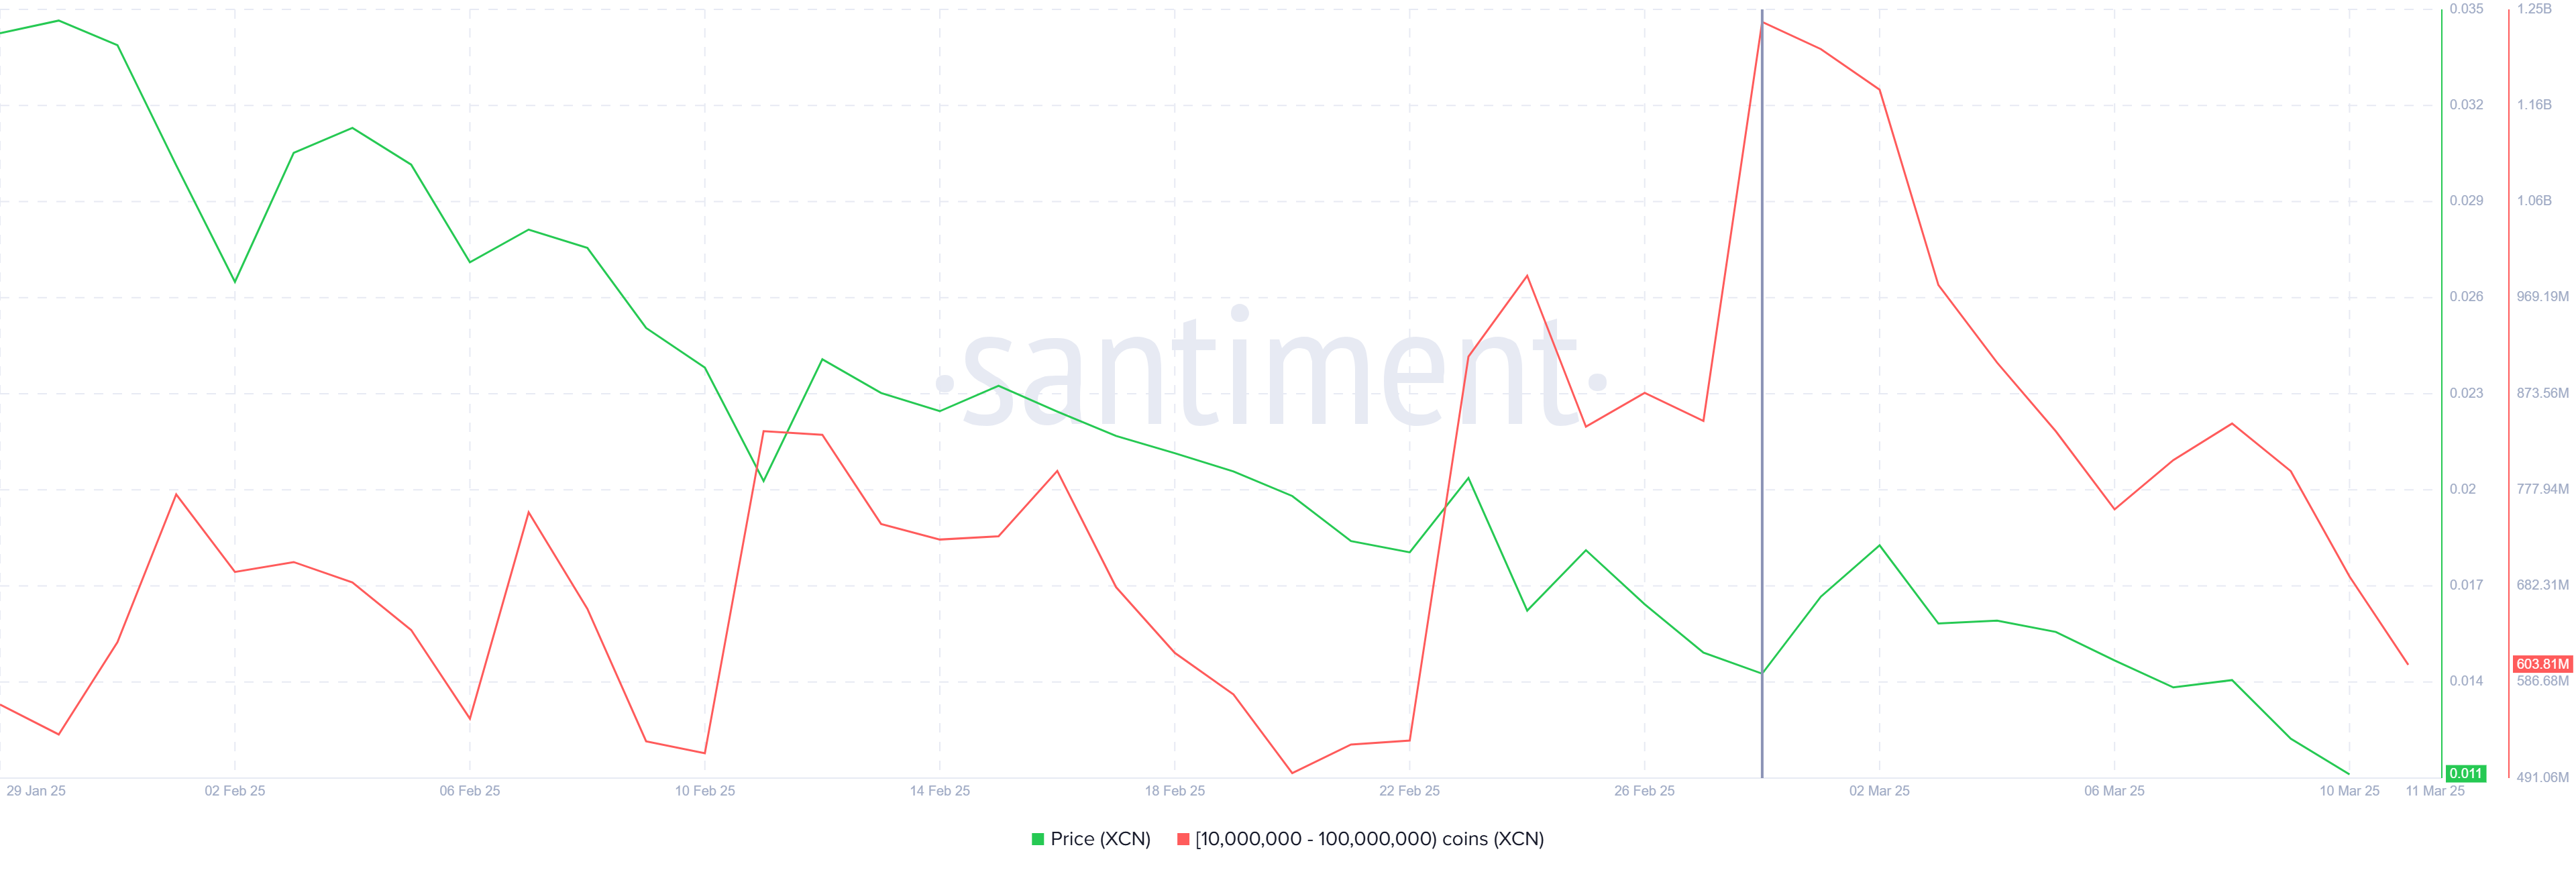
Whale addresses holding between 10 million and 100 million XCN, have sold over 50% of their holdings, resulting in a significant reduction in their positions. This sell-off saw the amount of Onyxcoin held by these whales drop from 1.24 billion XCN to 603 million XCN, equating to roughly 637 million XCN sold, worth $76 million. Such substantial sales from influential market players are a bearish sign, as their actions often prompt retail investors to follow suit, fearing further declines.
As these whales lose confidence in Onyxcoin’s potential for recovery, their massive liquidation has caused a ripple effect throughout the market. The sentiment surrounding XCN will likely remain negative, potentially delaying any potential price rebound.
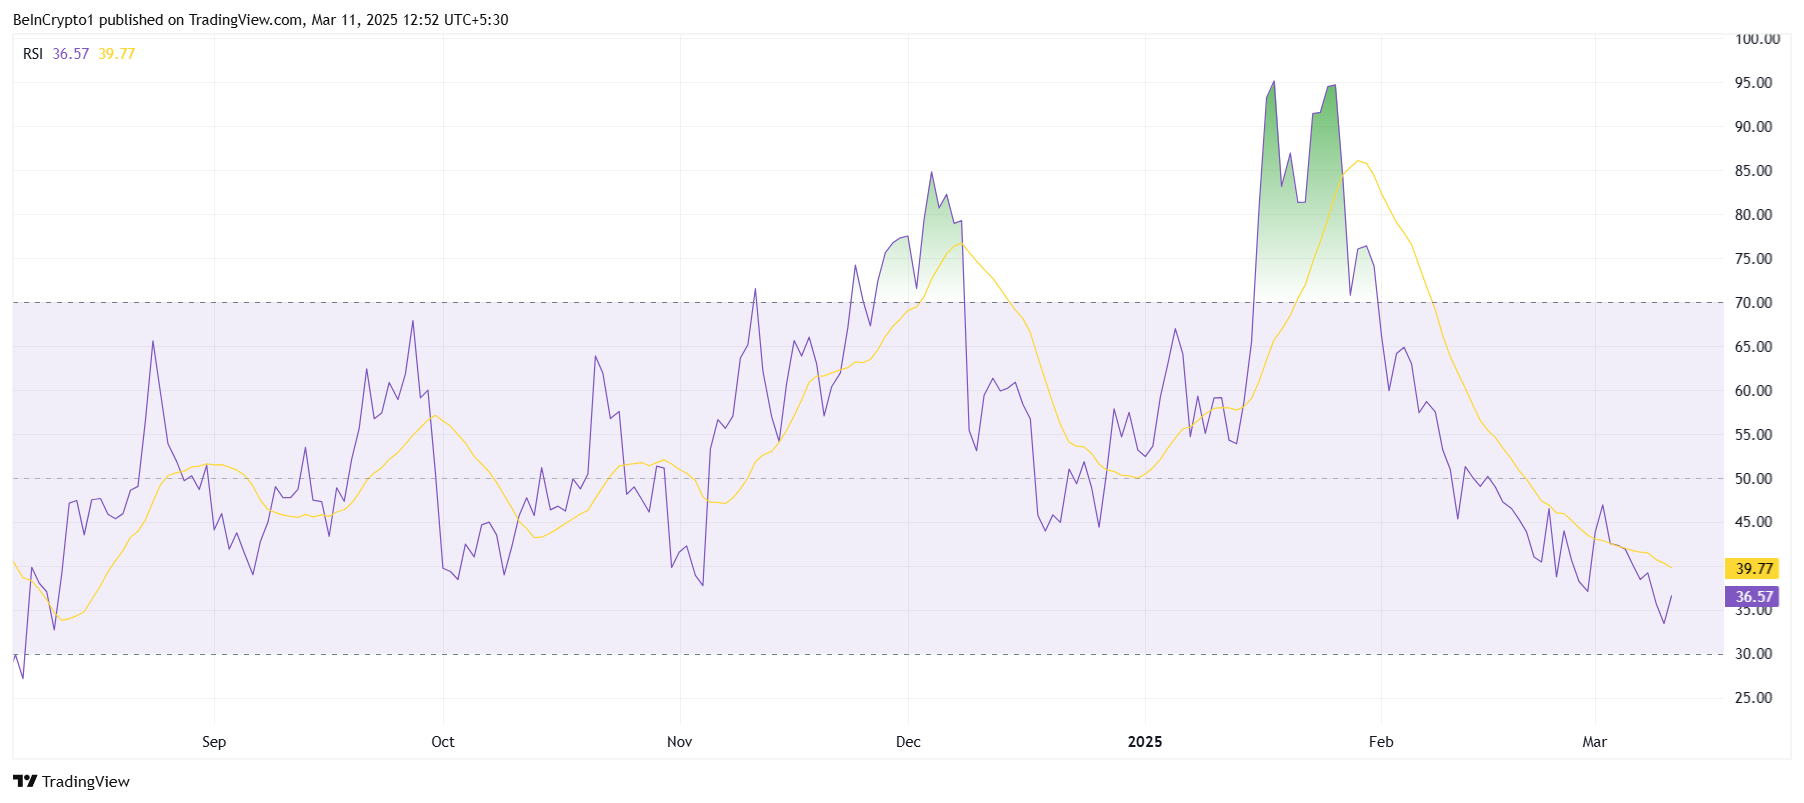
The overall macro momentum of Onyxcoin is currently under pressure, driven largely by the selling behavior of whales and broader market conditions. The Relative Strength Index (RSI) has fallen to a 7-month low, signaling a peak in bearish momentum. This drop suggests that the cryptocurrency is in a vulnerable position, with further corrections likely if the trend continues.
The RSI’s position indicates that Onyxcoin has not been this weak since August 2024. This makes it challenging for XCN to break free from its downward trajectory, as investor sentiment remains sluggish.
XCN Price Is Looking At Further Decline
Onyxcoin has fallen 34% over the last week and is currently trading at $0.0119. For the past month and a half, it has remained stuck under the downtrend line and has been unable to break through the resistance level of $0.0127. Given the persistent downward pressure, it is unlikely to see an immediate rally, and the price could remain under this barrier for some time.
If the bearish sentiment continues and the selling from whales intensifies, XCN could fall to $0.0100 or even lower, potentially reaching $0.0080. Such a decline would result in even greater losses for investors and deepen the negative market sentiment surrounding Onyxcoin.
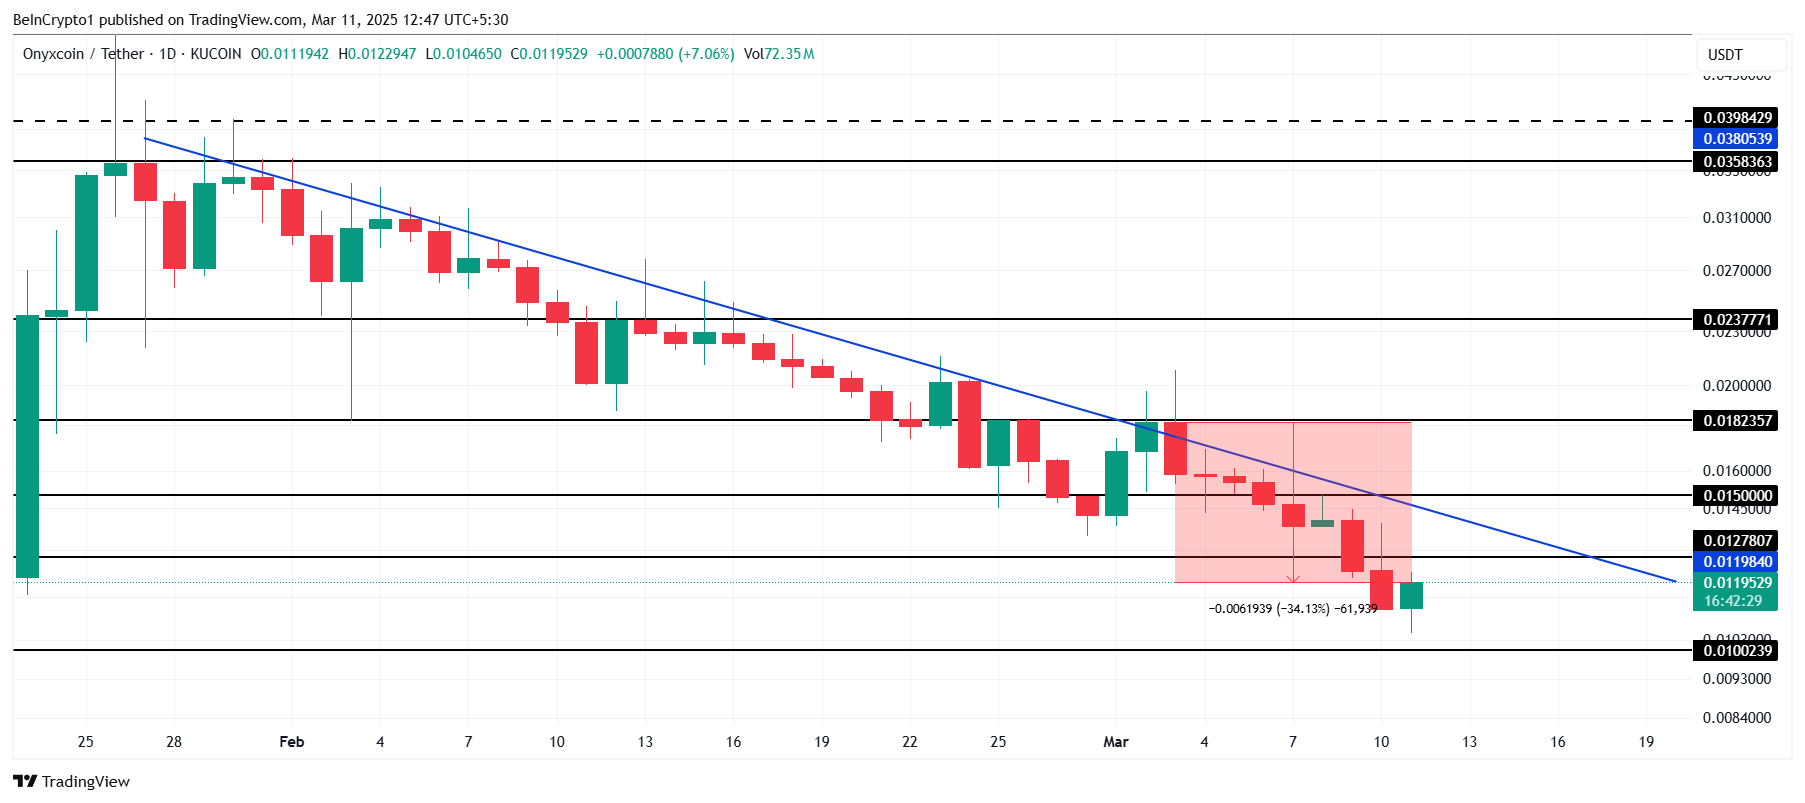
However, if Onyxcoin can reclaim the $0.0127 level as support, it could signal a potential reversal. Such a move would allow XCN to rally toward $0.0150 or higher, invalidating the current bearish outlook. A breakout above $0.0150 could send XCN to $0.0182, restoring confidence among investors.
Disclaimer
In line with the Trust Project guidelines, this price analysis article is for informational purposes only and should not be considered financial or investment advice. BeInCrypto is committed to accurate, unbiased reporting, but market conditions are subject to change without notice. Always conduct your own research and consult with a professional before making any financial decisions. Please note that our Terms and Conditions, Privacy Policy, and Disclaimers have been updated.


Binance co-founder Changpeng Zhao (CZ) announced a major deflationary milestone, confirming the completion of BNB Chain’s 31st quarterly token burn.
In total, 1.57 million BNB, valued at approximately $916 million, was permanently removed from circulation.
BNB Chain Burns $916 Million Worth of Tokens in 31st Quarterly Event
The BNB burn is part of BNB Smart Chain’s long-running commitment to reduce the token’s total supply and potentially bolster long-term value.
According to an official blog post, this quarter’s burn was completed successfully. The remaining total supply of BNB stands at just over 139 million. Former Binance CEO Changpeng Zhao echoed the update with a simple post on X (Twitter).
“$916,000,000 BNB burned,” CZ wrote.
They sent the tokens to a burn address, 0x000…dEaD, making them unrecoverable and effectively reducing the total supply.
The burn occurred under BNB’s Auto-Burn mechanism and marks one of the largest events in the chain’s history. Established under BEP95, BNB’s Auto-Burn system provides transparency and predictability. It adjusts the burn amount based on BNB’s market price and the number of blocks generated on the BNB Smart Chain (BSC) each quarter.
The goal is gradually reducing the token’s circulating supply to 100 million BNB. Once this happens, regular burns will cease.
Deflationary mechanisms are typically bullish, but the market reaction was tepid. BNB’s price slipped 2.11% over the past 24 hours, trading around $578.04 as of this writing.

Impact of BNB Burn on Market Sentiment
The muted response mirrors the aftermath of the 30th burn, suggesting that even billion-dollar reductions in supply are not enough to overcome broader market sentiment or investor fatigue. Meanwhile, community members expressed mixed feelings about the event.
“It actually pains me sometimes to see BNB burns! I know it’s part of the deflationary process… but it still hurts brother CZ,” crypto advocate Shahzad Quadri commented.
Meanwhile, others questioned the utility of such a large burn. Users asked CZ why the BNB chain did not redirect the funds toward marketing efforts.
“It’s not up to me. It was in the whitepaper. A promise is a promise,” CZ replied.
This statement resonated with community leaders, including a MEXC exchange KOL, who responded in a post.
“Saw people wishing it wasn’t burnt. The only way is burning because if it is not burnt, the team won’t be keeping the promise on the whitepaper,” the KOL highlighted.
Changpeng Zhao added a touch of irony, seeming surprised by the size of the burn. Users asked whether this burn was separate from the ongoing gas fee burn introduced under BEP95.
“I have no idea. There are a few different automated burn mechanisms. I learned about this burn on X,” he chimed.
In addition to the quarterly Auto-Burn, BNB implements a real-time burn model that permanently removes a portion of gas fees from circulation. Since its inception, over 259,000 BNB tokens have been burned through this mechanism.

Furthermore, the BNB Pioneer Burn Program continues to cover user losses from accidental token misplacements. It uses quarterly burns to offset such events.
CZ has a personal investment, with 98.6% of his portfolio in BNB as of February. Still, the commitment to scheduled burns and BNB’s critical role across BNB Smart Chain, opBNB Layer 2, and BNB Greenfield blockchain reaffirms the long-term strategy to drive utility, governance participation, and ecosystem growth.

The BNB community is left watching price action, balancing hope in the deflationary model with the reality of market headwinds.
Disclaimer
In adherence to the Trust Project guidelines, BeInCrypto is committed to unbiased, transparent reporting. This news article aims to provide accurate, timely information. However, readers are advised to verify facts independently and consult with a professional before making any decisions based on this content. Please note that our Terms and Conditions, Privacy Policy, and Disclaimers have been updated.
Gold prices have surpassed $3,300 per ounce, setting a historic high as global markets face heightened volatility.
This surge reflects investor anxiety over economic uncertainty and highlights the significant impact of controversial tariff policies under President Trump. Consequently, experts have issued conflicting forecasts on how this may influence Bitcoin.
What’s Driving Gold to Keep Breaking Records?
At the time of writing, gold has surged past $3,000, reaching a peak of $3,317. That marks a 25% increase since the beginning of the year.

According to a report in The New York Times, the global trade war is the primary force behind gold’s continued rise. Retaliatory tariffs among major economies are clouding the global economic outlook.
The US imposed new tariffs, quickly triggering countermeasures from China, the European Union, and Canada. In response, the White House escalated the situation further.
“While general uncertainty and deteriorating economic vibes are improving interest in gold, most of gold’s price action is around the uncertainty related to tariffs,” Helima Croft, head of global commodity strategy at RBC Capital Markets, said.
In addition, there are growing concerns that tariffs could directly target imported gold. This fear has led to gold stockpiling within the United States.
Business Standard reported that major banks like JPMorgan Chase and HSBC have been moving large quantities of gold from London to New York. JPMorgan alone plans to transport $4 billion worth of gold this month.
Besides the tariff war, macro analyst Zerohedge pointed to another factor—the Senate Budget Resolution for FY2025. This resolution allows the US to increase its budget deficit by up to $5.8 trillion over the next ten years. Zerohedge suggested that Gold is responding to this news.
The price spike reflects fears of currency devaluation due to ballooning deficits.
Goldman Sachs has also raised its year-end gold forecast to $3,700. The bank cited stronger-than-expected central bank demand and rising recession risks.
What Are Analysts Saying About Bitcoin as Gold Hits a New Peak?
While gold shines, Bitcoin, often called “digital gold,” has drawn mixed opinions.
Anthony Papillano, CEO of Professional Capital Management, told CNBC on April 15 that Bitcoin has dropped around 10% since the start of the year, while gold has gained 20%. However, both assets have risen approximately 35% over the past year.
He also outlined reasons why Bitcoin might soon rally like gold. These include the US government’s strategic Bitcoin reserve plans and the younger generation’s growing view of Bitcoin as part of a long-term investment strategy.
“History tells us Bitcoin’s returns will skyrocket past Gold in the coming months,” Papillano predicted.
Supporting this view, several analysts noted that Bitcoin often follows gold’s upward momentum with a lag of about 100 days, especially during increased global liquidity. Additionally, companies purchased more than 95,400 BTC in the first quarter of 2025, showing strong institutional demand.
However, not everyone agrees. Economist Peter Schiff, a long-time Bitcoin critic, offered a contrasting view. He claimed the best trade right now is to sell all Bitcoin and other cryptocurrencies and invest entirely in gold and silver mining stocks.
Disclaimer
In adherence to the Trust Project guidelines, BeInCrypto is committed to unbiased, transparent reporting. This news article aims to provide accurate, timely information. However, readers are advised to verify facts independently and consult with a professional before making any decisions based on this content. Please note that our Terms and Conditions, Privacy Policy, and Disclaimers have been updated.

Reason to trust
![]()
Strict editorial policy that focuses on accuracy, relevance, and impartiality
Created by industry experts and meticulously reviewed
The highest standards in reporting and publishing
Strict editorial policy that focuses on accuracy, relevance, and impartiality
Morbi pretium leo et nisl aliquam mollis. Quisque arcu lorem, ultricies quis pellentesque nec, ullamcorper eu odio.
Ethereum price started a fresh decline from the $1,690 zone. ETH is now consolidating and might decline further below the $1,580 support zone.
- Ethereum started a fresh decline after it failed to clear $1,700 and $1,720.
- The price is trading below $1,620 and the 100-hourly Simple Moving Average.
- There was a break below a new connecting bullish trend line with support at $1,625 on the hourly chart of ETH/USD (data feed via Kraken).
- The pair could start a fresh increase if it clears the $1,640 resistance zone.
Ethereum Price Faces Rejection
Ethereum price formed a base above $1,550 and started a fresh increase, like Bitcoin. ETH gained pace for a move above the $1,600 and $1,620 resistance levels.
The bulls even pumped the price above the $1,650 zone. A high was formed at $1,690 and the price recently corrected gains. There was a move below the $1,640 support zone. Besides, there was a break below a new connecting bullish trend line with support at $1,625 on the hourly chart of ETH/USD.
The price tested the 50% Fib retracement level of the upward move from the $1,472 swing low to the $1,690 high. Ethereum price is now trading below $1,625 and the 100-hourly Simple Moving Average.
On the upside, the price seems to be facing hurdles near the $1,620 level. The next key resistance is near the $1,640 level. The first major resistance is near the $1,650 level. A clear move above the $1,650 resistance might send the price toward the $1,690 resistance.

An upside break above the $1,690 resistance might call for more gains in the coming sessions. In the stated case, Ether could rise toward the $1,750 resistance zone or even $1,800 in the near term.
More Losses In ETH?
If Ethereum fails to clear the $1,640 resistance, it could start another decline. Initial support on the downside is near the $1,580 level. The first major support sits near the $1,555 zone and the 61.8% Fib retracement level of the upward move from the $1,472 swing low to the $1,690 high.
A clear move below the $1,555 support might push the price toward the $1,525 support. Any more losses might send the price toward the $1,450 support level in the near term. The next key support sits at $1,420.
Technical Indicators
Hourly MACD – The MACD for ETH/USD is gaining momentum in the bearish zone.
Hourly RSI – The RSI for ETH/USD is now below the 50 zone.
Major Support Level – $1,580
Major Resistance Level – $1,640

BNB Burn Reduces Circulating Supply by $916 Million

Ethereum Breakout Imminent? Analyst Expects ETH Price Surge To $2,000

Gold Price Hits New All-Time High Above $3,300 Amid Tariff Turmoil

Ethereum Price Dips Again—Time to Panic or Opportunity to Buy?

Did Ethereum Survive The Storm? Analyst Eyes Breakout Next

Bitcoin & Others Slip As Trump Imposes Up To 245% Tariff On China

2.52 Million Altcoins Are Ruining Crypto’s Future

Animoca Brands Valuation Tanks 75% In Two Years, Here’s Why

Crypto exchange BingX hacked for $43 million

Are The Big Players Losing Interest?

Hong Kong’s Securities Association Tips Authorities On Crypto Self-Regulation

Coinbase cbBTC Set to go Live on Solana
2.52 Million Altcoins Are Ruining Crypto’s Future
Animoca Brands Valuation Tanks 75% In Two Years, Here’s Why
Crypto exchange BingX hacked for $43 million
Are The Big Players Losing Interest?
Hong Kong’s Securities Association Tips Authorities On Crypto Self-Regulation
Coinbase cbBTC Set to go Live on Solana
-

 Market17 hours ago
Bitcoin Eyes $90,000, But Key Resistance Levels Loom
-

 Market24 hours ago
Pi Network Price Rise To $1 is Now In The Hands Of Bitcoin
-

 Altcoin21 hours ago
Whispers Of Insider Selling As Mantra DAO Relocates Nearly $27 Million In OM To Binance
-

 Market20 hours ago
Trump Family Plans Crypto Game Inspired by Monopoly
-

 Market19 hours ago
ETH Retail Traders Boost Demand Despite Institutional Outflows
-
 Altcoin19 hours ago
Could Tomorrow’s Canada Solana ETF Launch Push SOL Price to $200?
-
 Altcoin24 hours ago
Has XRP Price Already Bottomed? Analyst On How Ripple Coin Can Hit $15
-

 Market21 hours ago
Forget XRP At $3, Analyst Reveals How High Price Will Be In A Few Months
