
Market
Nigeria Turns to Crypto to Combat Inflation and Naira Devaluation

Nigeria recently faced one of the most severe economic crises. Inflation surged to record highs towards the end of 2024. Despite some level of easing, citizens still endure inflationary pressures.
Meanwhile, the Nigerian government is accelerating efforts to regulate cryptocurrency transactions. Prospects are that interventions could boost revenue for the country.
Nigeria Faces Inflationary Pressures
Nigeria, Africa’s most populous nation and largest economy, has long struggled with economic instability. Sources indicate its annual inflation rate soared to 24.48% in January 2025 before dropping to 23.18% in February.
The 1.3% decline suggests the government’s monetary tightening measures may be starting to take effect. However, the country’s naira currency has devalued significantly. It lost 230% of its value against the US dollar over the past year.
“The drop in the inflation rate is mainly due to the rebase of the Consumer Price Index (CPI), not an actual reduction in price levels or inflationary pressure,” highlighted one citizen.
It comes as the country’s import-dependent economy is highly vulnerable to external shocks. Against this backdrop, President Bola Tinubu’s administration implemented bold economic reforms to stabilize the economy.
Among them are the removal of decade-long fuel subsidies and the unification of the country’s multiple exchange rates. However, these measures triggered unintended consequences, such as skyrocketing fuel prices and a severe cost-of-living crisis.
The effects of inflation are particularly devastating in conflict-ridden regions where communities rely on subsistence farming for food.
Crypto as a Hedge With New Regulations on the Horizon
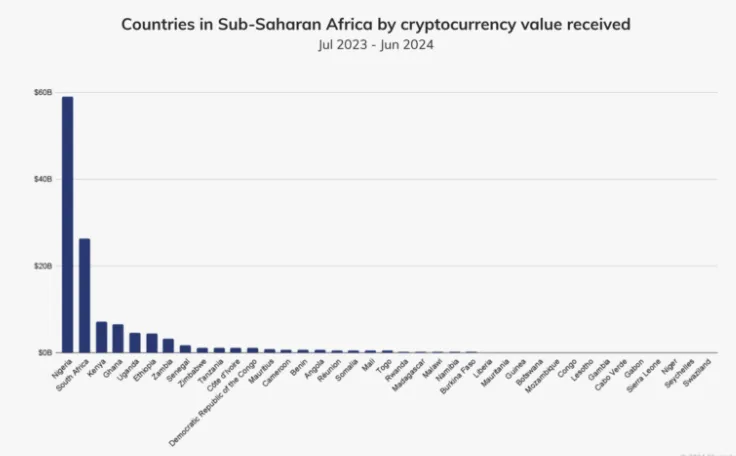
Amid the economic uncertainty, many Nigerians have turned to crypto as a hedge against inflation and currency depreciation. Blockchain analytics firm Chainalysis revealed that between July 2023 and June 2024, Nigerians traded approximately $59 billion in crypto assets.
This surge in crypto adoption reflects a growing distrust in the traditional financial system. It also suggests a desire for more stable and accessible financial alternatives.
Nigerian authorities are finalizing new regulations in response to the rise in crypto adoption. They want to integrate digital asset transactions into the formal economy.
The Nigerian SEC (Securities and Exchange Commission) is drafting policies to ensure all eligible transactions on regulated exchanges are incorporated into the country’s tax network.
A proposed bill outlining taxation policies for crypto transactions and other digital assets is under legislative review. The general sentiment is that it will pass within the first quarter (Q1) of 2025.
Meanwhile, the Central Bank of Nigeria (CBN) is stabilizing the currency and restoring investor confidence. Governor Olayemi Cardoso announced that the bank had cleared $2.5 billion of the foreign exchange backlog, with another $2.2 billion expected to be resolved soon.
Nigeria’s President Tinubu has also ordered the release of food reserves and establishing a commodity board to curb hoarding and stabilize prices.
While Nigeria’s economic crisis leaves millions struggling, the government’s intervention efforts involving crypto taxes and signs of easing inflation suggest a potential turnaround. However, much depends on how effectively authorities implement their policies and whether global economic conditions remain favorable.
At the same time, the country’s cryptocurrency adoption presents both opportunities and challenges. If regulated properly, digital assets could provide Nigerians with financial alternatives that help them navigate economic instability.
Notwithstanding, striking a balance between innovation and regulation will ensure that crypto remains a viable solution rather than a source of new financial risks.
“Currently, Nigeria needs massive investment in both formal and professional education; this is essential to increase our skilled labor force and be competent in today’s global digital economy.Special attention should be paid to areas in Blockchain, Digital Assets, Web3,” one user shared on X.
Disclaimer
In adherence to the Trust Project guidelines, BeInCrypto is committed to unbiased, transparent reporting. This news article aims to provide accurate, timely information. However, readers are advised to verify facts independently and consult with a professional before making any decisions based on this content. Please note that our Terms and Conditions, Privacy Policy, and Disclaimers have been updated.


XRP price started a fresh increase above the $2.20 resistance. The price is now correcting gains and might find bids near the $2.050 zone.
- XRP price started a downside correction from the $2.250 resistance zone.
- The price is now trading below $2.120 and the 100-hourly Simple Moving Average.
- There was a break below a connecting bullish trend line with support at $2.140 on the hourly chart of the XRP/USD pair (data source from Kraken).
- The pair might extend losses if there is a close below the $2.050 support zone.
XRP Price Dips Again
XRP price started a fresh increase above the $1.980 resistance, like Bitcoin and Ethereum. The price climbed above the $2.020 and $2.050 resistance levels.
A high was formed at $2.244 and the price recently started a downside correction. There was a move below the $2.120 support zone. Besides, there was a break below a connecting bullish trend line with support at $2.140 on the hourly chart of the XRP/USD pair.
The price even spiked below the 50% Fib retracement level of the upward move from the $1.920 swing low to the $2.244 high. The price is now trading below $2.120 and the 100-hourly Simple Moving Average.

On the upside, the price might face resistance near the $2.120 level. The first major resistance is near the $2.180 level. The next resistance is $2.20. A clear move above the $2.20 resistance might send the price toward the $2.250 resistance. Any more gains might send the price toward the $2.320 resistance or even $2.350 in the near term. The next major hurdle for the bulls might be $2.50.
Another Decline?
If XRP fails to clear the $2.120 resistance zone, it could start another decline. Initial support on the downside is near the $2.050 level and the 61.8% Fib retracement level of the upward move from the $1.920 swing low to the $2.244 high. The next major support is near the $2.00 level.
If there is a downside break and a close below the $2.00 level, the price might continue to decline toward the $1.920 support. The next major support sits near the $1.840 zone.
Technical Indicators
Hourly MACD – The MACD for XRP/USD is now gaining pace in the bearish zone.
Hourly RSI (Relative Strength Index) – The RSI for XRP/USD is now below the 50 level.
Major Support Levels – $2.050 and $2.00.
Major Resistance Levels – $2.120 and $2.180.

In Q1 2025, Ethereum solidified its leading position in the decentralized application (DApp) platform sector, generating $1.021 billion in fee revenue.
Other networks such as Base (Coinbase’s Layer-2), BNB Chain, Arbitrum, and Avalanche C-Chain also recorded significant revenue but lagged far behind Ethereum.
Fee Revenue Landscape Among Blockchains
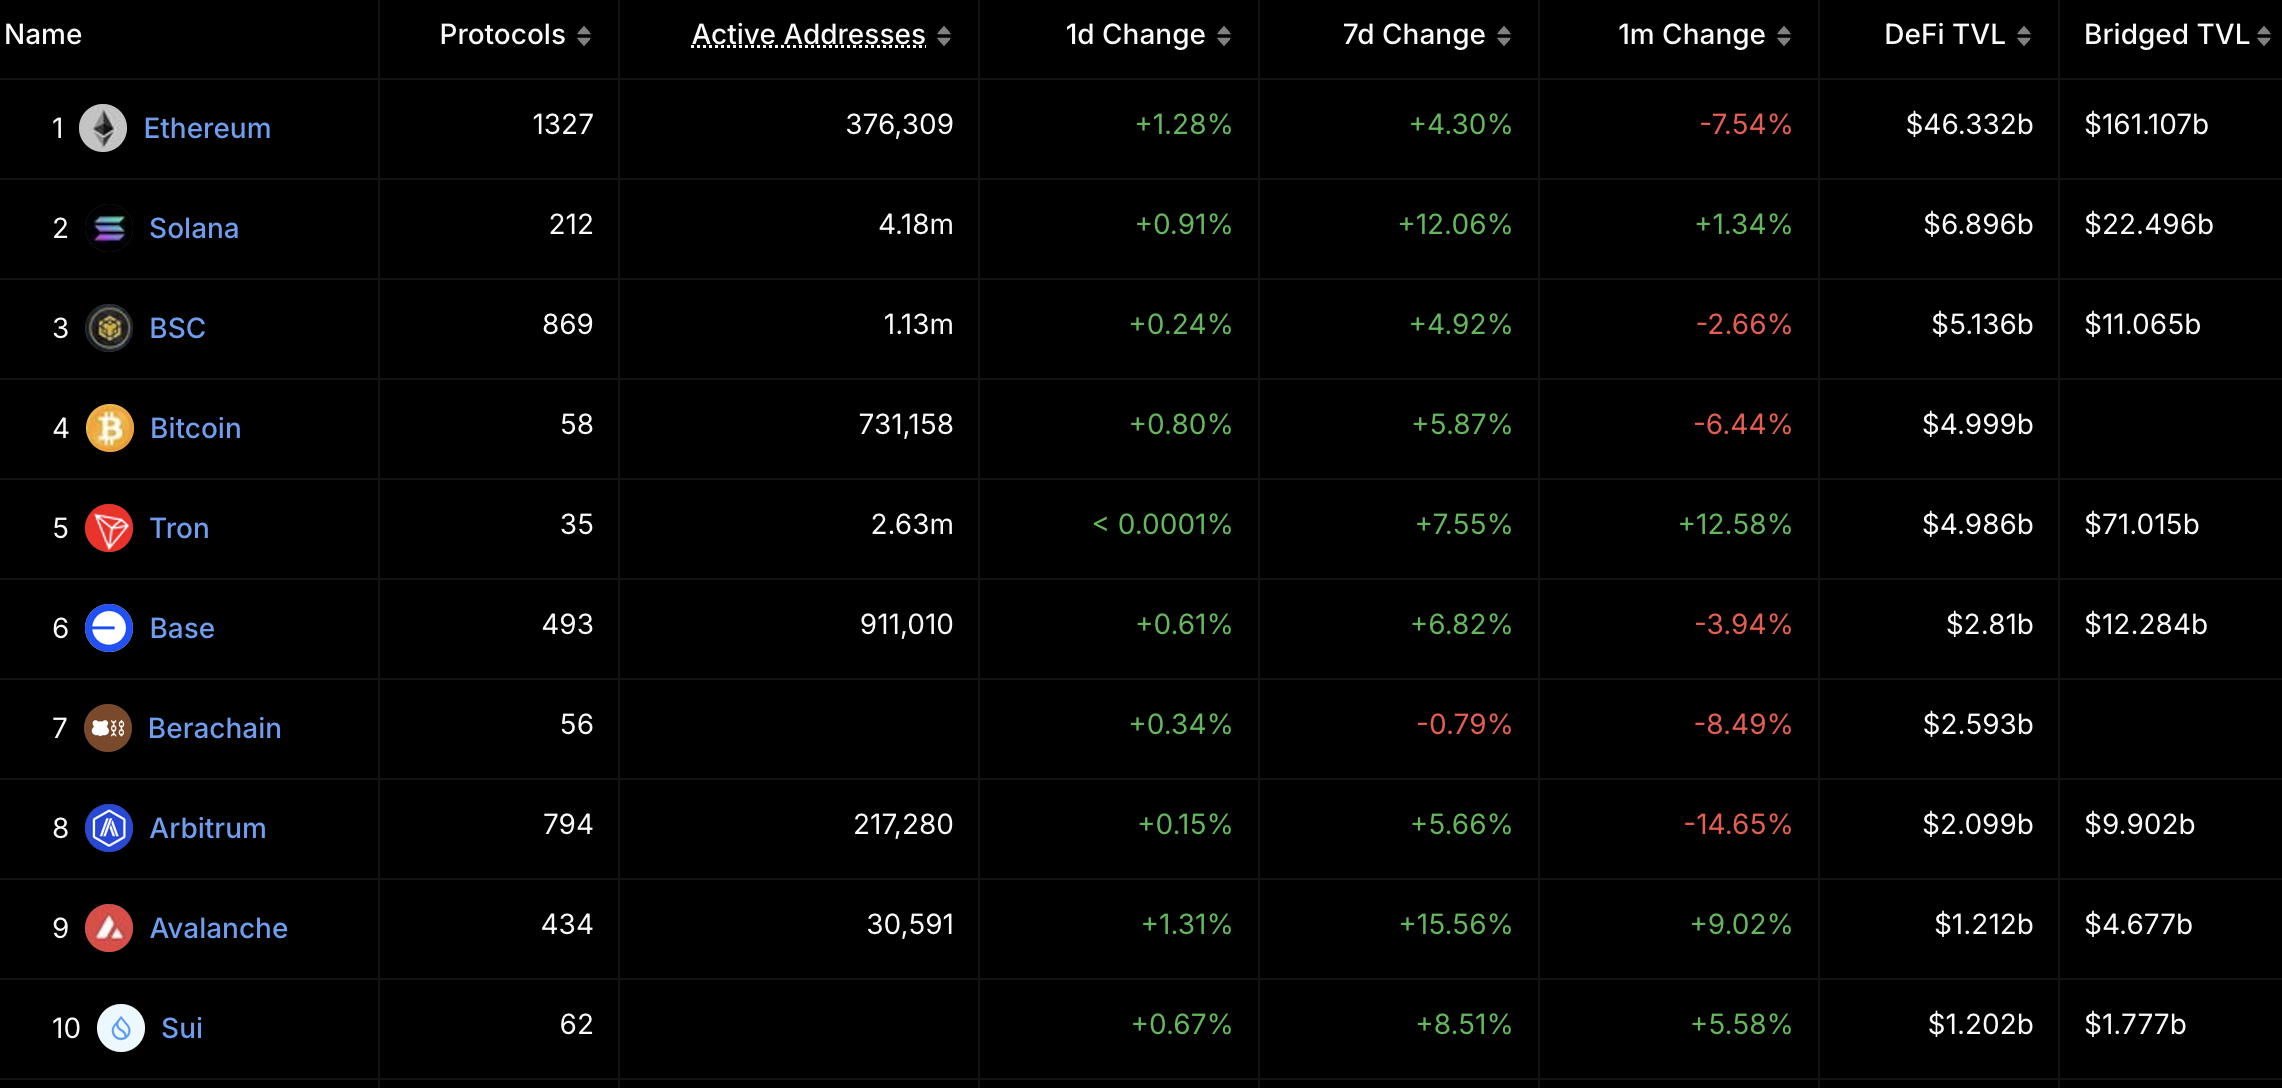
According to Token Terminal, Ethereum maintained its top position among DApp platforms, with DApp fee revenue reaching $1.021 billion in Q1 2025. This figure highlights Ethereum’s dominance and strong growth within the DApp ecosystem.

Base, a Coinbase Layer-2 network, ranked second with $193 million in DApp fee revenue, showing notable growth but still trailing Ethereum. BNB Chain followed in third with $170 million, Arbitrum with $73.8 million, and Avalanche C-Chain in fifth with $27.68 million.
DApp fee revenue is a key metric for measuring a blockchain’s activity and user value. On Ethereum, popular DApps include DeFi protocols like Uniswap and Aave, NFT platforms like OpenSea, blockchain games, and social applications. The growth in Ethereum’s DApp fee revenue indicates sustained high demand for these applications despite competition from other networks and often high transaction costs (gas fees) on the mainnet.
Why Ethereum Leads
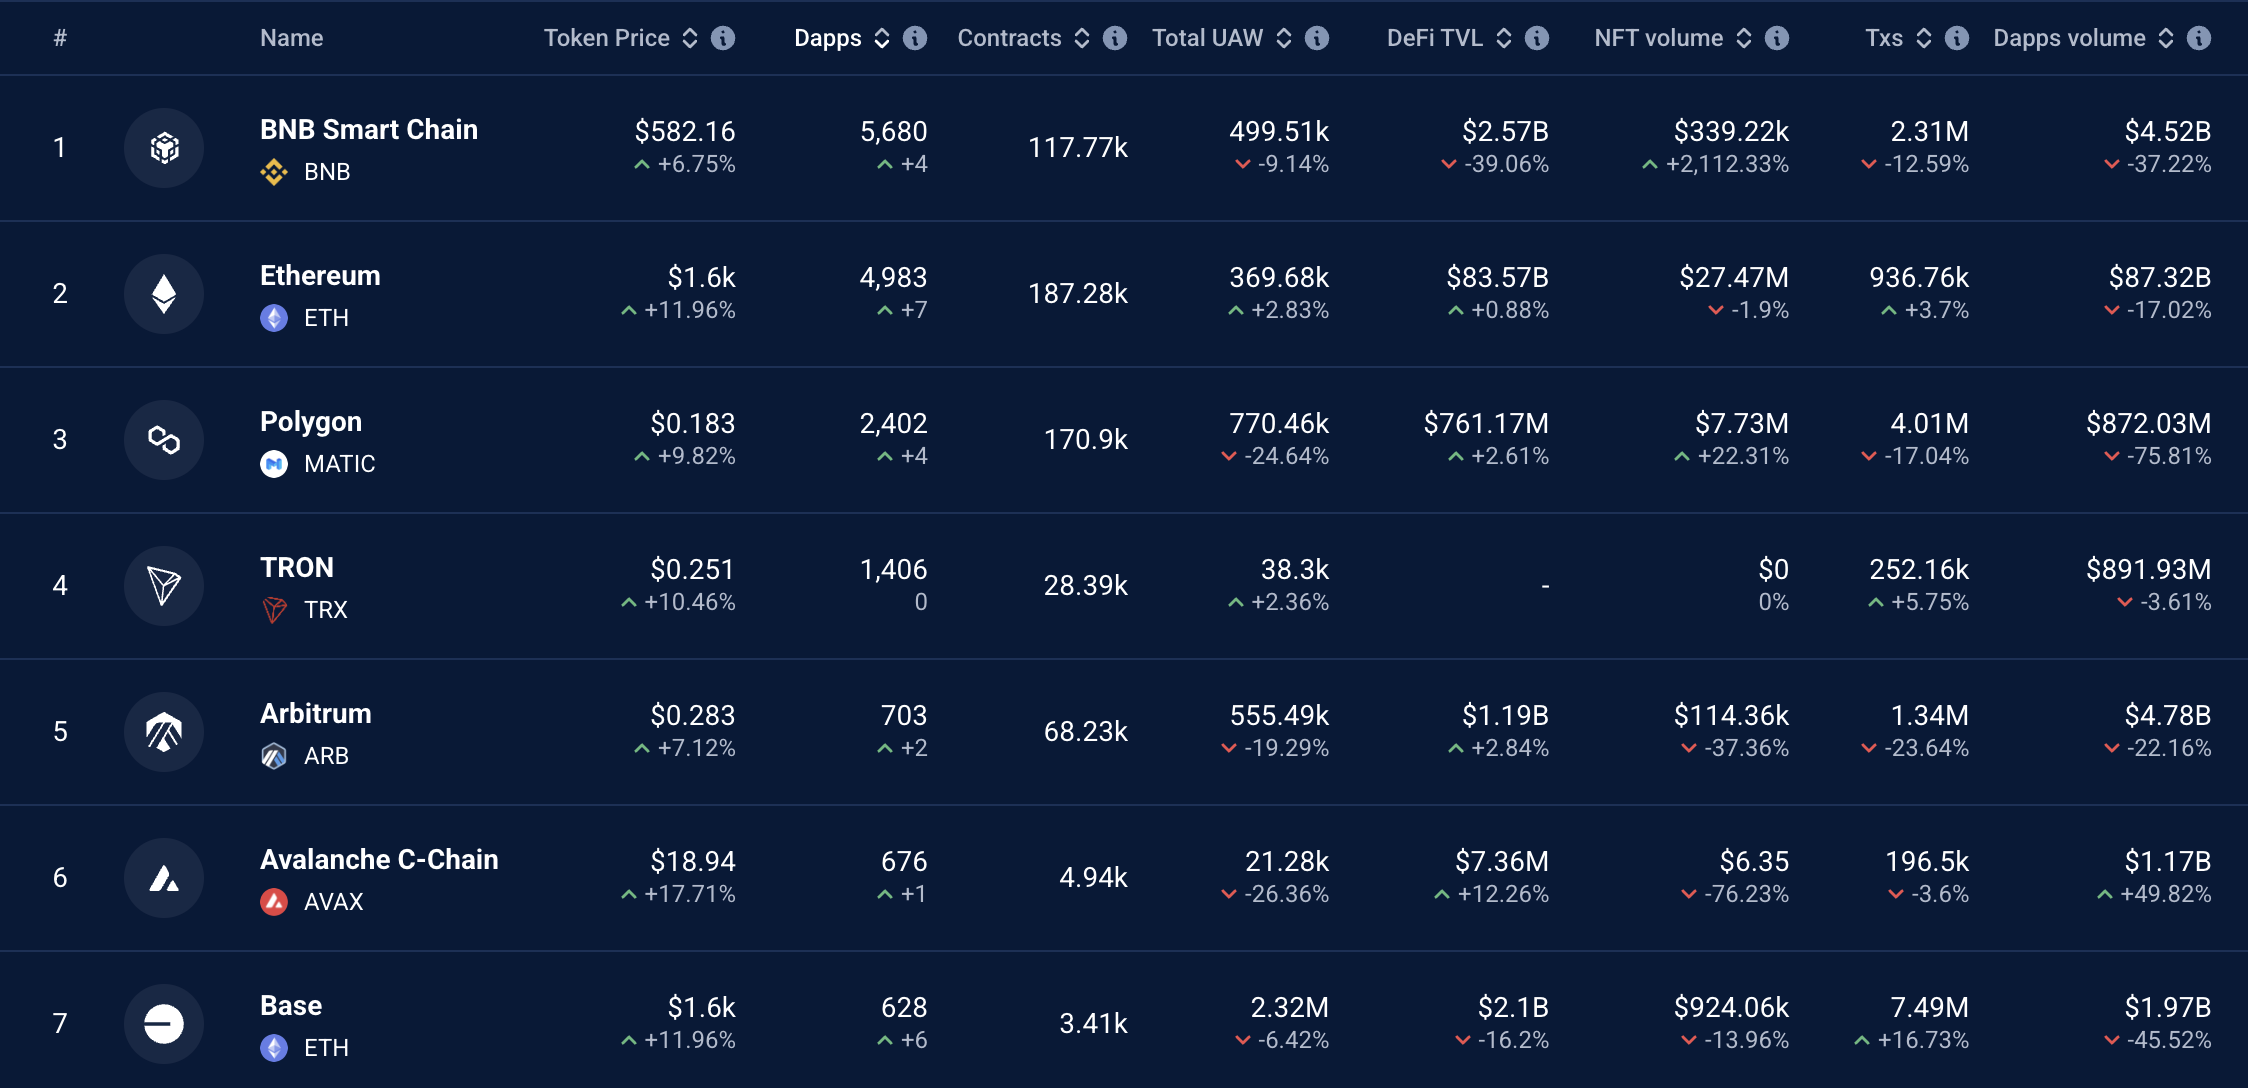
Several factors explain Ethereum’s continued leadership in DApp fee revenue. Firstly, Ethereum was the first blockchain to support smart contracts, laying the foundation for its DApp ecosystem. According to DappRadar data, Ethereum remains the blockchain with the largest DApps, hosting over 4,983 active DApps, below the BNB Chain.
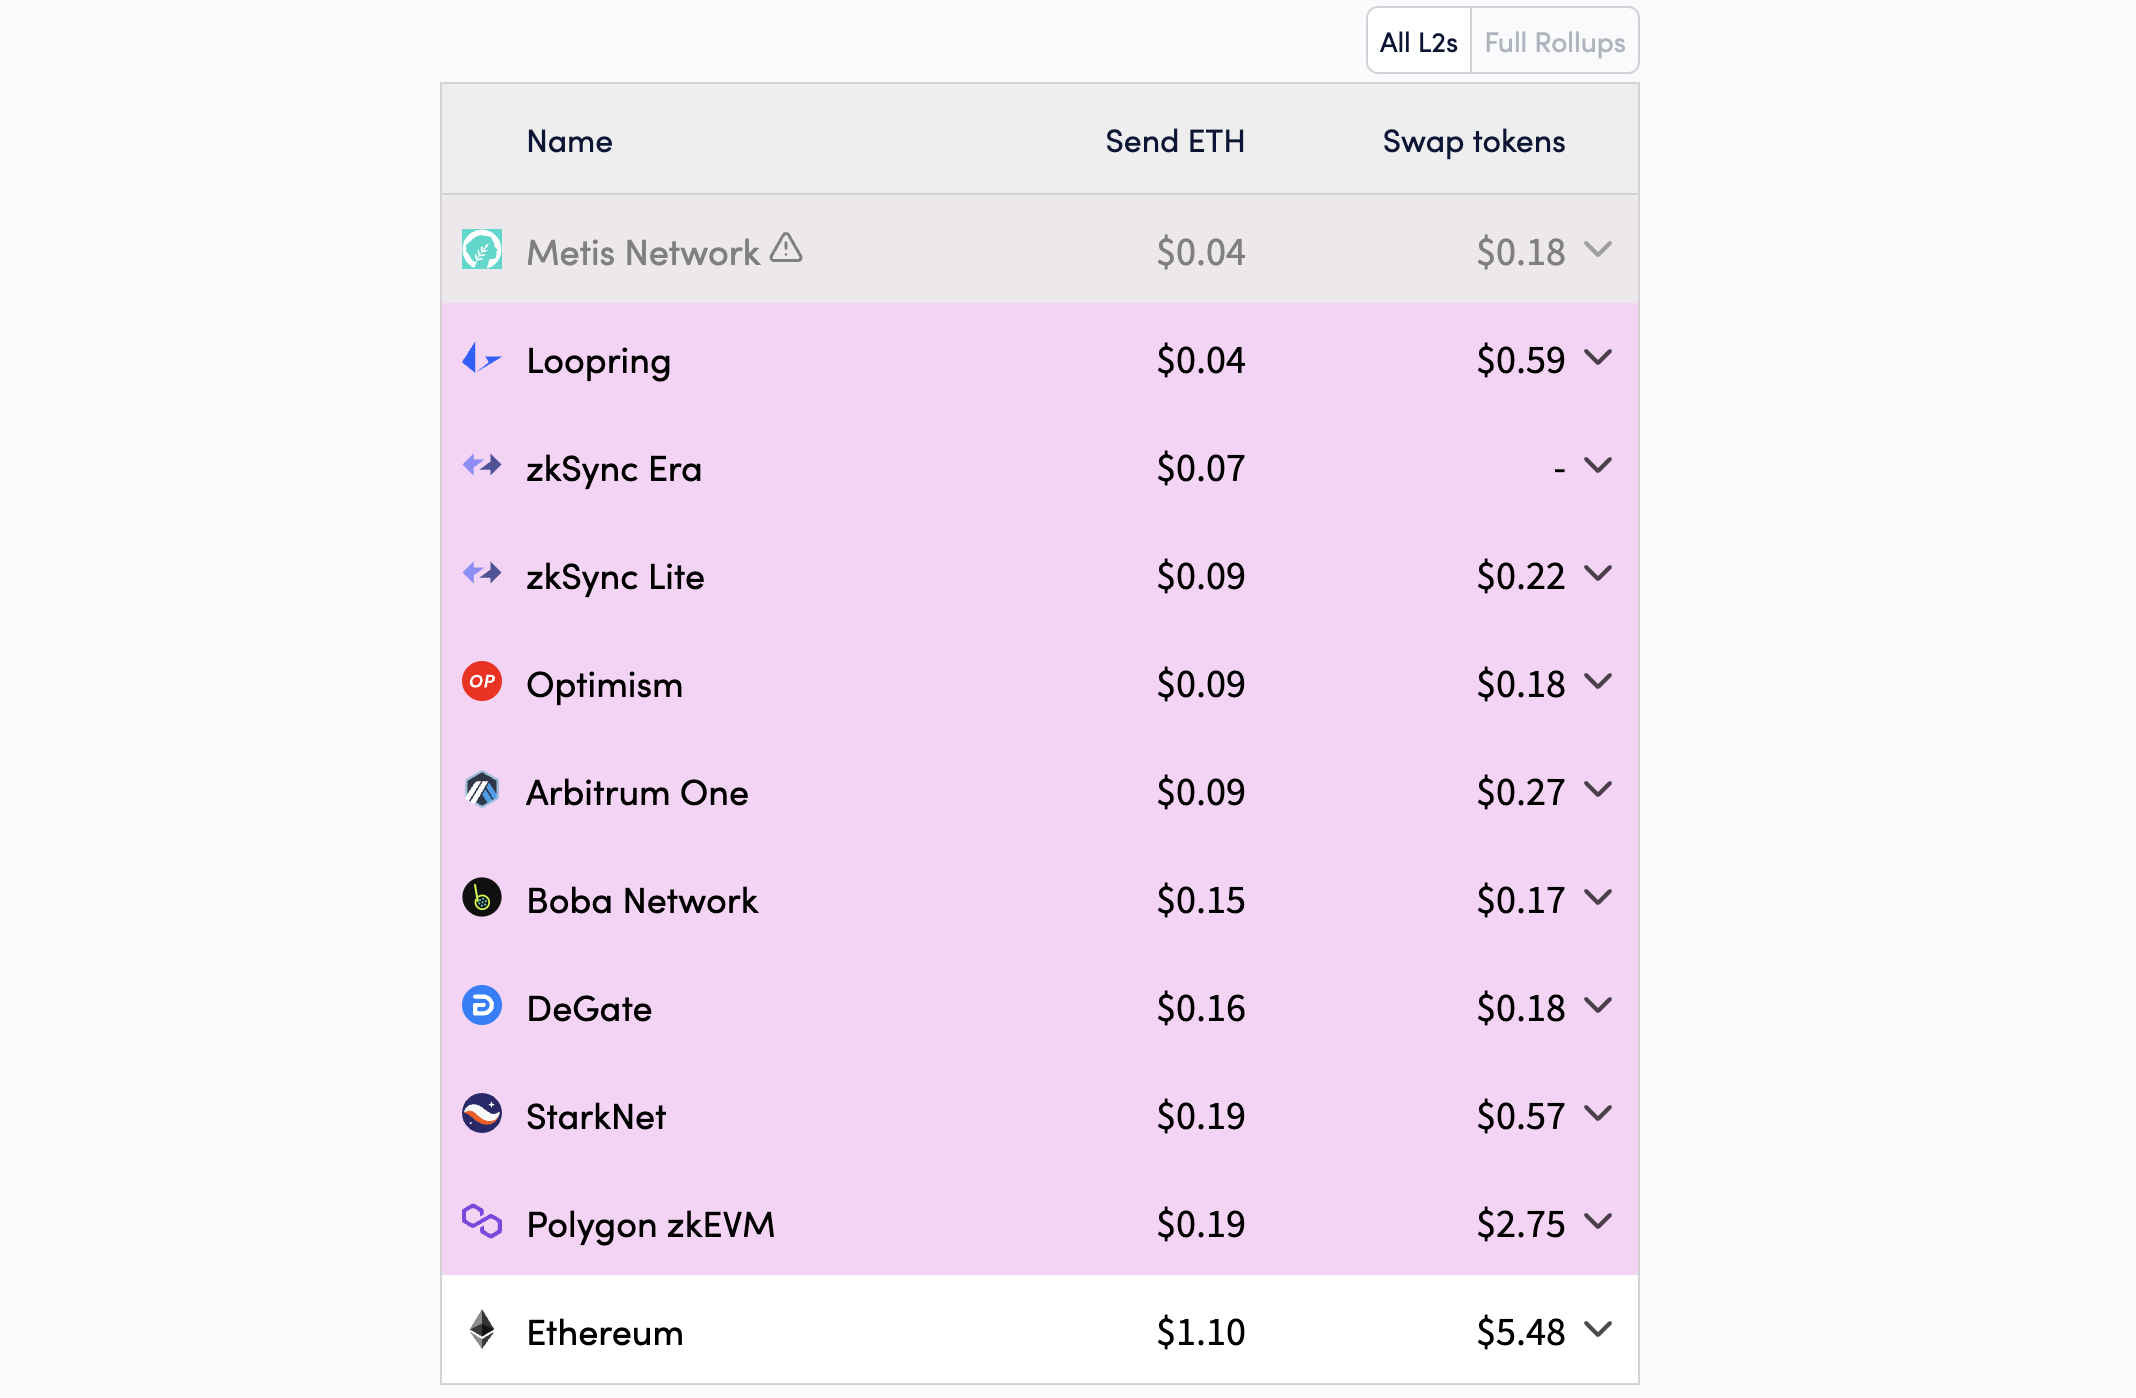
Second, Ethereum’s high security and reliability make it the preferred choice for developers and users. Despite high mainnet transaction costs, Ethereum has improved performance through upgrades like Dencun (implemented in 2024), which reduced costs on Layer-2 networks and enhanced scalability.
Third, Ethereum’s DeFi ecosystem remains a primary driver of fee revenue. According to DefiLlama, the Total Value Locked (TVL) in Ethereum’s DeFi protocols reached $46 billion, representing 51% of the total TVL in the DeFi market.
While Ethereum leads, other networks are also showing significant growth. According to Token Terminal, Base, Coinbase’s Layer-2, generated $193 million in DApp fee revenue, a 45% increase from Q4 2024.
BNB Chain, with $170 million, remains a strong competitor due to low costs and a diverse DApp ecosystem, including platforms like PancakeSwap. Arbitrum, another Ethereum Layer-2, recorded $73.8 million, driven by the expansion of DeFi and blockchain gaming DApps. With $27.68 million, Avalanche C-Chain excels in finance and NFTs but cannot match Ethereum’s scale.
Disclaimer
In adherence to the Trust Project guidelines, BeInCrypto is committed to unbiased, transparent reporting. This news article aims to provide accurate, timely information. However, readers are advised to verify facts independently and consult with a professional before making any decisions based on this content. Please note that our Terms and Conditions, Privacy Policy, and Disclaimers have been updated.
Reason to trust
![]()
Strict editorial policy that focuses on accuracy, relevance, and impartiality
Created by industry experts and meticulously reviewed
The highest standards in reporting and publishing
Strict editorial policy that focuses on accuracy, relevance, and impartiality
Morbi pretium leo et nisl aliquam mollis. Quisque arcu lorem, ultricies quis pellentesque nec, ullamcorper eu odio.
Bitcoin price started a fresh decline from the $86,500 zone. BTC is now consolidating and might continue to decline below the $83,200 support.
- Bitcoin started a fresh decline from the $86,500 zone.
- The price is trading below $85,000 and the 100 hourly Simple moving average.
- There was a break below a connecting bullish trend line with support at $84,500 on the hourly chart of the BTC/USD pair (data feed from Kraken).
- The pair could start another increase if it clears the $84,500 zone.
Bitcoin Price Faces Rejection
Bitcoin price started a fresh increase above the $83,500 zone. BTC formed a base and gained pace for a move above the $84,000 and $85,500 resistance levels.
The bulls pumped the price above the $86,000 resistance. A high was formed at $86,401 and the price recently corrected some gains. There was a move below the $85,000 support. Besides, there was a break below a connecting bullish trend line with support at $84,500 on the hourly chart of the BTC/USD pair.
The price tested the $83,200 support. Bitcoin price is now trading below $85,000 and the 100 hourly Simple moving average. On the upside, immediate resistance is near the $84,000 level and the 23.6% Fib retracement level of the downward move from the $86,401 swing high to the $83,171 low.
The first key resistance is near the $84,500 level. The next key resistance could be $84,750 and the 50% Fib retracement level of the downward move from the $86,401 swing high to the $83,171 low.

A close above the $84,750 resistance might send the price further higher. In the stated case, the price could rise and test the $85,500 resistance level. Any more gains might send the price toward the $86,400 level.
Another Decline In BTC?
If Bitcoin fails to rise above the $85,000 resistance zone, it could start another decline. Immediate support on the downside is near the $83,500 level. The first major support is near the $83,200 level.
The next support is now near the $82,200 zone. Any more losses might send the price toward the $81,500 support in the near term. The main support sits at $80,800.
Technical indicators:
Hourly MACD – The MACD is now gaining pace in the bearish zone.
Hourly RSI (Relative Strength Index) – The RSI for BTC/USD is now below the 50 level.
Major Support Levels – $83,200, followed by $82,200.
Major Resistance Levels – $84,750 and $85,500.

Ripple Whale Moves $273M As Analyst Predicts XRP Price Crash To $1.90

XRP Price Pulls Back: Healthy Correction or Start of a Fresh Downtrend?

Ethereum Leads Q1 2025 DApp Fees With $1.02 Billion

Bitcoin Price on The Brink? Signs Point to Renewed Decline

3 US Crypto Stocks to Watch Today: CORZ, MSTR, and COIN

Ethena Labs Leaves EU Market Over MiCA Compliance

2.52 Million Altcoins Are Ruining Crypto’s Future

Animoca Brands Valuation Tanks 75% In Two Years, Here’s Why

Crypto exchange BingX hacked for $43 million

Are The Big Players Losing Interest?

Hong Kong’s Securities Association Tips Authorities On Crypto Self-Regulation

Coinbase cbBTC Set to go Live on Solana
2.52 Million Altcoins Are Ruining Crypto’s Future
Animoca Brands Valuation Tanks 75% In Two Years, Here’s Why
Crypto exchange BingX hacked for $43 million
Are The Big Players Losing Interest?
Hong Kong’s Securities Association Tips Authorities On Crypto Self-Regulation
Coinbase cbBTC Set to go Live on Solana
-

 Market20 hours ago
Can Pi Network Avoid a Similar Fate?
-

 Market23 hours ago
XRP Price Could Regain Momentum—Is a Bullish Reversal in Sight?
-

 Ethereum24 hours ago
SEC Delays Decision On Staking For Grayscale’s Ethereum ETFs
-

 Market22 hours ago
Cardano Buyers Eye $0.70 as ADA Rallies 10%
-
 Bitcoin21 hours ago
Bitcoin Poised for Summer Rally as Gold Leads and Liquidity Peaks
-
 Altcoin20 hours ago
Binance Delists This Crypto Causing 40% Price Crash, Here’s All
-

 Market19 hours ago
Ethereum Price Consolidation Hints at Strength—Is a Move Higher Coming?
-

 Altcoin15 hours ago
Whispers Of Insider Selling As Mantra DAO Relocates Nearly $27 Million In OM To Binance
