Market
Mantle (MNT) Falls 10% as Bybit Hack Rattles Investors

Mantle (MNT) is down more than 10% following the Bybit hack, where roughly $174 million of cmETH – a Mantle-based coin providing liquidity for ETH in the MNT ecosystem – was stolen. The hack, linked to the North Korean Lazarus Group, triggered panic selling, causing MNT’s Relative Strength Index (RSI) to plummet to oversold levels.
Although MNT’s RSI has since rebounded to 39.9, it remains in bearish territory, reflecting cautious sentiment. Additionally, MNT’s Chaikin Money Flow (CMF) is trying to recover but is still deeply negative, while its Exponential Moving Average (EMA) lines suggest persistent downward momentum.
MNT RSI Touched Strong Oversold Levels After Bybit’s Hack
Mantle’s RSI dropped sharply from 54.7 to 22.9 within a few hours following the Bybit hack, where the North Korean hacking group Lazarus stole $1.5 billion, making it the biggest crypto hack ever. Among the assets stolen was cmETH, a Mantle-based coin providing liquidity for ETH in the MNT ecosystem.
This massive outflow of funds triggered panic selling, leading to a significant decline in MNT’s Relative Strength Index (RSI). RSI is a momentum oscillator that measures the speed and change of price movements, typically ranging from 0 to 100.
It is commonly used to identify overbought or oversold conditions, with values above 70 indicating overbought conditions and below 30 suggesting oversold territory. Mantle’s RSI plummeting to 22.9 signaled extreme overselling, reflecting intense bearish sentiment amid the fallout from the hack.

Following this sharp decline, Mantle’s RSI has rebounded to 39.9, showing signs of recovery in the last few hours. An RSI below 30 generally indicates that an asset is oversold and could be due for a price bounce as selling pressure wanes.
Now, with RSI approaching the neutral zone (30-50 range), it suggests that the extreme selling momentum has eased, potentially attracting bargain-hunters or bottom-fishers. If RSI continues to rise, it could indicate growing bullish momentum and a possible reversal in MNT’s price trend.
However, if RSI fails to break above the 50 threshold, it could signify continued uncertainty and a lack of buying strength, leaving MNT vulnerable to further downside risk.
Mantle CMF Is Trying to Recover, But It’s Still Very Negative
MNT’s Chaikin Money Flow (CMF) was already in negative territory before the Bybit hack, reflecting a bearish trend and selling pressure. However, following the hack, MNT’s CMF plunged even further, reaching a negative peak of -0.35 yesterday.
CMF is an indicator that measures the volume-weighted average of accumulation and distribution over a set period. It ranges from -1 to 1, with positive values suggesting buying pressure and accumulation, while negative values indicate selling pressure and distribution.
The sharp decline to -0.35 signaled intense outflows from Mantle. That confirms significant selling momentum amid the heightened market fear and uncertainty triggered by the hack.

After reaching this negative peak, MNT’s CMF has started to recover, currently sitting at -0.24. Although still far from turning positive, this upward movement suggests that selling pressure is gradually easing.
A rising CMF, even while negative, can indicate that bearish momentum is losing steam. If buying volume continues to increase, that could potentially pave the way for a price stabilization or even a reversal. However, as long as CMF remains in negative territory, MNT price is likely to face resistance.
A shift to positive CMF would be a more convincing sign of bullish sentiment returning. That could signal a stronger likelihood of a price recovery.
Mantle Dropped Below $1 For the First Time Since Early February
MNT’s Exponential Moving Average (EMA) lines are currently very bearish, with all short-term EMAs below the long-term ones. This setup indicates strong downward momentum, as recent prices are weaker compared to historical trends.
If this bearish trend continues, MNT could test the support at $0.81.
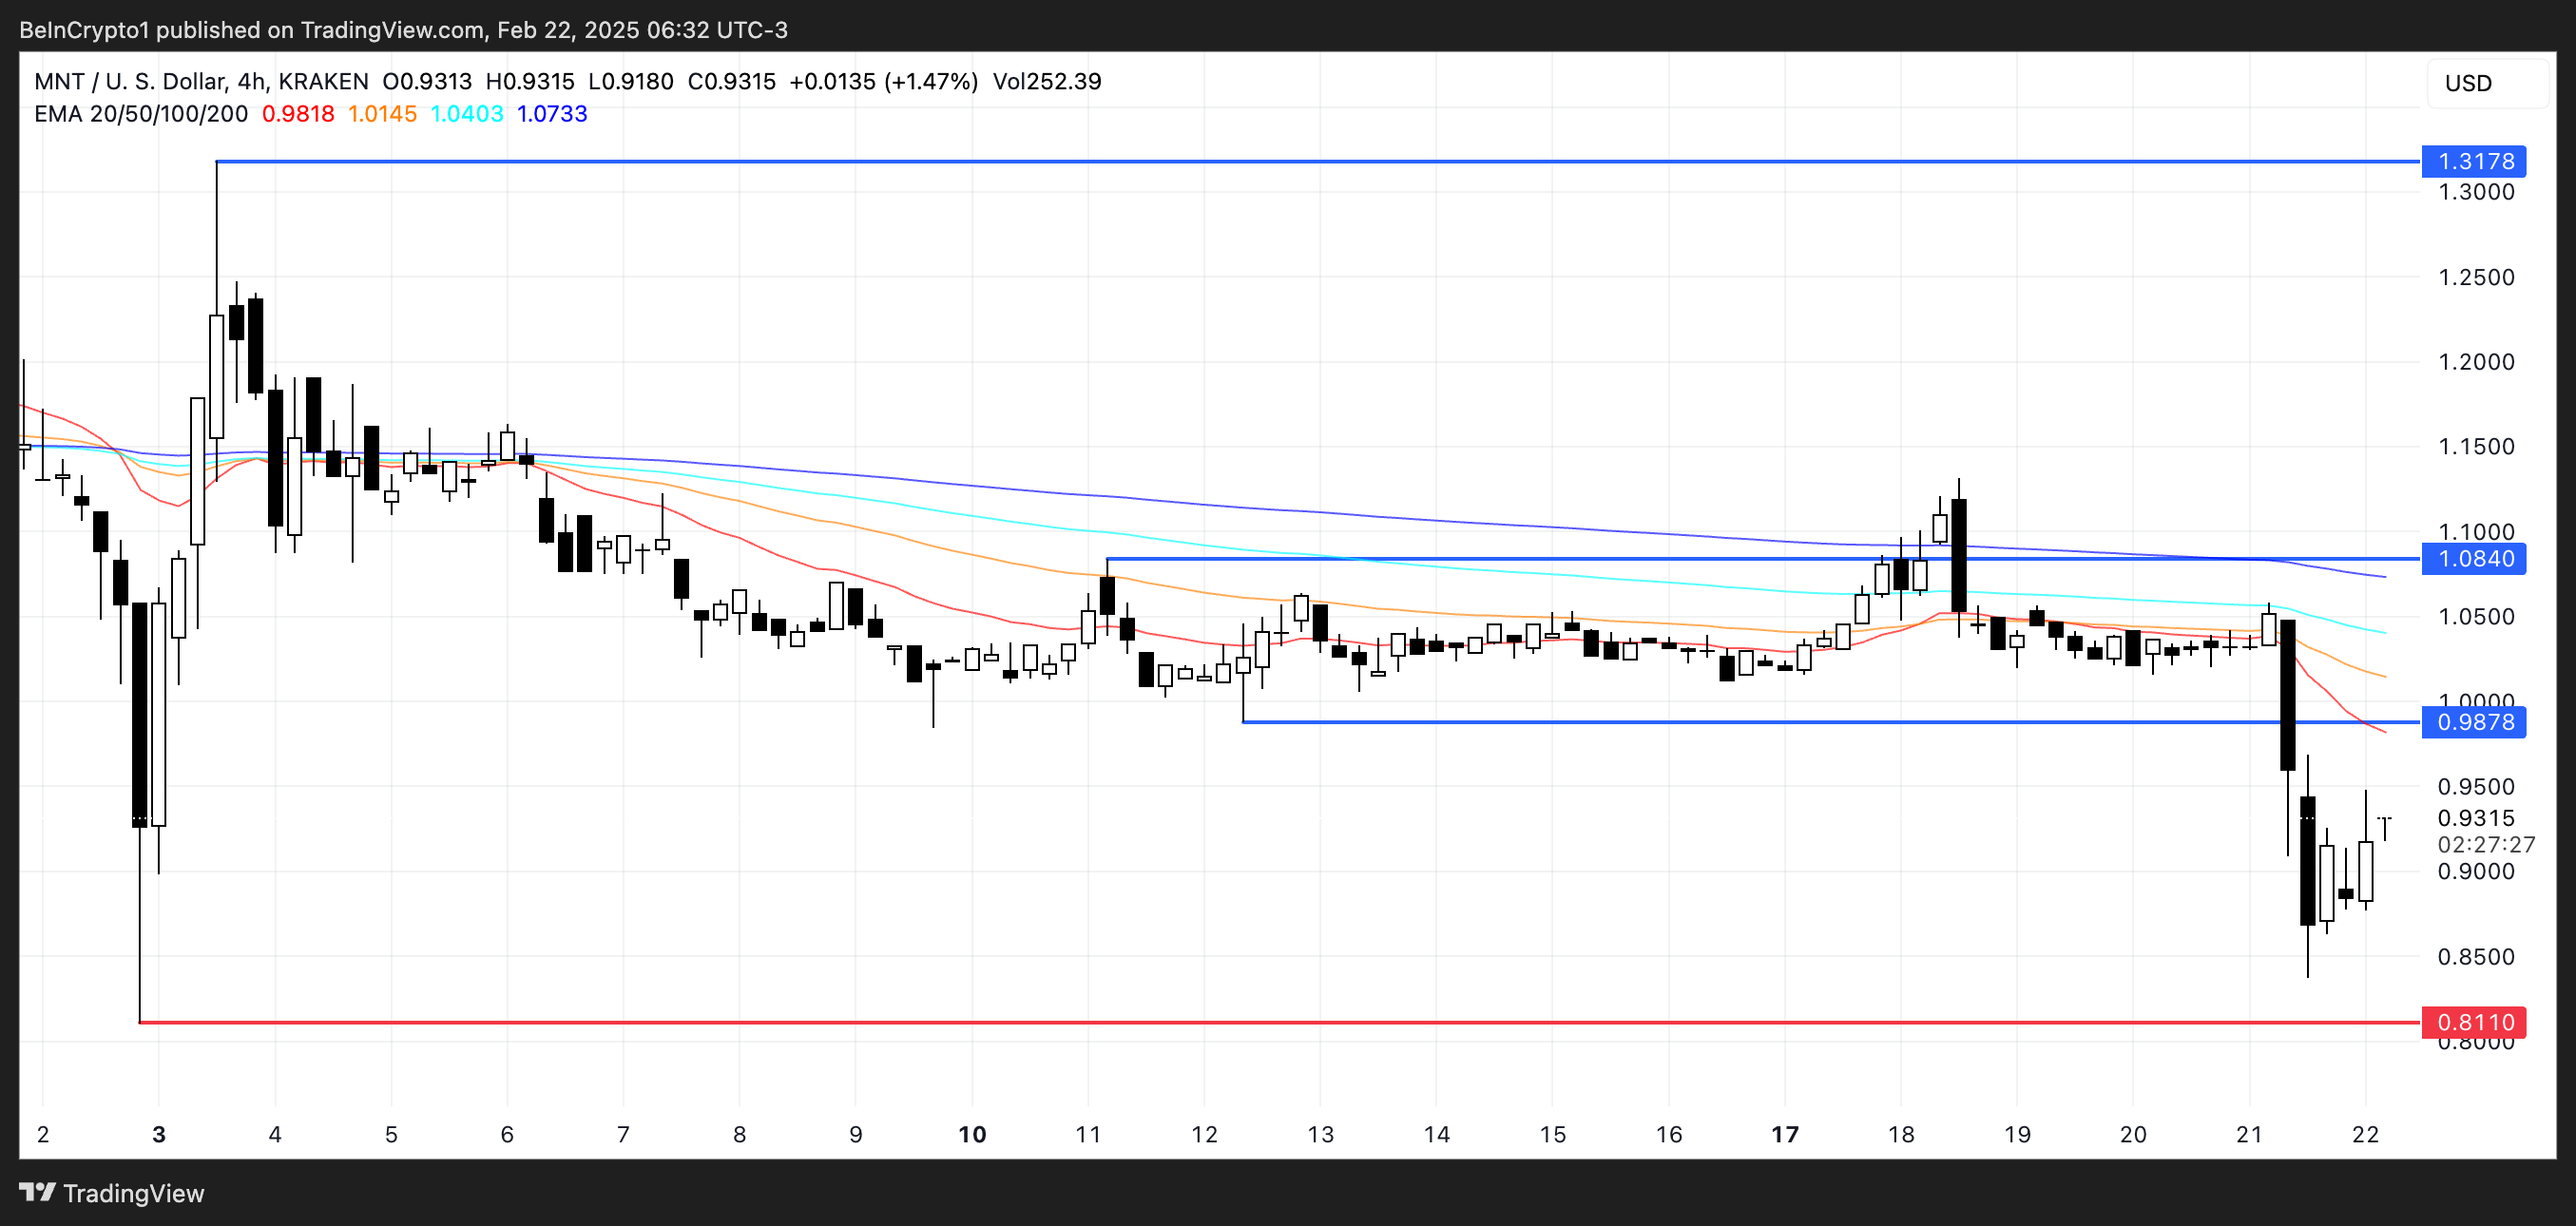
On the other hand, if Mantle starts to recover from the recent drop, it could test the resistance at $0.98. If this level is broken, the next target would be $1.08.
A strong uptrend could push MNT to $1.31, representing a potential 41% upside. However, for this bullish scenario to unfold, short-term EMAs would need to cross above long-term ones, signaling renewed buying momentum.
Disclaimer
In line with the Trust Project guidelines, this price analysis article is for informational purposes only and should not be considered financial or investment advice. BeInCrypto is committed to accurate, unbiased reporting, but market conditions are subject to change without notice. Always conduct your own research and consult with a professional before making any financial decisions. Please note that our Terms and Conditions, Privacy Policy, and Disclaimers have been updated.
Market
HBAR Faces Volatility After Price Failed To Cross The $0.20 Mark

HBAR recently failed to breach the key $0.200 resistance level, leading to increased volatility. Despite this setback, the altcoin may experience a short burst of bullishness in the near future.
While challenges persist, the market may see a brief price surge before further fluctuations take place.
HBAR Is Facing Mixed Signals
The correlation between HBAR and Bitcoin has dropped to 0.8, inching closer to falling into the negative zone. This indicates that HBAR is beginning to decouple from Bitcoin’s movements. If the correlation continues to weaken, HBAR may struggle to benefit from Bitcoin’s recent stabilization above $85,000, as seen in the broader market.
The decline in correlation suggests a shift in market conditions for HBAR. If it no longer follows Bitcoin’s price actions as closely, the altcoin could face additional challenges. With Bitcoin stabilizing, HBAR could find itself in a more isolated market position, hindering its ability to rally alongside Bitcoin.

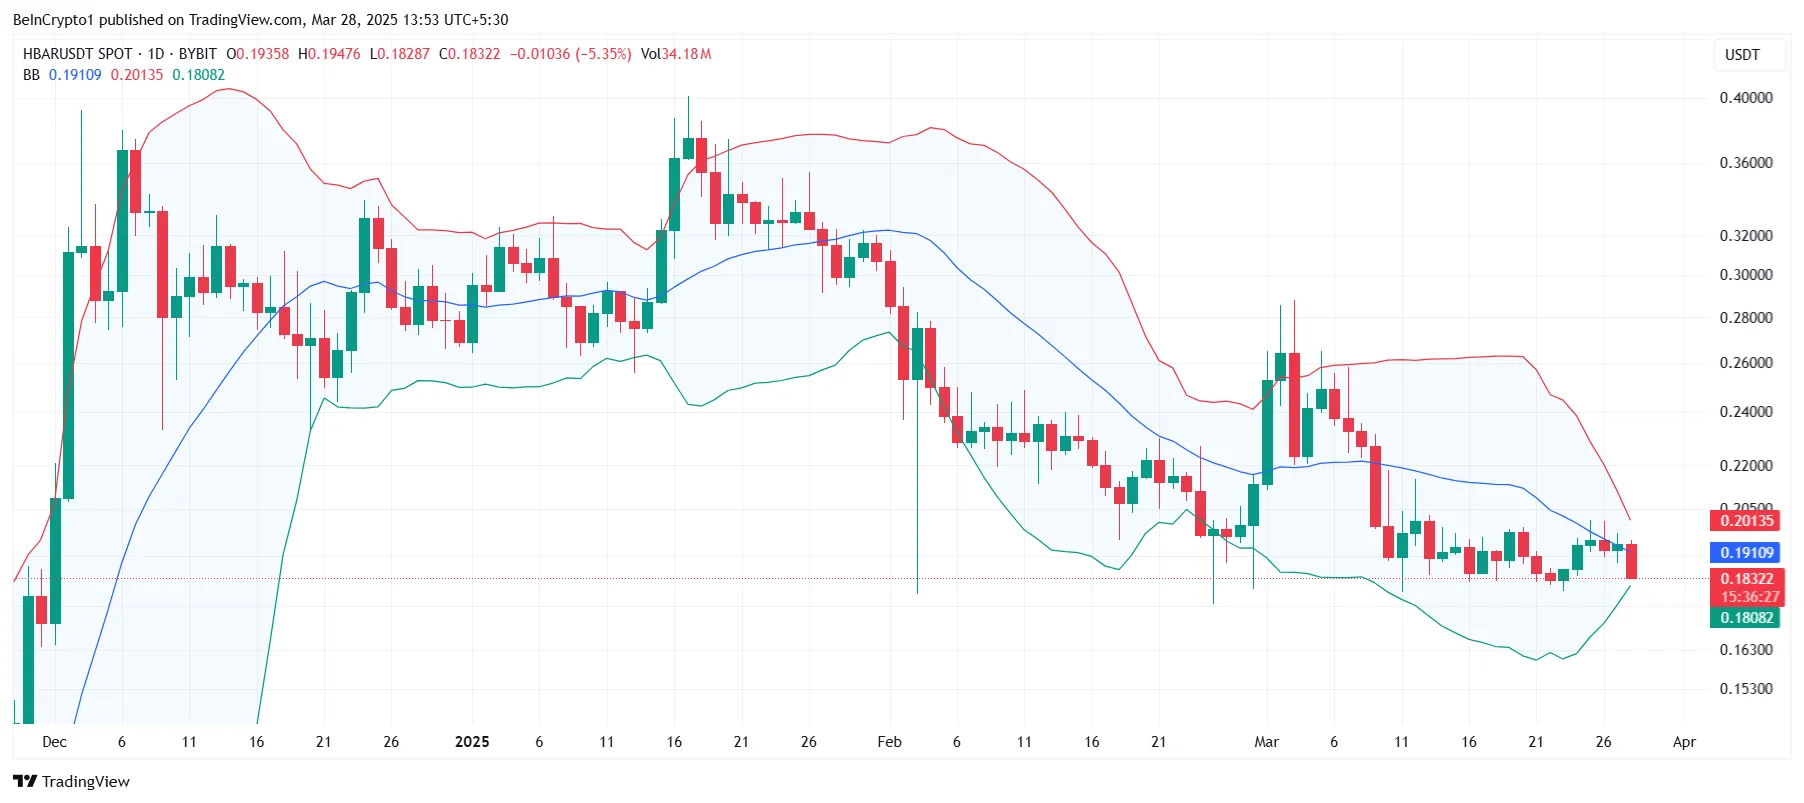
Looking at HBAR’s macro momentum, technical indicators like the Bollinger Bands show signs of a tightening squeeze. This squeeze is often a precursor to a major volatility spike, which is expected to hit HBAR soon. Historically, when the candlestick closes below the basis line during such squeezes, a sharp price surge follows.
As the Bollinger Bands tighten, volatility for HBAR is likely to increase. The squeeze typically leads to a breakout, and in HBAR’s case, a brief surge in price is expected. However, this spike may be short-lived, with the potential for HBAR to experience further challenges after the initial burst of movement.
Can HBAR Price Finally Breach The Key Resistance?
Currently trading at $0.183, HBAR is struggling to breach the $0.200 resistance. However, the altcoin could be on track to break this barrier in the short term. The current market dynamics suggest that a brief surge past $0.20 is likely, offering a potential opportunity for traders.
Given the market factors, HBAR could see a short-term price spike before eventually falling back again. This pattern has been evident since mid-January, and it is expected to repeat. As a result, HBAR could push past the $0.200 resistance and reach $0.222 or $0.250 in the near future.

However, if the declining correlation with Bitcoin continues to weigh on HBAR’s price, the altcoin may struggle to hold above key support levels. A failure to sustain momentum could result in HBAR falling below the $0.177 support, potentially dipping to $0.165. This would invalidate the bullish outlook and reinforce the ongoing bearish trend for the altcoin.
Disclaimer
In line with the Trust Project guidelines, this price analysis article is for informational purposes only and should not be considered financial or investment advice. BeInCrypto is committed to accurate, unbiased reporting, but market conditions are subject to change without notice. Always conduct your own research and consult with a professional before making any financial decisions. Please note that our Terms and Conditions, Privacy Policy, and Disclaimers have been updated.
Market
What to Expect from XRP Price in April 2025

XRP has faced a period of stagnation in recent weeks, with its price struggling to gain significant direction. After a series of recent bullish developments, the altcoin’s macro-scale price action has shown signs of saturation.
Despite the positive catalysts, XRP remains stuck in a consolidation phase, making it difficult to predict its next move. Temujin Louie, CEO of Wanchain, spoke to BeInCrypto about the impact of these external catalysts but leaned towards them failing to trigger any rallies.
“While the SEC dropping its years-long lawsuit against Ripple Labs is undoubtedly a net positive, it hasn’t triggered an immediate surge in XRP’s value because this development doesn’t directly improve utility or drive adoption. XRP remains today as it was before and during the SEC lawsuit,” said Louie.
The ongoing hype and discussions surrounding XRP ETFs have also been impacting the volatility. Investors have been expecting prices to surge owing to the potential of a new XRP ETF.
“Speculation around an XRP ETF hasn’t generated the same excitement as BTC or ETH ETFs. The market’s enthusiasm for crypto ETFs diminishes with each subsequent approval. The 4th, 5th and 6th-approved asset just become one of many, as the novelty of crypto ETFs wears off,” Louie noted.
XRP Is Repeating History
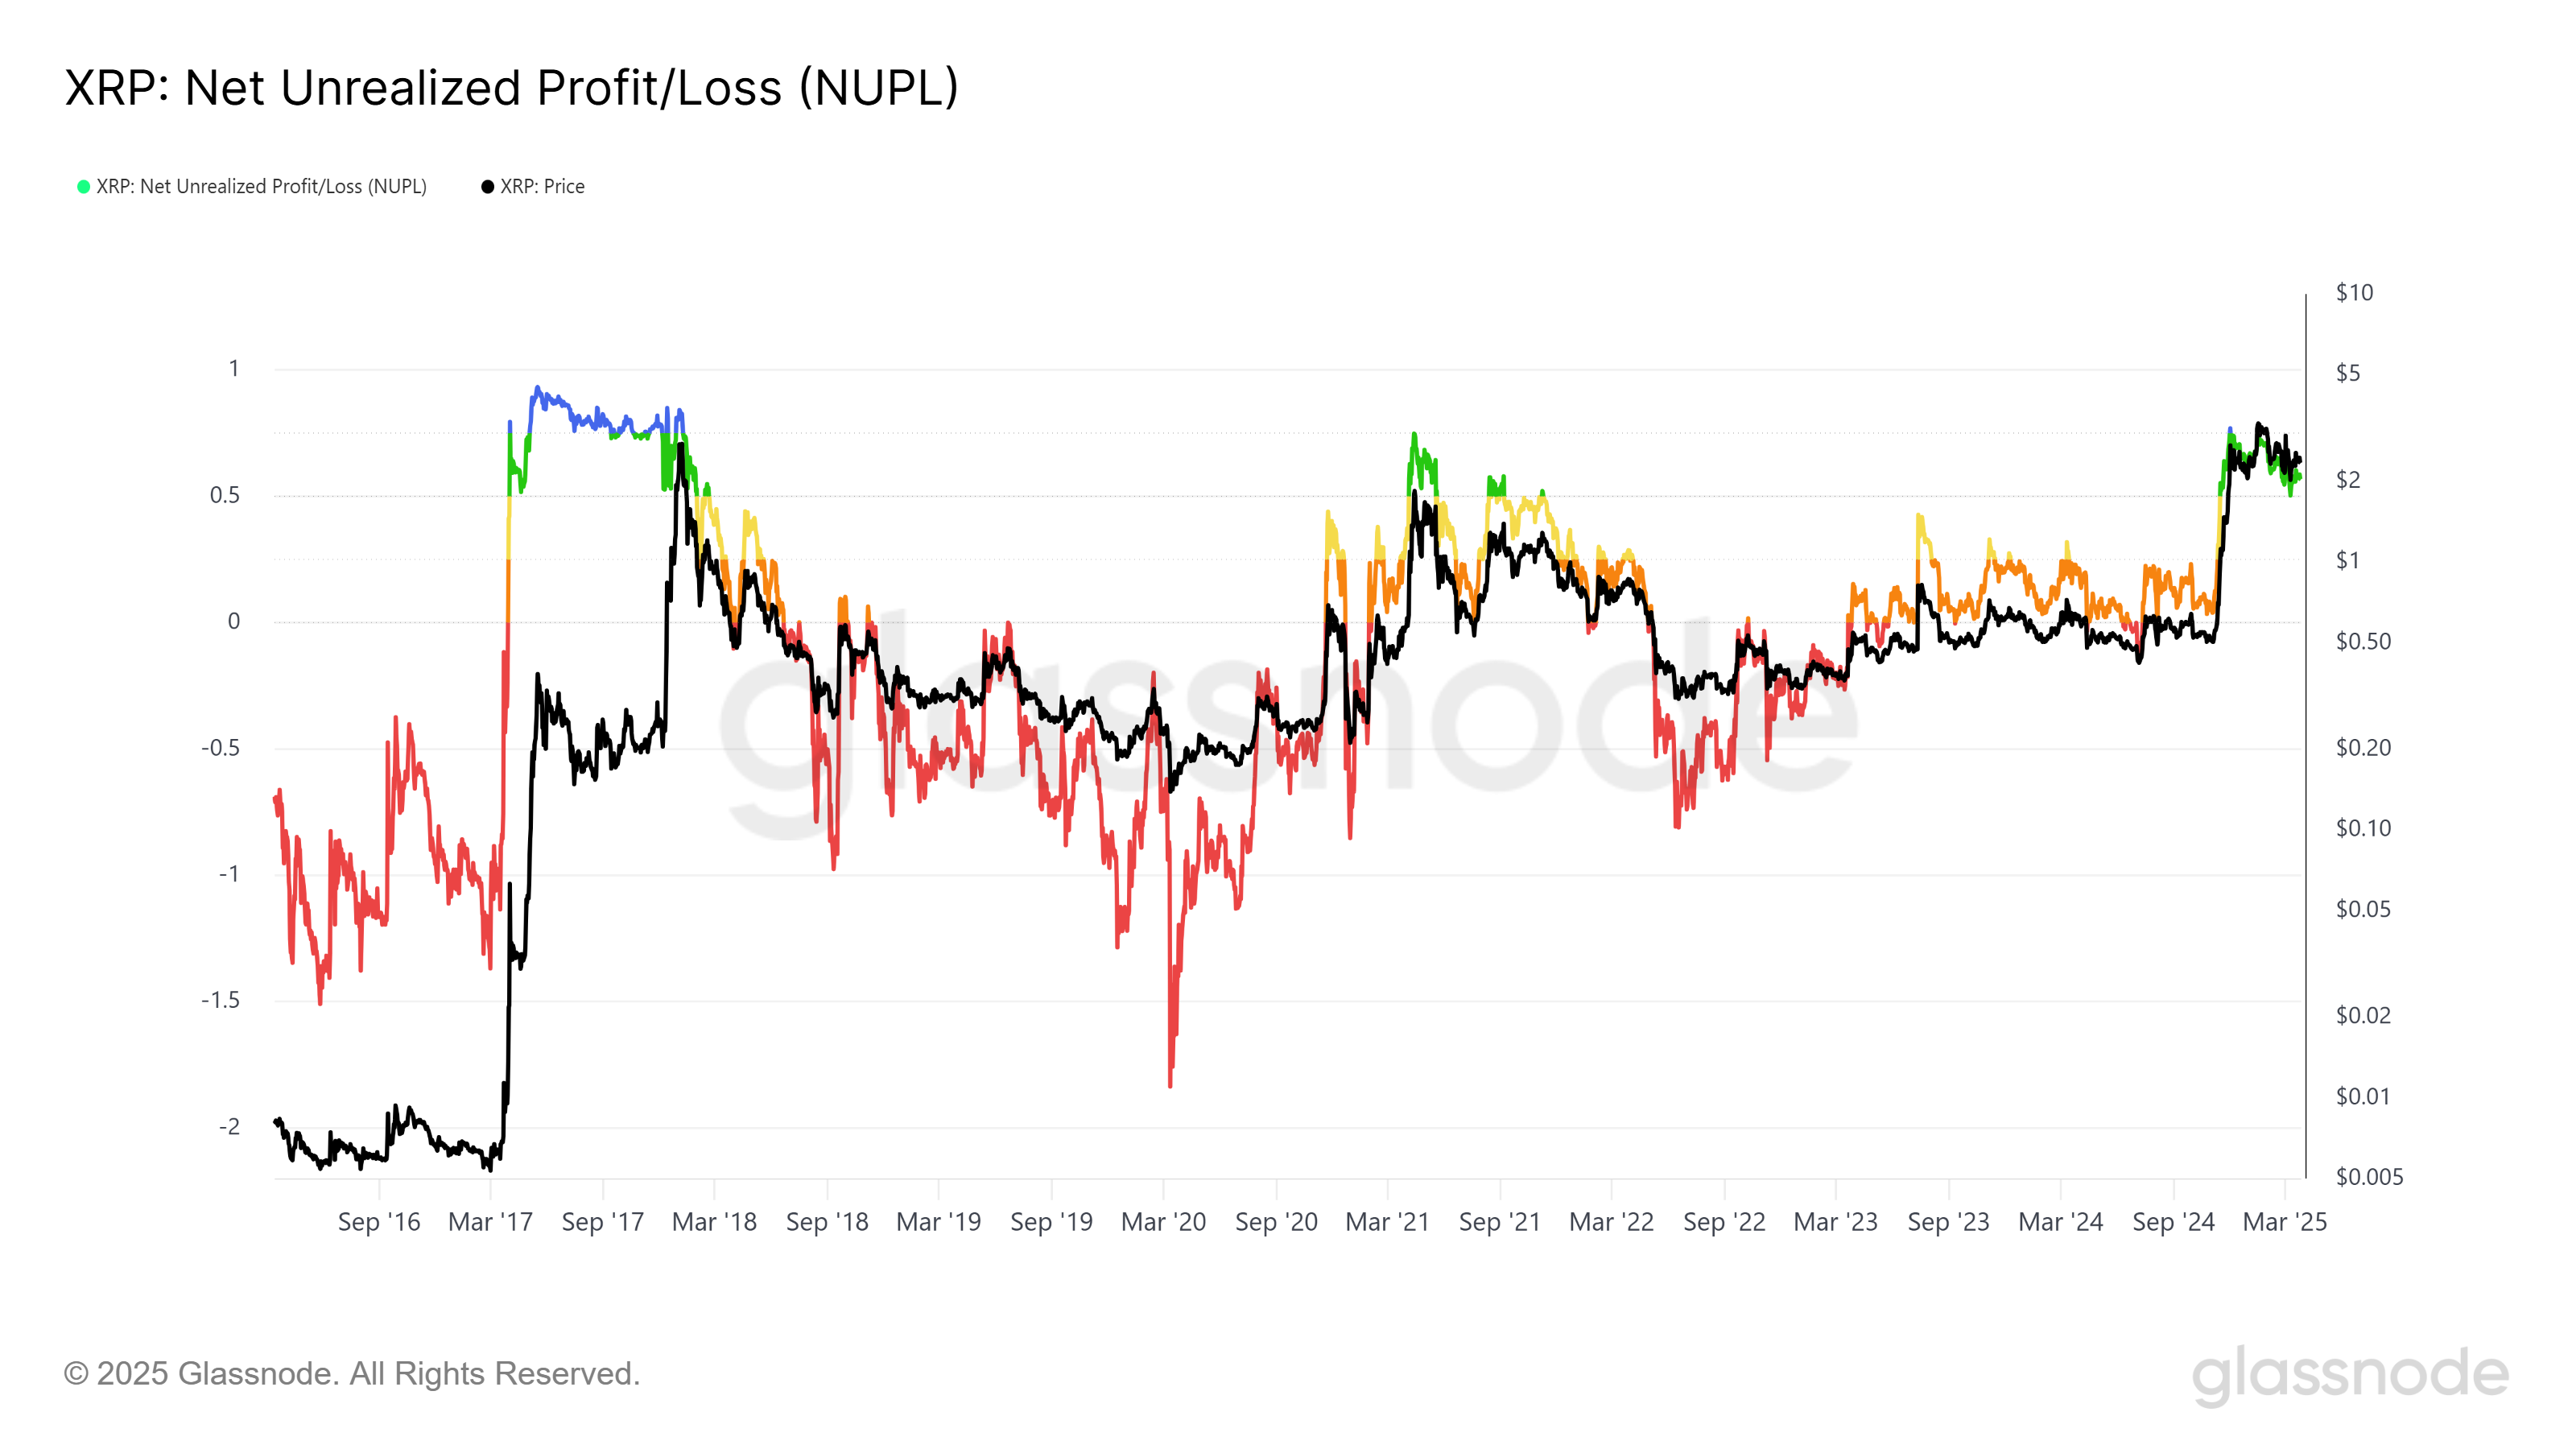
XRP’s Network Utilization and Profit/Loss (NUPL) indicator shows that the altcoin is currently saturating. This suggests that there has been little progress in terms of price movement, and XRP needs strong market cues to take a clear direction. Historically, XRP has experienced similar consolidation phases.
Back in 2017, the coin consolidated for nine months before a massive boom that saw prices surge. However, after breaching key levels, XRP entered a period of consolidation followed by a sharp decline. The same pattern could be happening now, with XRP facing a four-month consolidation period, which may signal a potential correction in the near future.
Following into Bitcoin’s footsteps is another thing that XRP did back in the day, but Hank Huang, Chief Executive Officer at Kronos Research hinted in a different direction.
“Despite its liquidity remaining thin within the altcoin market, lagging behind the depth of Bitcoin. XRP is neither fully following Bitcoin’s ETF-fueled ascent nor carving a clear independent path. The recent Ethereum ETF outflows, observed recently, underscore a market tilt toward Bitcoin, as investors appear to favor BTC’s perceived stability and ‘digital gold’ narrative over altcoins. This shift suggests that bullish sentiment is consolidating around Bitcoin rather than dispersing across the broader altcoin market, leaving XRP struggling to attract the institutional momentum needed to break out of its current rut,” Huang stated.
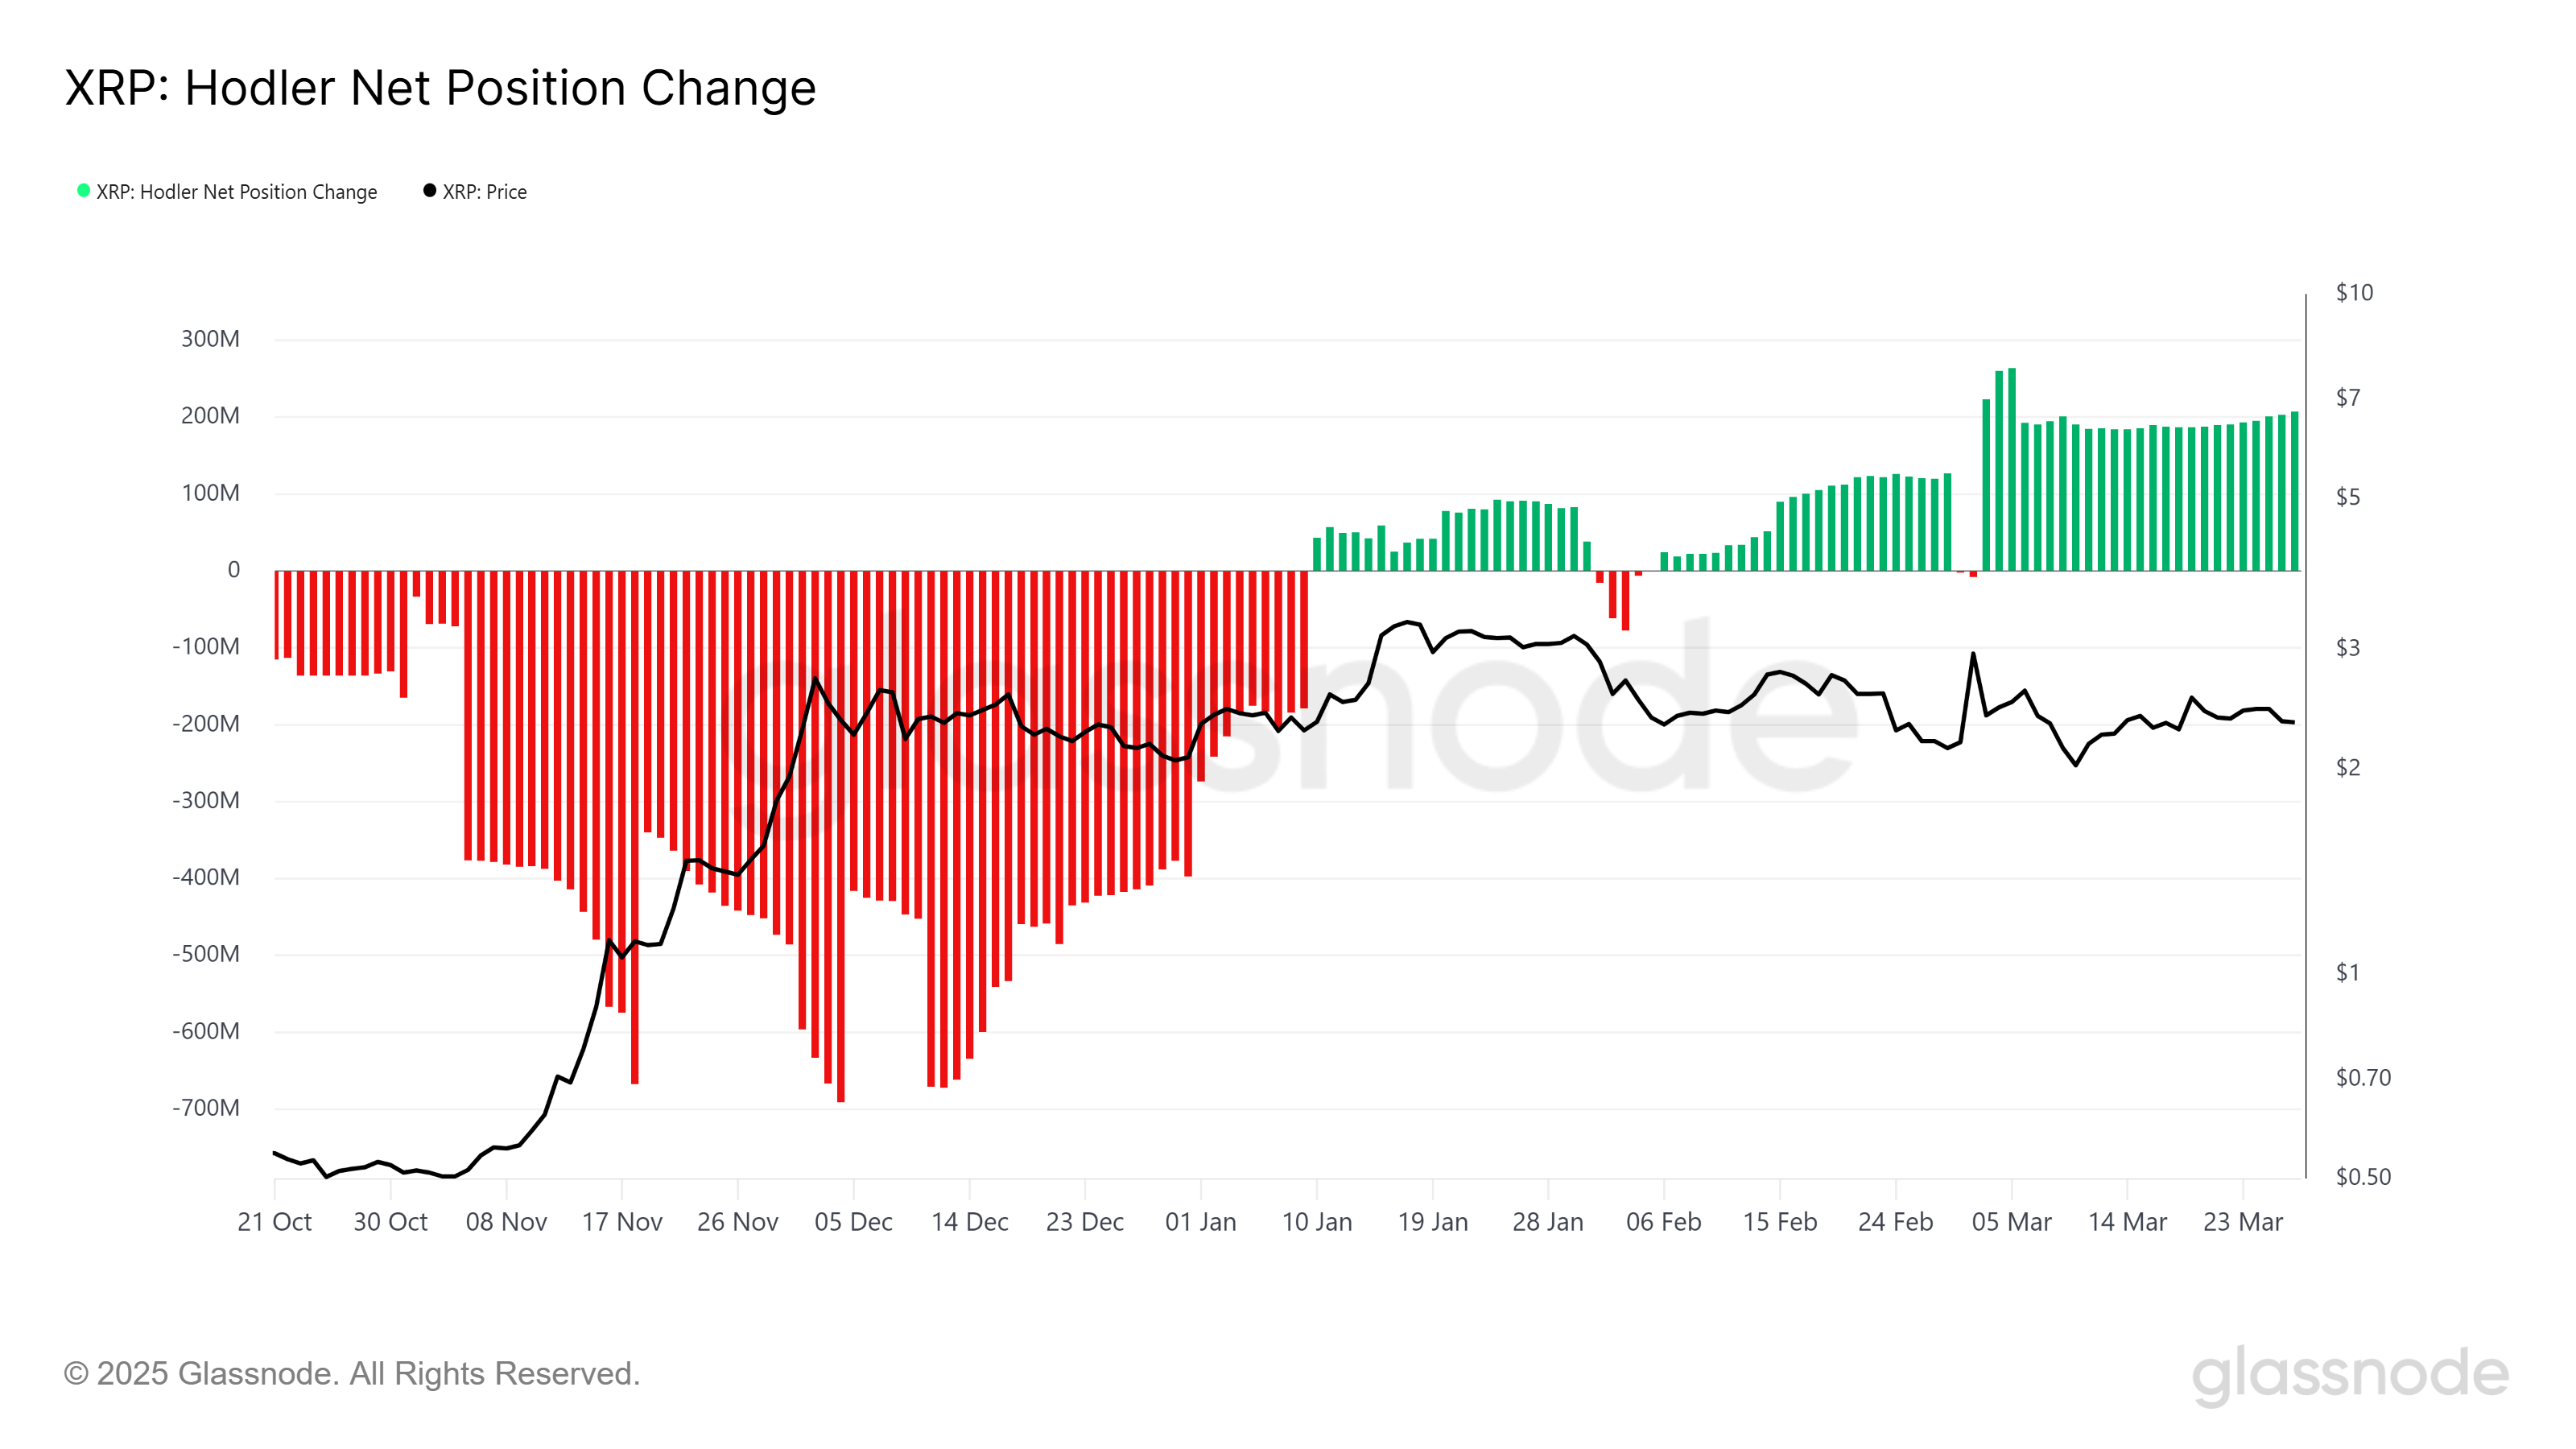
The HODLer Position Change metric, which tracks long-term holders’ behavior, reveals that LTHs (Long-Term Holders) have been accumulating XRP during this consolidation phase. This accumulation suggests that LTHs are confident that XRP will eventually capitalize on a future price increase.
Their ongoing conviction has helped support XRP’s price despite the stagnation and market uncertainty. This accumulation could be a sign that, when the market conditions improve, XRP may see a surge in value, as these holders are not looking to sell in the near term.
This accumulation by LTHs acts as a stabilizing factor, preventing the price from dipping significantly despite the market’s lack of strong direction.
Will XRP Fail This Crucial Breach Again?
At the time of writing, XRP is trading at $2.20, having failed to breach the key resistance level of $2.56 last week. This resistance has proven to be a significant barrier over the past four months, limiting any major upward movement for the altcoin. Until XRP can break through this level, it will likely remain trapped within its current range.
With mixed signals from the market, XRP may face challenges in gaining momentum. If market conditions do not improve in Q2 2025, the altcoin could experience a decline towards $2.02 or potentially lower if it falls through the $2.14 support level. Such a decline would indicate that a corrective move could follow the saturation phase.
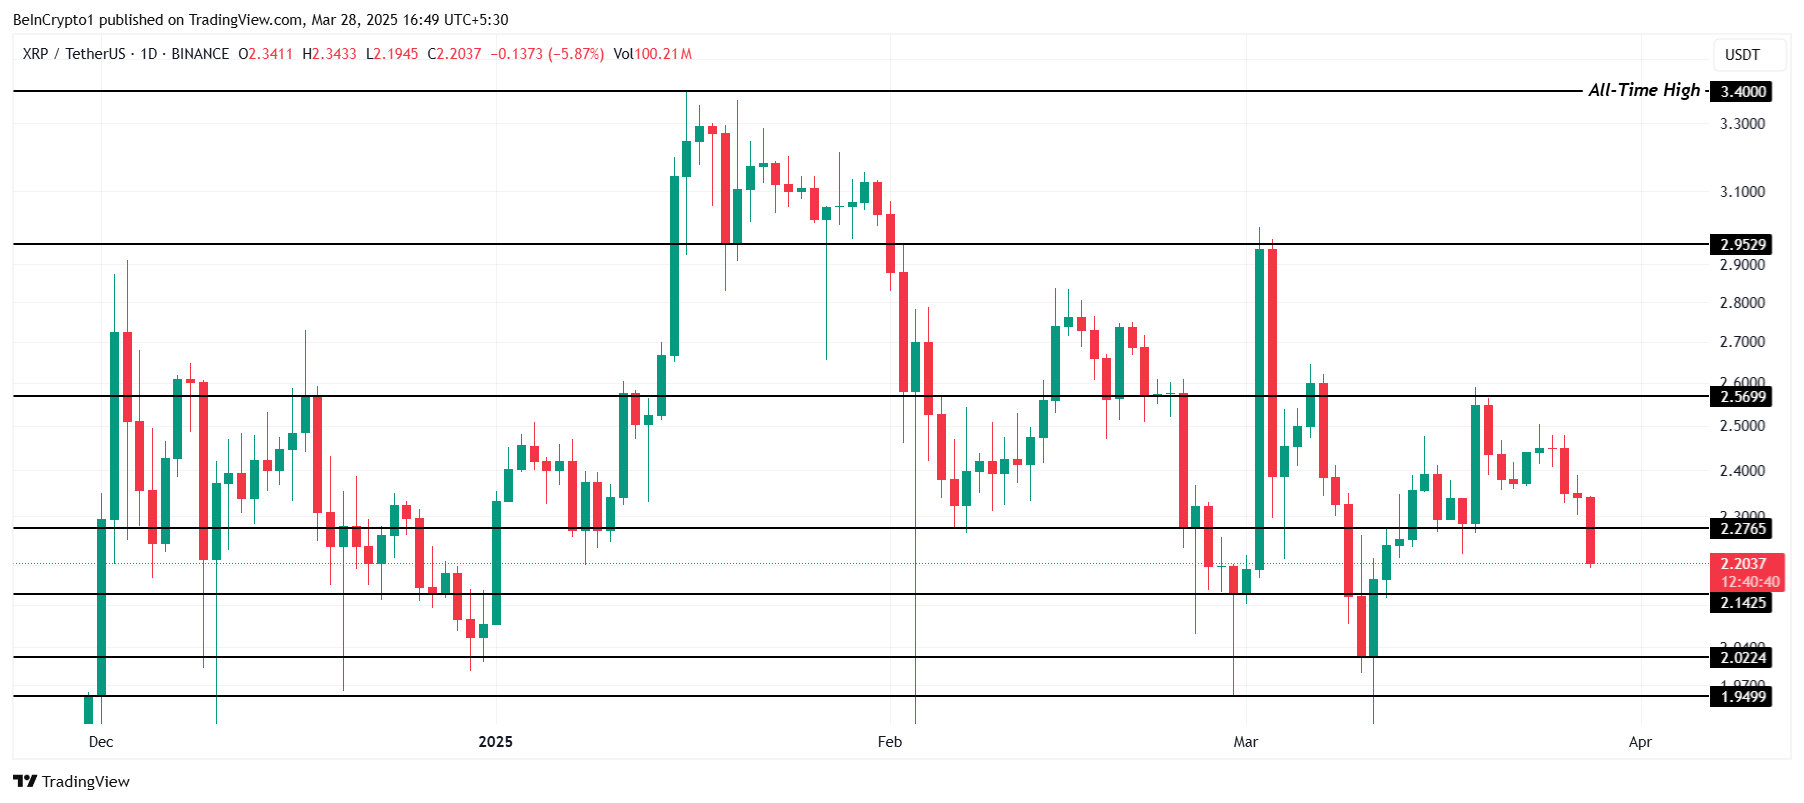
For the bearish outlook to be invalidated, XRP needs to breach and flip the $2.56 resistance into support. Doing so would open the door for a price increase, pushing XRP beyond the $2.95 and $3.00 levels. This would also bring XRP closer to its all-time high (ATH) of $3.40, signaling that the altcoin could finally resume its bullish trajectory after the period of consolidation.
Disclaimer
In line with the Trust Project guidelines, this price analysis article is for informational purposes only and should not be considered financial or investment advice. BeInCrypto is committed to accurate, unbiased reporting, but market conditions are subject to change without notice. Always conduct your own research and consult with a professional before making any financial decisions. Please note that our Terms and Conditions, Privacy Policy, and Disclaimers have been updated.
Market
Popular Analyst Peter Brandt Identifies XRP Head & Shoulder Pattern, Reveals Path To Take
Reason to trust

Strict editorial policy that focuses on accuracy, relevance, and impartiality
Created by industry experts and meticulously reviewed
The highest standards in reporting and publishing
Strict editorial policy that focuses on accuracy, relevance, and impartiality
Morbi pretium leo et nisl aliquam mollis. Quisque arcu lorem, ultricies quis pellentesque nec, ullamcorper eu odio.
Popular analyst Peter Brandt has provided a bearish outlook for the XRP price, predicting that the altcoin could drop below the $2 support. As part of his analysis, he highlighted a head-and-shoulders pattern that could spark the breakdown below $2.
Peter Brandt Identifies XRP Head And Shoulders Pattern
In an X post, Brandt revealed that XRP is forming a textbook head-and-shoulders pattern, which has caused the altcoin to range-bound. He added that the head-and-shoulders pattern projects a price decline to as low as $1.07. The analyst’s accompanying chart showed that XRP could witness a freefall to this target if it loses the $1.9 support.
Related Reading
Crypto analyst CasiTrades had also recently raised the possibility of XRP dropping to as low as $1.54. She revealed that a break below the $2.25 support and lower support at $1.90 could lead to this breakdown to $1.54. However, the analyst suggested that the probability of this happening was really low, as the $2.25 support is holding really strongly.
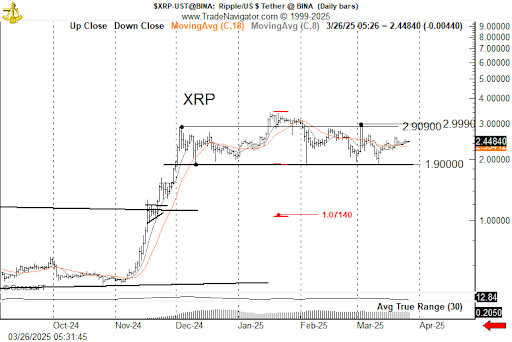
Meanwhile, crypto analyst Ali Martinez also discussed the head-and-shoulders pattern that had formed for the XRP price. In an X post, he stated that if XRP can break above $3, it would invalidate the current head-and-shoulders pattern, a development that could flip the altcoin’s outlook to bullish. In his analysis, Brandt had also hinted that a rally above $3 could invalidate the bearish pattern.
Martinez’s accompanying chart showed that XRP could drop to as low as $1.25 if this head-and-shoulders pattern plays out. In another post, he again raised the possibility of XRP suffering this price breakdown, while stating that the $2 price level remains the critical support level for the crypto.
Bullish Outlook For The Altcoin
In an X post, crypto analyst Dark Defender provided a bullish outlook for the XRP price, predicting it could reach as high as $23.20. The analyst claimed that the third wave targets a rally of between $5.85 and $8.076. Meanwhile, the fifth wave is expected to finish the move between $18.22 and $23.20.
Related Reading
This prediction came as part of Dark Defender’s analysis of the 3-month candle. He affirmed that XRP boasts a clear bullish momentum on this higher timeframe. He added that there are ups and downs in smaller time frames, but the higher frames supersedes the smaller ones.
In another post, the analyst assured XRP’s consolidation will be over soon. He revealed that the altcoin has formed a great bullish rectangle pattern and that the next leg up will send it to new all-time highs (ATHs).
At the time of writing, the XRP price is trading at around $2.25, down over 4% in the last 24 hours, according to data from CoinMarketCap.
Featured image from iStock, chart from Tradingview.com
-
 Market23 hours ago
Can Cardano (ADA) Reach Back to $1 in April?
-

 Market22 hours ago
Should You Buy Movement (MOVE) For April 2025?
-

 Altcoin22 hours ago
Dogecoin Price Prediction: Here’s What Needs To Happen For DOGE To Recover Above $0.3
-

 Market21 hours ago
Binance To List MUBARAK, BROCCOLI, BANANAS31, and Tutorial
-

 Market18 hours ago
Binance Alpha Lists Ghibli Meme Coins Amid ChatGPT Hype
-

 Altcoin18 hours ago
Dogecoin Cup And Handle Pattern Signals Recovery To $0.4, Here’s How
-
 Market17 hours ago
Why BTC Price Stayed Unchanged
-

 Market16 hours ago
Bitcoin Price Stalls at $88K—Can Bulls Overcome Key Resistance?


