
Market
Litecoin Whales Could Bring This Big Change to LTC Price

Since early August, Litecoin’s (LTC) price has been in a state of consolidation, with movements limited within a narrow range. Despite briefly breaking out of this range, LTC was quickly pulled back into consolidation, indicating weakening bullish momentum.
As a result, traders are becoming wary of a prolonged stagnation period. However, increased activity from LTC whales may signal an impending shift in momentum, with these large holders looking to change the course of Litecoin’s price action.
Litecoin Whales Could Change the Wave
Whale activity surrounding Litecoin has surged significantly over the past month, showing increased interest from large investors. Transactions worth more than $100,000 have grown by 38%, rising from $3.21 billion to $4.43 billion. This uptick in large-scale transactions is a positive sign, as it suggests that whales are actively accumulating LTC, potentially preparing for a bullish breakout.
The heightened activity from these large wallet holders often serves as a leading indicator for future price movements. Historically, whale accumulation has been linked to significant price shifts, as their influence can move the market. Should this trend continue, it could indicate growing confidence in Litecoin’s potential to break out of its consolidation phase.
Read More: How To Buy Litecoin (LTC) and Everything You Need To Know

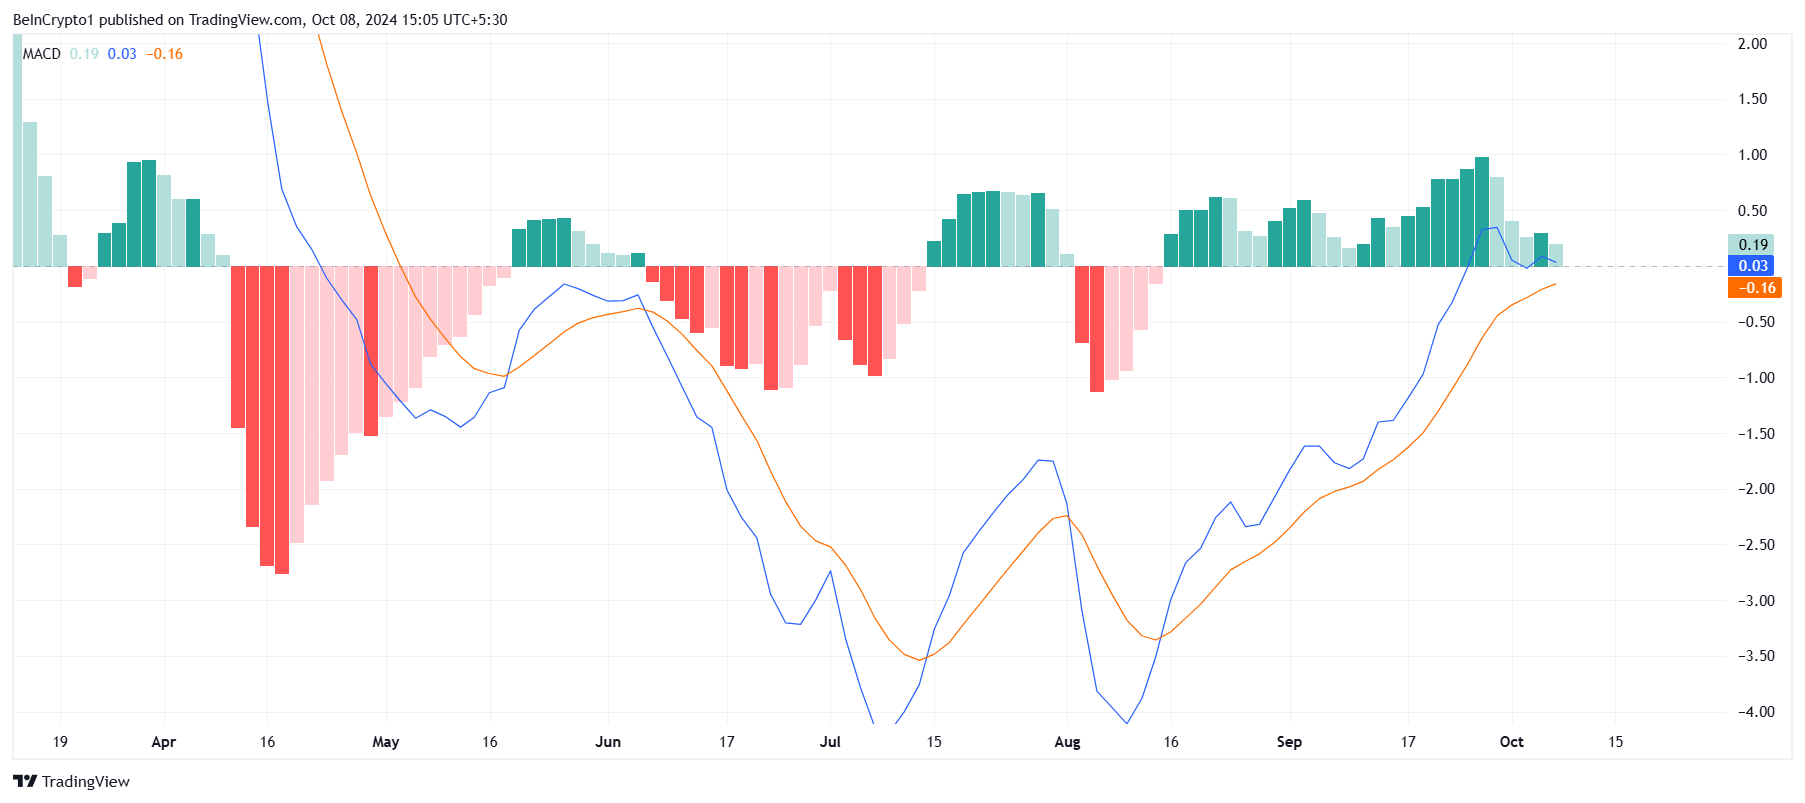
Despite the optimism surrounding whale activity, technical indicators paint a different picture. The Moving Average Convergence Divergence (MACD) indicator shows that a bearish crossover is imminent.
MACD histogram’s green bars, which represent bullish momentum, are fading, signaling that selling pressure may soon increase. If the bearish crossover is confirmed, it could negate the bullish signals from whale activity, leading to a potential price decline.
This contradiction between whale transactions and the MACD suggests that Litecoin’s price could face a turbulent period. While whales may continue to accumulate, broader market signals indicate that bearish forces are gaining strength.
LTC Price Prediction: Aim for a Rise
Litecoin’s price is currently trading at $65, consolidating within a range of $68 and $59. Should LTC breach the upper limit of this range, it could trigger an 18% rally, pushing the price toward $76. This would mark a significant recovery for the cryptocurrency, driven by whale activity and bullish sentiment.
However, this price surge is only possible if whales maintain their buying pressure and outpace the broader market’s bearish trends. A confirmed breakout would require Litecoin to flip $68 into support, signaling a new bullish phase.
Read More: Litecoin (LTC) Price Prediction 2024/2025/2030
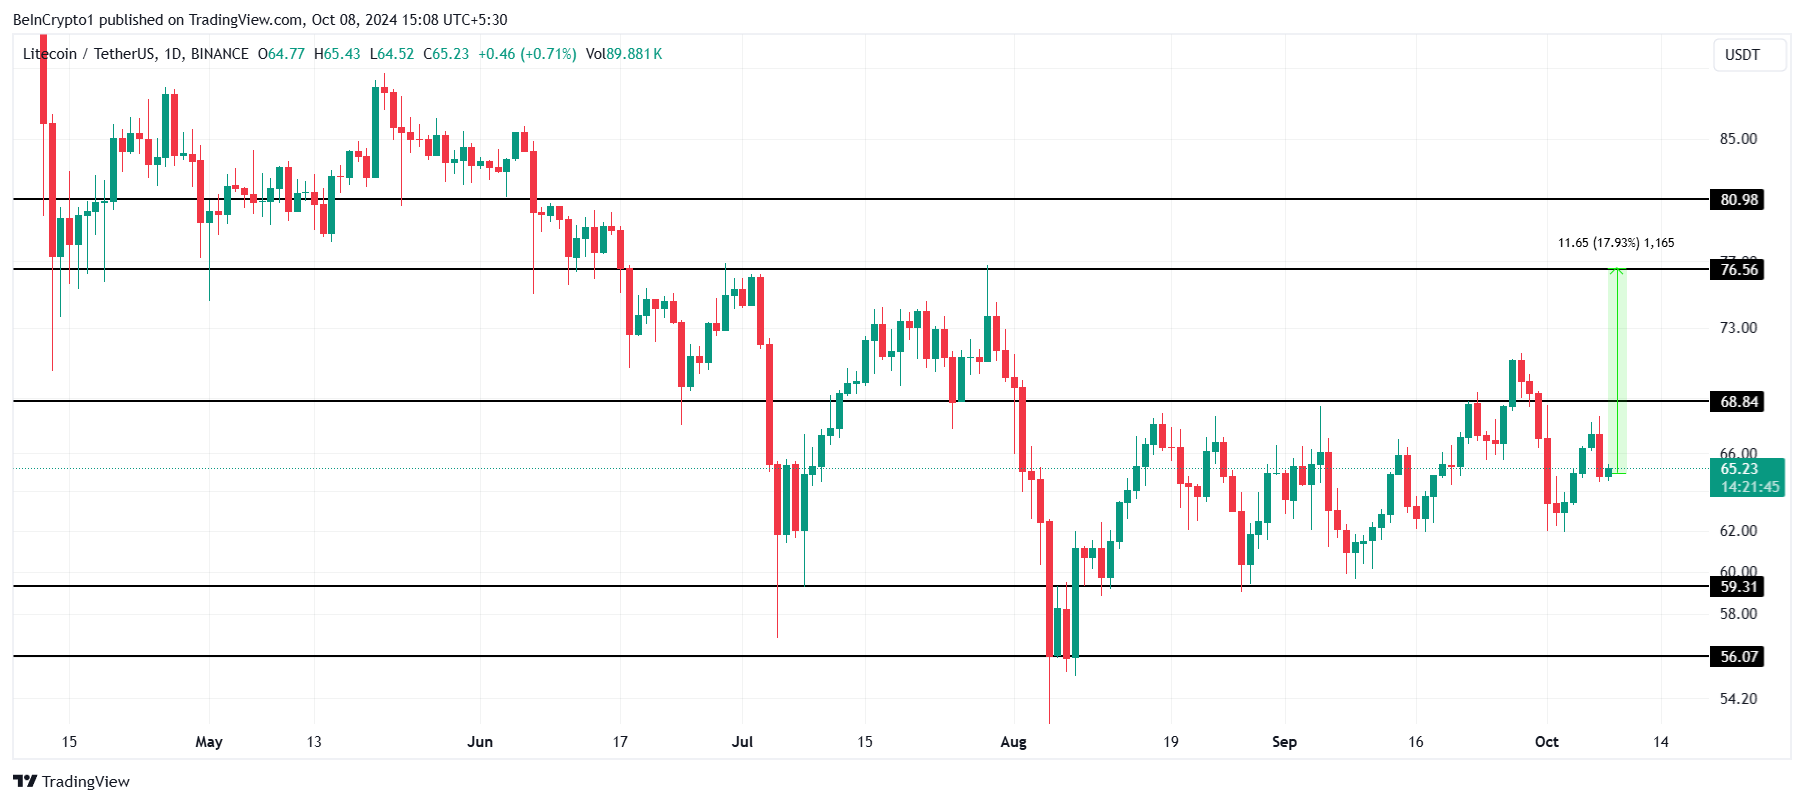
If Litecoin fails to breach $68 and remains below this key level, the consolidation could persist, prolonging the stagnation period. A drop below $59, combined with decreased whale activity, would invalidate the bullish thesis, potentially leading to further price declines.
Disclaimer
In line with the Trust Project guidelines, this price analysis article is for informational purposes only and should not be considered financial or investment advice. BeInCrypto is committed to accurate, unbiased reporting, but market conditions are subject to change without notice. Always conduct your own research and consult with a professional before making any financial decisions. Please note that our Terms and Conditions, Privacy Policy, and Disclaimers have been updated.


In an engaging session during Paris Blockchain Week, BeInCrypto caught up with Petrix Barbosa, the innovative mind behind Matchain, a blockchain venture that’s reshaping how digital identity and data sovereignty are approached.
Barbosa, who transitioned from a successful career as a venture capitalist, where he managed investments across 250 projects, brings a wealth of experience and a unique perspective to the blockchain landscape. Petrix Barbosa’s insights reveal a compelling vision for the future of blockchain, focusing on user empowerment and innovative use of technology to solve enduring problems in digital identity and data management.
Petrix Barbosa Discusses Matchain and its Mission
Matchain is a layer 2 blockchain platform that primarily addresses the challenges of identity and data sovereignty. Our mission is to empower users by giving them control over their digital identities and data, thus ensuring that they’re the primary beneficiaries of their online presence.
Barbosa on His Pivot from Venture Capital
In my time as an investor, I witnessed many great ideas fail to reach their potential due to the lack of a substantial user base or poor market timing. This inspired me to transition from funding projects to creating a platform that not only serves my vision but also provides tangible solutions to widespread issues in the blockchain community—primarily, user engagement and application.
Matchain’s Innovations in the Area of Identity Sovereignty
Matchain introduces a novel approach to managing digital identity. Unlike traditional models where user data is siloed across various platforms, Matchain allows users to have a single digital identity that spans across both Web2 and Web3. This is crucial for enabling a seamless transition and interaction between these two worlds.
How Matchain Integrates Existing Web2 Infrastructure
Our platform acts as a bridge between the decentralized ecosystem of Web3 and the more traditional Web2 infrastructure. By allowing users to manage their digital identities across both platforms, we facilitate a smoother interaction that enhances user experience while maintaining high security and trust.
Future Developments From Matchain
Looking ahead, we aim to expand our user base significantly. Currently, we are backed by strategic partnerships, like the one with Paris Saint-Germain, which not only broadens our exposure but also integrates our technology into mainstream applications.
In the next two years, we plan to onboard millions of users, leveraging our innovative solutions to enhance their digital interactions.
Barbosa on Unique Challenges in Developing Matchain
The biggest challenge was shifting the focus from simply creating a blockchain solution to ensuring it was user-centric and capable of addressing real-world problems. This involved integrating AI to manage and analyze data effectively, ensuring that our platform could deliver personalized and contextually relevant experiences to users.
Matchain Over the Next Five Years
In five years, I envision Matchain at the forefront of blockchain technology, leading the charge in digital identity management and data sovereignty. Our platform will likely become a critical tool for users and companies looking to navigate the complexities of the digital age securely and efficiently.
Disclaimer
In compliance with the Trust Project guidelines, this opinion article presents the author’s perspective and may not necessarily reflect the views of BeInCrypto. BeInCrypto remains committed to transparent reporting and upholding the highest standards of journalism. Readers are advised to verify information independently and consult with a professional before making decisions based on this content. Please note that our Terms and Conditions, Privacy Policy, and Disclaimers have been updated.

Content Coins are a new trend gaining attention in the crypto space, especially on Base. They are positioned as digital content with value driven by culture and virality. Supporters see them as a new form of expression.
Critics say they’re just meme coins with a different name. Base is pushing the idea forward, hoping it helps the chain stand out from the rest.
Are Content Coins Really Different From Meme Coins?
Content coins are a new concept gaining traction within crypto communities, especially on Base chain. According to Base founder Jesse Pollak, a content coin “represents a single piece of content,” with the core idea being that the coin is the content and the content is the coin — no more, no less.
These tokens are often created in a specific context, either on platforms like Zora.
Essentially, creators design them to function as standalone pieces of digital content, driving the token’s value through cultural impact, virality, or meme-worthiness—rather than any utility or fundamental backing.

Despite the growing popularity of the term, not everyone is convinced. User Kash (@kashdhanda) dismissed the label, saying, “contentcoins are a silly name for memecoins”. He also pointed out that “memecoins are actually closer to financial content than they are to finance.”
David Tso (@davidtsocy), who works at Base, brings a more supportive spin, comparing content coins to “Instagram posts and TikToks that show their value in real time.”
Is Base Is For Everyone Just Another Meme Coin?
Base is for everyone was the first content coin officially launched and promoted by Base. It made an explosive debut, with a market cap nearing $18 million within its first few hours.
Shortly after its peak, the token plummeted nearly 75%. Since then, it has shown signs of recovery, with its market cap now hovering around $9.6 million.
The coin has gained significant traction in terms of activity, currently boasting nearly 21,000 holders, over 29,000 transactions in the last 24 hours, and a daily trading volume close to $9 million.

Base is using this momentum to push a broader narrative: that all content should live on-chain. Base is actively leveraging this philosophy, framing content coins as a new form of internet-native expression where each token represents a piece of digital culture stored permanently on the blockchain.
Yet, despite this push, Base is for everyone remains the only content coin to break out meaningfully—most others haven’t crossed the $100,000 market cap threshold. While the concept aims to separate itself from typical meme coins by embedding value in cultural relevance rather than pure speculation, many remain unconvinced.
Critics argue that content coins are merely meme coins in new packaging. Still, if the trend takes off, it could position Base to outperform other chains like Solana. It would do this by capturing this narrative and driving unique user activity to its ecosystem.
Disclaimer
In line with the Trust Project guidelines, this price analysis article is for informational purposes only and should not be considered financial or investment advice. BeInCrypto is committed to accurate, unbiased reporting, but market conditions are subject to change without notice. Always conduct your own research and consult with a professional before making any financial decisions. Please note that our Terms and Conditions, Privacy Policy, and Disclaimers have been updated.

This week in crypto recorded several key events across various ecosystems that will continue shaping the industry.
From major partnerships to investment decisions and scam allegations, the following is a comprehensive roundup of crypto news this week.
Mantra Crash: From Billion-Dollar Hype to Fragile Liquidity
This week in crypto Mantra’s powering token lost $90% of its value amid allegations of insider dealing and liquidity fragility. Once hailed as a rising star in the RWA (real-world asset) narrative, OM’s collapse wiped out over $5.5 billion in value.
Reports revealed a disturbing pattern of concentrated wallet activity and low liquidity pools, which made OM highly vulnerable to sudden exits.
On-chain sleuths identified one trader whose aggressive selling triggered a cascade of liquidations. This highlights the risks of low-float, high-hype tokens in an illiquid market environment.
“This was due to an entity(s) on the Binance perpetuals market. That’s what triggered the entire cascade. The initial drop below $5 was triggered by a ~1 million USD short position being market-sold. This caused over 5% of slippage in literal microseconds. That was the trigger. This seems intentional to me. They knew what they were doing,” the analyst stated.
Pi Network: From Chainlink Buzz to Transparency Fears
Pi Network recorded strong optimism this week as its native Pi Coin surged by double digits. BeInCrypto attributed the surge to the announcement of a key integration with Chainlink.
They pitched this strategic collaboration as a gateway to real-world utility. Specifically, it positioned Pi closer to the broader DeFi and smart contract ecosystem. However, the euphoria proved short-lived.
Market sentiment quickly soured as analysts began comparing Pi Network and the recently collapsed OM token.
Allegations suggest that, like the OM token, Pi coin lacks full clarity around circulating supply, wallet distribution, and centralized control. To some, these are potential red flags in an increasingly regulation-sensitive industry.
“The OM incident is a wake-up call for the entire crypto industry, proof that stricter regulations are urgently needed. It also serves as a huge lesson for the Pi Core Team as we transition from the Open Network to the Open Mainnet,” wrote Dr Altcoin.
Pi coin reversed gains within days, falling 18% from its weekly high. At the time of writing, PI was trading at $0.6112, up by a modest 0.7% in the past 24 hours, per CoinGecko.

Grayscale’s Altcoin Shake-Up: 40 Tokens Under Review
This week in crypto also showed that institutional investor interest in altcoins is heating up again, with Grayscale leading the charge.
The digital asset manager unveiled its updated list of assets under consideration for the second quarter (Q2) 2025. BeInCrypto reported that the list featured zero altcoins across sectors such as DePIN, AI, modular blockchains, and restaking. Among the notable tokens being eyed are SUI, STRK, TIA, JUP, and MANTA.
The update reflects Grayscale’s growing thesis around emerging crypto trends, particularly as the firm seeks to expand beyond its core Bitcoin and Ethereum products.
This announcement follows a broader strategic overhaul from three weeks ago when Grayscale reshuffled its top 20 list of altcoins by market exposure. Several older names were dropped at the time, while newer narratives like Solana-based DePIN and Ethereum restaking plays were pushed to the forefront.
The expansion into 40 coins signals Grayscale’s recognition of renewed retail and institutional appetite for differentiated assets. However, inclusion in the list does not guarantee a fund launch. It only indicates Grayscale’s active research.
XRP and SWIFT Partnership: Breaking Down the Rumors
There was speculation this week about a possible partnership between Ripple’s XRP and banking giant SWIFT in crypto.
This narrative was based on a misinterpreted document. A series of cryptic social posts exacerbated the speculation, which some took as confirmation of collaboration between the global payments network and the XRP ledger.
However, BeInCrypto’s in-depth reporting sank the rumors. While Ripple has long pursued banking institutions and SWIFT has shown openness to blockchain innovations, there is no verified partnership between the two.
SWIFT’s public-facing projects around tokenization and digital asset settlement do not include XRP.
Despite the debunking, the rumors sparked an important conversation about XRP’s long-term positioning. The token remains a top-10 asset and a favorite among retail investors banking on utility-driven price appreciation.
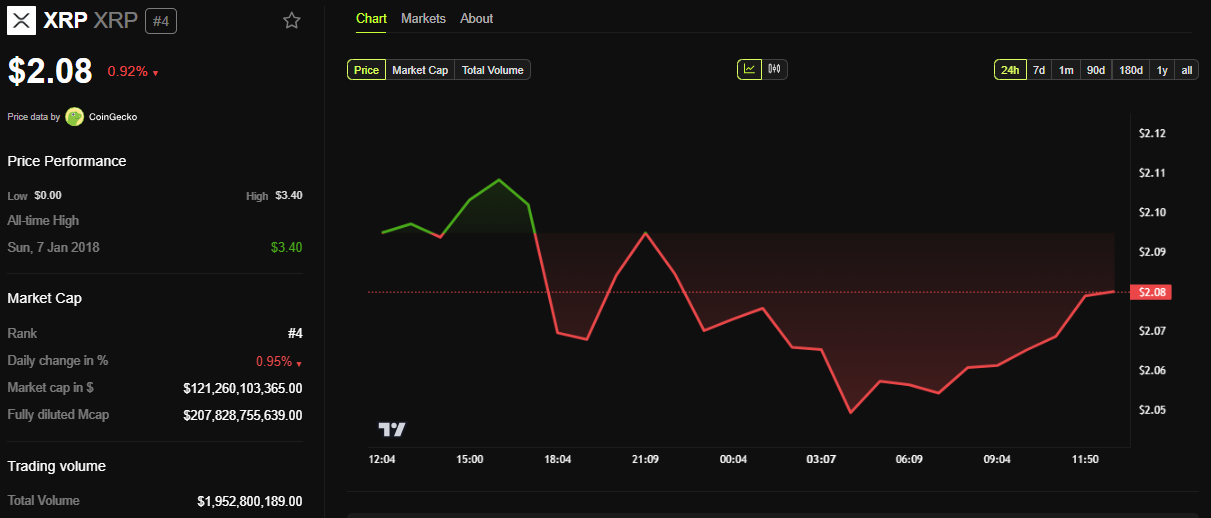
With Ripple’s legal battles with the SEC nearing resolution and international CBDC partnerships in the works, the project is far from irrelevant.
US Dollar Dives: What the DXY Crash Means for Bitcoin
The US Dollar Index (DXY) hit a three-year low this week, sending ripples through the crypto markets. Historically, a falling DXY has been bullish for Bitcoin, and this week was no different, with BTC reclaiming above the $84,000 range.
The greenback’s weakness reflects growing fears of fiscal deterioration in the US, as rate cuts loom and Treasury debt soars.
However, that is just the surface. The global M2money supply has been quietly increasing again, especially across Europe and Asia. This reignites the liquidity conditions that fueled previous bull runs.
Japan’s 10-year bond yields hit multi-decade highs, forcing the Bank of Japan (BoJ) into increasingly precarious interventions. As Japanese liquidity spills outward, crypto and risk assets have become inadvertent beneficiaries.
This macroenvironment is ideal for Bitcoin. Weakening fiat, rising global liquidity, and crumbling bond market confidence create a perfect storm.
Disclaimer
In adherence to the Trust Project guidelines, BeInCrypto is committed to unbiased, transparent reporting. This news article aims to provide accurate, timely information. However, readers are advised to verify facts independently and consult with a professional before making any decisions based on this content. Please note that our Terms and Conditions, Privacy Policy, and Disclaimers have been updated.

Matchain’s Petrix Barbosa Talks the Future of Digital Identity

Base Launches Strong, But Content Coins Draw Doubt

Pi Network, Grayscale’s Altcoin Shake-Up
Is Solana Forming a Death Cross Against Bitcoin?

TRUMP Meme Coin Ignores $307M Unlock, Bearish Trend Holds

Solana (SOL) Price Rises 13% But Fails to Break $136 Resistance

2.52 Million Altcoins Are Ruining Crypto’s Future

Animoca Brands Valuation Tanks 75% In Two Years, Here’s Why

Crypto exchange BingX hacked for $43 million

Are The Big Players Losing Interest?

Hong Kong’s Securities Association Tips Authorities On Crypto Self-Regulation

Coinbase cbBTC Set to go Live on Solana
2.52 Million Altcoins Are Ruining Crypto’s Future
Animoca Brands Valuation Tanks 75% In Two Years, Here’s Why
Crypto exchange BingX hacked for $43 million
Are The Big Players Losing Interest?
Hong Kong’s Securities Association Tips Authorities On Crypto Self-Regulation
Coinbase cbBTC Set to go Live on Solana
-
 Altcoin24 hours ago
Expert Predicts Pi Network Price Volatility After Shady Activity On Banxa
-

 Ethereum20 hours ago
Ethereum Fee Plunges To 5-Year Low—Is This A Bottom Signal?
-

 Market24 hours ago
Ethereum Price Fights for Momentum—Traders Watch Key Resistance
-

 Market19 hours ago
Bitcoin Price Gears Up for Next Leg Higher—Upside Potential Builds
-

 Market22 hours ago
Is XRP’s Low Price Part of Ripple’s Long-Term Growth Strategy?
-

 Ethereum12 hours ago
Ethereum Price Stalls In Tight Range – Big Price Move Incoming?
-
 Market12 hours ago
How $31 Trillion in US Bonds Could Impact Crypto Markets in 2025
-

 Market23 hours ago
XRP Price Weakens—Further Losses on The Table?