
Market
Kraken Challenges SEC Over ADA, ALGO, and Other Cryptos

Centralized crypto exchange Kraken retaliated against the US Securities and Exchange Commission (SEC) by challenging its securities label on digital assets.
The regulator claimed Kraken violated federal securities laws when it offered certain digital assets, which qualify as unregistered securities.
Kraken Despites SEC Allegations Against Digital Assets
Kraken said ADA, ALGO, SOL, and other assets do not meet the legal definition of securities under US law. The exchange also slammed the SEC for the lack of clarity, calling it out for regulatory overreach.
Read more: Crypto Regulation: What Are the Benefits and Drawbacks?
In its defense, Kraken cites the Howey ruling, a milestone Supreme Court case that serves as a reference point to determine what constitutes an investment contract. With this reference, the exchange challenges that the SEC failed to demonstrate that the named tokens meet the criteria outlined in the Howey framework and, thereby, do not fall under the SEC’s jurisdiction.
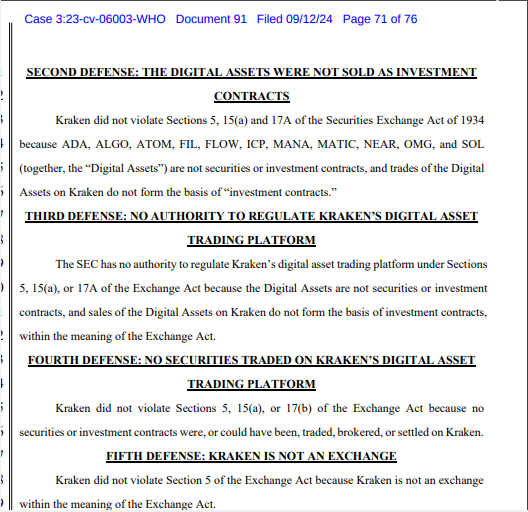
“The SEC has no authority to regulate Kraken’s digital asset trading platform […] because the Digital Assets are not securities or investment contracts,” the filing read.
Kraken is, therefore, pushing for a jury trial, saying the SEC is blocking its efforts to register or cooperate. It argues that the regulator consistently “stonewalls” it using inconsistent rulings and guidance.
Some community members have criticized the Howey test, arguing that it’s too broad and doesn’t account for the complexities of modern investment structures or technologies. As a result, the test may not always accurately classify certain types of transactions in today’s increasingly complex financial landscape.
“The problem is really that the Howey test is far too generic. The truth is that many cryptocurrencies do not pass that specific test. But that doesn’t take in the nuance of what securities were meant to be,” one X user commented.
This isn’t the first time the SEC has faced criticism for labeling digital assets as securities. In June 2023, the regulator alleged that several crypto assets traded on Binance, Coinbase, and Robinhood qualified as securities, a claim that was quickly challenged by crypto executives.
Read More: Who Is Gary Gensler? Everything To Know About the SEC Chairman
Recently, the SEC revised its position by amending its complaint related to “Third Party Crypto Asset Securities.” The regulator clarified that the term refers to contracts tied to the sale of crypto assets, not the assets themselves. This update came from the wording used in Footnote 6 of its amended complaint against Binance.
Disclaimer
In adherence to the Trust Project guidelines, BeInCrypto is committed to unbiased, transparent reporting. This news article aims to provide accurate, timely information. However, readers are advised to verify facts independently and consult with a professional before making any decisions based on this content. Please note that our Terms and Conditions, Privacy Policy, and Disclaimers have been updated.


As traders and investors anticipate the beginning of April and the onset of the second quarter (Q2) of 2025, crypto airdrops present an opportunity to join promising communities while they are still on the ground floor.
This week, three notable crypto airdrops stand out as worth watching.
Walrus
Walrus (WAL), a decentralized storage protocol on the Sui blockchain, launched its mainnet and token generation event (TGE) on March 27. The event coincided with South Korea’s Upbit exchange listing WAL.
The TGE saw Walrus distribute 4% of its 5 billion token supply via an airdrop. Eligible participants, including early Sui ecosystem users and testnet contributors, received Soulbound NFTs redeemable for WAL tokens. As April commences, 6% of Walrus tokens are reserved for future community rewards.
“At the moment 4% of the 10% tokens allocated for the airdrop have been distributed, so Walrus still has tokens to reward users,” Cryptorank.io noted.
WAL powers storage payments, staking, and governance, with listings on exchanges like Crypto.com and MEXC offering prize pools. The project’s airdrop comes after raising $140 million from Andreessen Horowitz, Standard Crypto, Electric Capital, and Comma3 Ventures, among others.
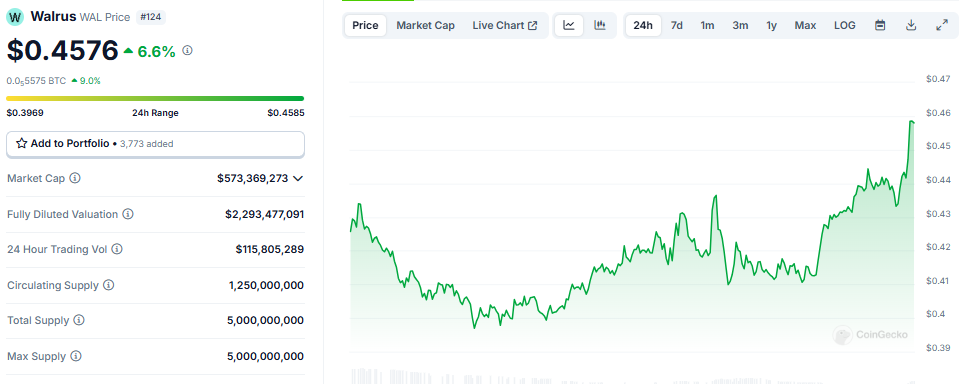
Meanwhile, Walrus’s market cap exceeds $573 million, reflecting strong adoption potential. Data on CoinGecko shows it was trading for $0.45 as of this writing.
Staking opportunities with validators like Mysten Labs or Nansen enhance rewards, but high commissions (up to 60%) apply. One of Walrus and Sui’s founders recently announced that users could stake WAL tokens to get airdrops. As this could mean airdrops from Walrus and projects from the Sui ecosystem, engaging with Sui dApps and testnets remains key for future allocations.
Nansen
The project has raised up to $88.2 million from investors such as Andreessen Horowitz, Coinbase Ventures, Accel, and Mechanism Capital, among others. Coupled with the fundraiser, Nansen has a valuation of $750 million.
Nansen, a leading blockchain analytics platform, confirmed an airdrop, drawing excitement due to its prominence and past reward patterns. The project launched a staking program and announced a point system in 2025.
“We’re excited to announce that we have acquired Stakewithus (SWU)! SWU is a non-custodial staking service provider with $80m+ staked by 30k+ users & supports 20+ chains You can now analyze data, monitor your portfolio, and stake assets in one place with Nansen,” read the announcement.
Users can stake assets (STRK and TRX), and points are expected to be credited retrospectively. Nansen also mentions the NSG token, so participants will most likely receive an airdrop for points.
Market participants should monitor Nansen’s social channels and partnerships for updates, as airdrops typically reward active users or data contributors.
With no token launched yet, any potential airdrop might tie into a future native token, likely incentivizing early adopters or premium subscribers. Given Nansen’s influence in the crypto space, tracking wallet activity and on-chain data, its airdrop could attract significant attention.
Participants should engage with its tools and stake in supported ecosystems to position themselves for unannounced opportunities.
OG Labs
This modular AI chain combines Layer-1 blockchain with decentralized AI, focusing on scalable Data Availability for AI applications.
The status of OG Labs airdrop stands confirmed, bringing forth an emerging player in the crypto space. This makes it a speculative target for market participants. It boasts up to $325 million in funds raised from investors such as Delphi Ventures, Hack VC, Animoca Brands, and OKX Ventures, among others.
The airdrop is potentially tied to Web3 innovation or NFT ecosystems (given the “OG” moniker). It follows models like Walrus, rewarding early testers or community members.
“There are new activities on the OG test network – we can request test tokens and make swaps,” Cryptorank.io noted.
The OG Labs airdrop requires no investment. Users can engage through OG Labs’ Newton Testnet, which tests-core functionalities like decentralized storage, consensus, and data availability services. Participants must complete at least 20 transactions, stay active for three days, and interact with features like swaps, storage scans, and NFT minting.
“Interact with the OG Labs Testnet and Become Eligible for the Airdrop,” crypto researcher Guatamgg stated.
Additionally, users can boost eligibility by taking Discord roles such as OGurus or OG Role. These activities involve community contributions and verification steps. This airdrop targets active ecosystem participants, aligning with OG Labs’ emphasis on community-driven development.
Disclaimer
In adherence to the Trust Project guidelines, BeInCrypto is committed to unbiased, transparent reporting. This news article aims to provide accurate, timely information. However, readers are advised to verify facts independently and consult with a professional before making any decisions based on this content. Please note that our Terms and Conditions, Privacy Policy, and Disclaimers have been updated.

Energy infrastructure platform Hut 8 Corp has partnered with US President Donald Trump’s sons, Eric Trump and Donald Trump Jr., to launch American Bitcoin Corp.
The company is dedicated to industrial-scale Bitcoin mining and developing a strategic reserve.
All You Need to Know about American Bitcoin
American Bitcoin’s leadership team includes Mike Ho as executive chair, Matt Prusak as CEO, and Eric Trump as CSO. The Board of Directors comprises Mike Ho, Asher Genoot (also Hut 8 CEO), Justin Mateen, and Michael Broukhim.
According to the announcement, Hut 8 holds an 80% ownership stake in American Bitcoin. This follows the contribution of its ASIC miners to American Data Centers Inc., a company formed by investors including the Trump brothers.
Subsequently, they renamed and relaunched the entity as American Bitcoin. As a new subsidiary focused on industrial-scale Bitcoin mining, this move aims for an efficiency of 50+ EH/s (exahashes per second). Meanwhile, Hut 8 remains the key infrastructure partner, consolidating financials under its brand.
Eric Trump, co-founder and chief strategy officer of American Bitcoin, expressed enthusiasm about the collaboration. He also emphasized the synergy between Hut 8’s operational excellence and shared passion for decentralized finance (DeFi) as a foundation for significant future growth.
“…By combining Hut 8’s proven operational excellence in data centers with our shared passion for Bitcoin and decentralized finance, we are poised to strengthen our foundation and drive significant future growth,” an excerpt in the announcement read, citing Eric Trump.
Donald Trump Jr. highlighted their longstanding commitment to Bitcoin, noting their conviction in Bitcoin personally and through their businesses. He reiterated the opportunity presented by mining Bitcoin under favorable economics and the potential for investors to participate in Bitcoin’s growth through this new platform.
Similarly, Genoot described the launch of American Bitcoin as a pivotal evolution in their platform strategy. By establishing a standalone entity for mining operations, Hut 8 aims to align each business segment with its respective cost of capital. Specifically, they would create two focused yet complementary companies.
Meanwhile, this venture is part of the Trump family’s broader engagement in the crypto industry. World Liberty Financial, the crypto venture linked to the Trump family, recently launched USD1. US treasuries, dollars, and cash equivalents back the stablecoin. The venture aims to facilitate secure cross-border transactions for investors and institutions.
Furthermore, reports indicate that the Trump family is discussing acquiring a stake in Binance.US. This is the American arm of the world’s largest cryptocurrency exchange, Binance. Given the family’s growing involvement in the sector, such an investment could significantly influence the crypto market.
These initiatives reflect the Trump family’s commitment to positioning the US at the forefront of the crypto industry. It also aligns with President Donald Trump’s ambition to establish the US as a global leader in digital assets.
“While people are worrying about the daily price action, President Trump and Eric Trump are building the infrastructure to take crypto to the next level,” crypto investor Gordon noted.
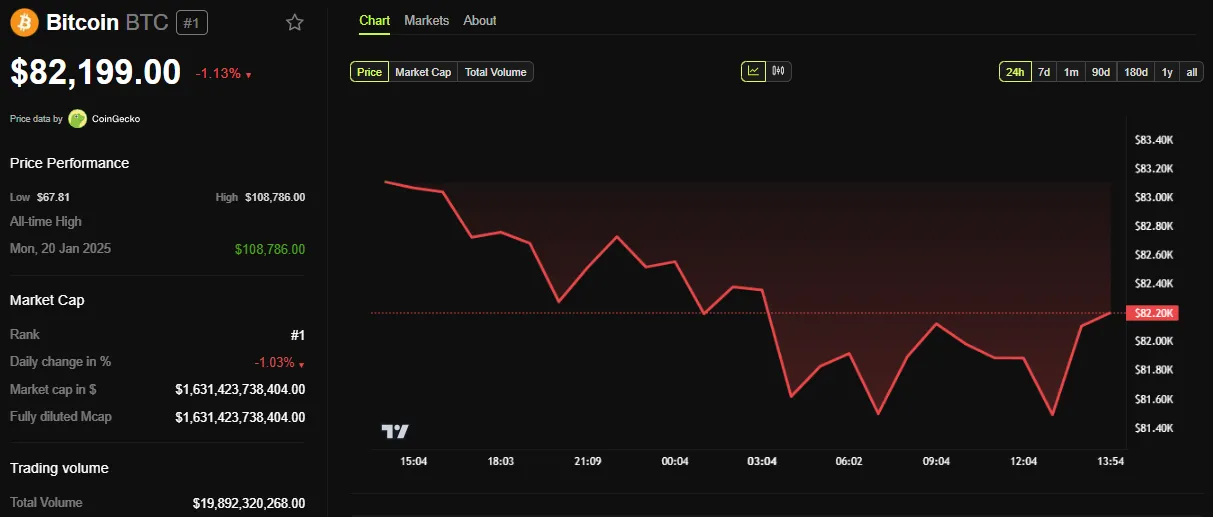
BeInCrypto data shows BTC was trading for $82,199 as of this writing. It is down by over 1.13% in the last 24 hours, unmoved by news of American Bitcoin. However, this could change once US markets open.
Disclaimer
In adherence to the Trust Project guidelines, BeInCrypto is committed to unbiased, transparent reporting. This news article aims to provide accurate, timely information. However, readers are advised to verify facts independently and consult with a professional before making any decisions based on this content. Please note that our Terms and Conditions, Privacy Policy, and Disclaimers have been updated.
ZachXBT, a well-known blockchain investigator, recently shared two key “minimum checks” on Telegram to avoid crypto scams.
He emphasized that users must accept full financial responsibility if they take risks in these situations and added that recovering lost funds would be extremely difficult.
Evaluating a Project’s Credibility is Crucial
ZachXBT highlighted two critical scenarios: depositing funds into forked DeFi protocols on newly launched EVM chains and getting scammed by projects with few smart followers on Kaito.
“If you make either of these decisions, it is your own personal choice to risk funds, and I will NOT help you,” ZachXBT stressed.
Many newly launched DeFi protocols on EVM chains are replicas of existing ones. Their teams often do not create original code but instead, fork from established protocols. This process requires minimal technical skills yet introduces significant security risks.
A recent incident highlighted the risks in the DeFi space. The DeFi protocol SIR.trading was reportedly hacked, leading to an estimated loss of $350,000. Despite the project’s documentation promoting it as a “new DeFi protocol for safer leveraged trading,” it acknowledged the risks related to smart contract vulnerabilities.
This case illustrates how new DeFi protocols often become targets for hackers. Additionally, in late March, the DeFi lending protocol Abracadabra suffered a loss of approximately $13 million due to an exploit involving collateralized tokens.
The second situation ZachXBT warned about involves getting “rugged” (falling victim to a rug pull) by projects with few smart followers on Kaito. Kaito is an AI-powered analysis tool that measures real community interest. He advised that checking followers’ numbers and quality is a basic step to avoid falling for projects that use fake engagement or empty marketing hype.
Investor Xero agreed with ZachXBT, stating that Kaito can be a credibility assessment tool.
“Kaito has become an amazing security and reputation tool that I value over others. It can help you identify an impersonator or a new rug project fast. If a 40k+ follower project isn’t connecting with real smart followers, it’s not legit,” Investor Xero commented.
Other Emerging Crypto Scams
In addition to ZachXBT’s warnings, several new scam tactics have recently been flagged.
Investor Jerome warned about a scheme that exploits browsers’ automatic download function to trick users into downloading malicious software.
Another method involves scammers creating and sending small transactions. They would be often as little as 0.001 tokens—using fake wallet addresses that closely resemble legitimate ones. Their goal is to deceive users into copying and pasting the fraudulent address when making future transactions.
Additionally, Microsoft has identified StilachiRAT, a new remote access trojan specifically designed to target cryptocurrency wallets and login credentials.
According to a Chainalysis report, from 2021 to 2024, decentralized finance (DeFi) platforms have been the primary targets of crypto hacks.
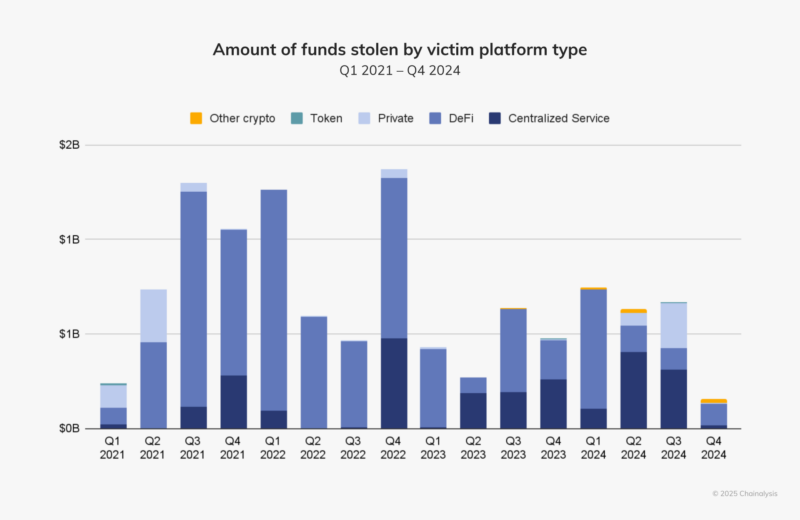
The report explains that DeFi platforms may be more vulnerable because developers prioritize rapid growth and launch over security measures. This lack of security focus makes them prime targets for hackers.
Disclaimer
In adherence to the Trust Project guidelines, BeInCrypto is committed to unbiased, transparent reporting. This news article aims to provide accurate, timely information. However, readers are advised to verify facts independently and consult with a professional before making any decisions based on this content. Please note that our Terms and Conditions, Privacy Policy, and Disclaimers have been updated.
$33 Million Inflows Signal Market Bounce

Top Crypto Airdrops to Watch in the First Week of April
Strategic Move for Trump Family in Crypto
Marathon Digital to Sell $2 Billion in Stock to Buy Bitcoin

Don’t Fall for These Common Crypto Scams

US Macroeconomic Indicators This Week: NFP, JOLTS, & More

2.52 Million Altcoins Are Ruining Crypto’s Future

Animoca Brands Valuation Tanks 75% In Two Years, Here’s Why

Crypto exchange BingX hacked for $43 million

Are The Big Players Losing Interest?

Hong Kong’s Securities Association Tips Authorities On Crypto Self-Regulation

Coinbase cbBTC Set to go Live on Solana
2.52 Million Altcoins Are Ruining Crypto’s Future
Animoca Brands Valuation Tanks 75% In Two Years, Here’s Why
Crypto exchange BingX hacked for $43 million
Are The Big Players Losing Interest?
Hong Kong’s Securities Association Tips Authorities On Crypto Self-Regulation
Coinbase cbBTC Set to go Live on Solana
-

 Ethereum23 hours ago
Whales Accumulate 470,000 Ethereum In One Week – Bullish Momentum Ahead?
-
 Regulation20 hours ago
Japan Set To Classify Cryptocurrencies As Financial Products, Here’s All
-
 Altcoin24 hours ago
Analyst Reveals Why The XRP Price Can Hit ATH In The Next 90 To 120 Days
-
 Market23 hours ago
3 Token Unlocks for April: Parcl, deBridge, Scroll
-

 Market20 hours ago
Top 3 Made in USA Coins to Watch This Week
-

 Market19 hours ago
Solana (SOL) Price Risks Dip Below $110 as Bears Gain Control