Market
Is TikTok Running An Unregistered Crypto Exchange in the UK?


TikTok may soon face scrutiny from the Financial Conduct Authority (FCA) over concerns that the platform is operating an unregistered crypto exchange in the UK.
This potential regulatory issue adds to TikTok’s growing list of challenges, including ongoing criticism regarding child safety and privacy concerns.
TikTok’s In-App Currency Attracts UK FCA Attention
Local media reported that a compliance expert wrote a letter to the FCA, the UK’s financial watchdog, detailing how TikTok may be operating an unregistered crypto exchange in the country. The allegation focuses on the platform’s virtual coin system and creator rewards program. Based on the report, these qualify as crypto asset-related activities under the FCA’s framework.
TikTok’s virtual economy, underpinned by its in-app currency called ‘TikTok Coins,’ allows users to purchase virtual tokens with real money. These can be exchanged for virtual gifts, and holders can send them to their favorite content creators.
For the platform, this system enhances user engagement and provides creators with a revenue stream. However, compliance experts see it as a tactic to facilitate unregulated financial transactions, citing regulatory loopholes in the FCA’s oversight.
Read more: Crypto Regulation: What Are the Benefits and Drawbacks?
According to compliance experts, TikTok’s virtual coin system should be subject to anti-money laundering (AML) and counter-terrorism financing (CTF) regulations as enforced by the FCA. This is because it enables the exchange of virtual assets for fiat currency.
Notably, the FCA’s list of approved firms shows TikTok has not registered with the regulator as either a money service business or a digital asset exchange. These two categories would require the social media platform to comply with stringent financial oversight.
Based on the letter to the FCA, the lack of such a registration creates a risk of inadequate supervision. Specifically, the origin of funds used to purchase TikTok Coins remains unclear, making the platform more susceptible to use for illicit activities, including money laundering.
The compliance expert also highlighted TikTok’s lack of transparency in verifying user accounts, particularly those with minimal information. According to the letter, this lack of clear identification could allow users to engage in illicit activities without detection.
In hindsight, however, TikTok banned cryptocurrency advertising on its platform in 2021. Still, many crypto bloggers using the platform continue to lure users into dubious crypto schemes. Last week, TikTok launched a new clicker game called SonicX based on the Solana blockchain.
UK FCA Increases Regulatory Scrutiny for Digital Assets
As these fears spur, it is worth mentioning that the FCA has been stepping up its efforts to regulate the digital asset sector. So far, only 48 crypto firms stand registered on the regulator’s list out of approximately 500 applications. This reflects the UK financial watchdog’s stringent standards, with an 87% rejection rate for crypto firms applying for licenses.
In July, the regulator reinforced its commitment to this mission by fineing Coinbase’s UK division for failing to meet AML standards.
“FCA just fined Coinbase UK subsidiary $4.5 million for serving high risk customers,” one user on X commented at the time.
On the other hand, TikTok’s virtual economy is not the first regulatory clampdown against social media-related platforms. In January, concerns were raised over the Telegram tap-to-earn game Notcoin, a meme coin circulating within the TON blockchain’s ecosystem, with its legitimacy questioned.
Meanwhile, the FCA’s expected probe into TikTok adds to the platform’s list of challenges. According to Forbes, thirteen state attorneys general in the US and the District of Columbia have levied a multi-state lawsuit against TikTok. The lawsuit centers on the platform “creating an intentionally addictive app” that is allegedly harming teenagers and children.
Disclaimer
In adherence to the Trust Project guidelines, BeInCrypto is committed to unbiased, transparent reporting. This news article aims to provide accurate, timely information. However, readers are advised to verify facts independently and consult with a professional before making any decisions based on this content. Please note that our Terms and Conditions, Privacy Policy, and Disclaimers have been updated.
Market
GOAT Price Reaches New High as Correction Risks Mount

Goatseus Maximus (GOAT) price recently reached a new all-time high. The recent price action has been accompanied by strong technical indicators, suggesting an ongoing bullish trend.
However, some signs hint that this rally could be nearing its limit. As the analysis continues, the potential for both continued gains and the risk of a correction in the near future will be explored.
GOAT Current Trend Is Still Strong
GOAT’s ADX is currently at 27.63, down from above 36 last week. This drop suggests a weakening in trend strength.
When ADX was above 36, it indicated a strong trend. Now, with ADX below 30, the trend is still present but less powerful.

The Average Directional Index (ADX) measures trend strength. It ranges from 0 to 100, with values above 25 indicating a strong trend and below 20 suggesting no significant trend.
GOAT ADX of 27.63 shows that it remains in an uptrend, though the momentum is not as strong as before. The uptrend persists, but it may not be as forceful as it was last week.
GOAT Is Close To The Overbought Zone
GOAT’s RSI is currently at 67.63, following a recent price jump and a new all-time high. It has risen sharply from 50 in just a few hours. This swift increase suggests strong buying momentum, pushing GOAT closer to overbought levels.

The Relative Strength Index (RSI) measures the speed and change of price movements. It ranges from 0 to 100, with values above 70 indicating overbought conditions and below 30 suggesting oversold conditions. With GOAT’s RSI nearing 70, it signals that the asset might be overextended.
The recent price surge and all-time high, coupled with the RSI’s current level, suggest that GOAT could face a strong correction soon. That would take GOAT off the top 10 biggest meme coins by market cap.
GOAT Price Prediction: Is a 39% Correction Imminent?
GOAT recently reached its all-time high, and its EMA lines are very bullish.
The price is above all EMA lines, with short-term lines positioned above long-term ones. This alignment suggests strong upward momentum, confirming a healthy uptrend.
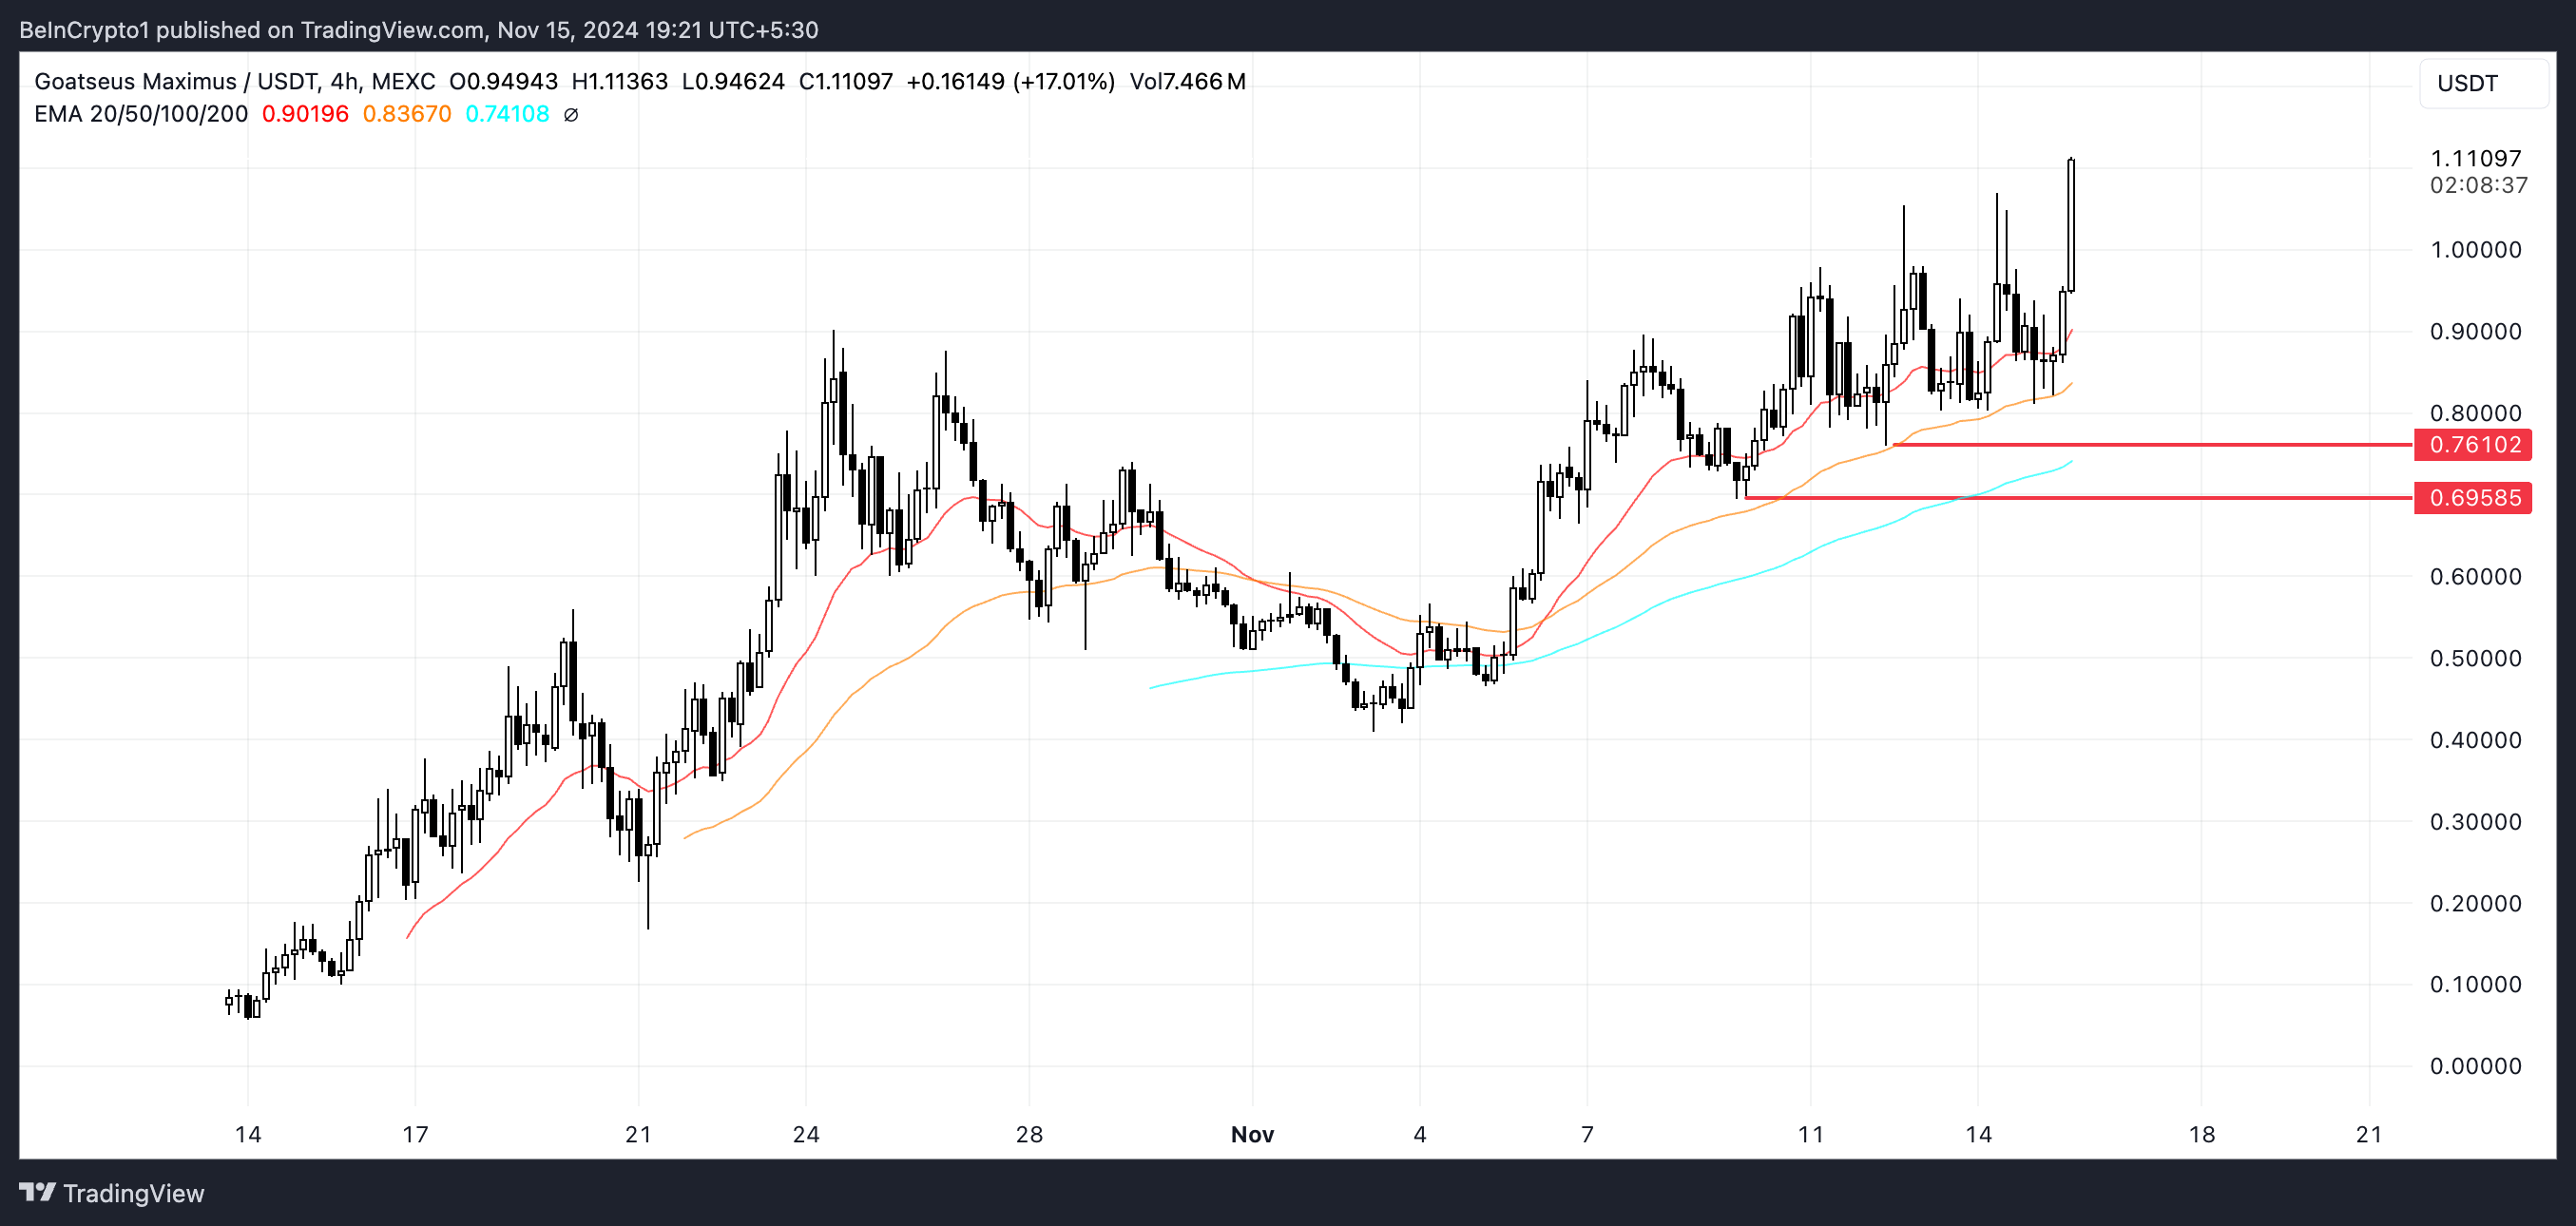
However, the RSI indicates that the meme coin could be entering overbought territory, hinting at a potential correction. The closest support zone for GOAT price is around $0.76.
If this level fails to hold, the price could drop to $0.69, suggesting a possible 39% correction. This highlights the risk of a pullback after such a strong rally.
Disclaimer
In line with the Trust Project guidelines, this price analysis article is for informational purposes only and should not be considered financial or investment advice. BeInCrypto is committed to accurate, unbiased reporting, but market conditions are subject to change without notice. Always conduct your own research and consult with a professional before making any financial decisions. Please note that our Terms and Conditions, Privacy Policy, and Disclaimers have been updated.
Market
Mantra (OM) Price Breaks Records in Strong Upward Momentum

Mantra (OM) price has been on a strong upward trajectory, recently reaching a new all-time high and gaining nearly 20% over the past week. This surge has been supported by strengthening technical indicators, showcasing strong momentum and a clear uptrend.
The combination of bullish EMA alignment and favorable metrics like ADX and Ichimoku Cloud suggests the rally may extend further, with the potential for new highs in the coming days. However, if the uptrend loses momentum, OM could test key support zones that will determine the sustainability of its recent gains.
OM’s Uptrend Is Getting Stronger
The ADX for OM has climbed from nearly 16 to 26.48 in just one day, highlighting a significant increase in trend strength.
An ADX above 25 typically signals a strong trend, and this surge indicates that OM is transitioning from a weak or sideways market to a clear and potentially sustained movement.

ADX, or Average Directional Index, measures trend strength on a scale from 0 to 100. Values below 20 show weak trends, while values above 25 signal strength.
With OM’s ADX at 26.48, the market is confirming an uptrend, supported by growing momentum and a stronger directional push, suggesting further gains could be on the horizon.
Ichimoku Cloud Shows OM Trend Is Bullish
The Ichimoku Cloud chart for OM price shows a bullish trend forming. The price has broken above the cloud (Kumo), which typically signals an uptrend.
Additionally, the cloud ahead (Senkou Span A and B) is green, indicating positive momentum and potential support levels. The price staying above the cloud further supports the likelihood of continued upward movement.
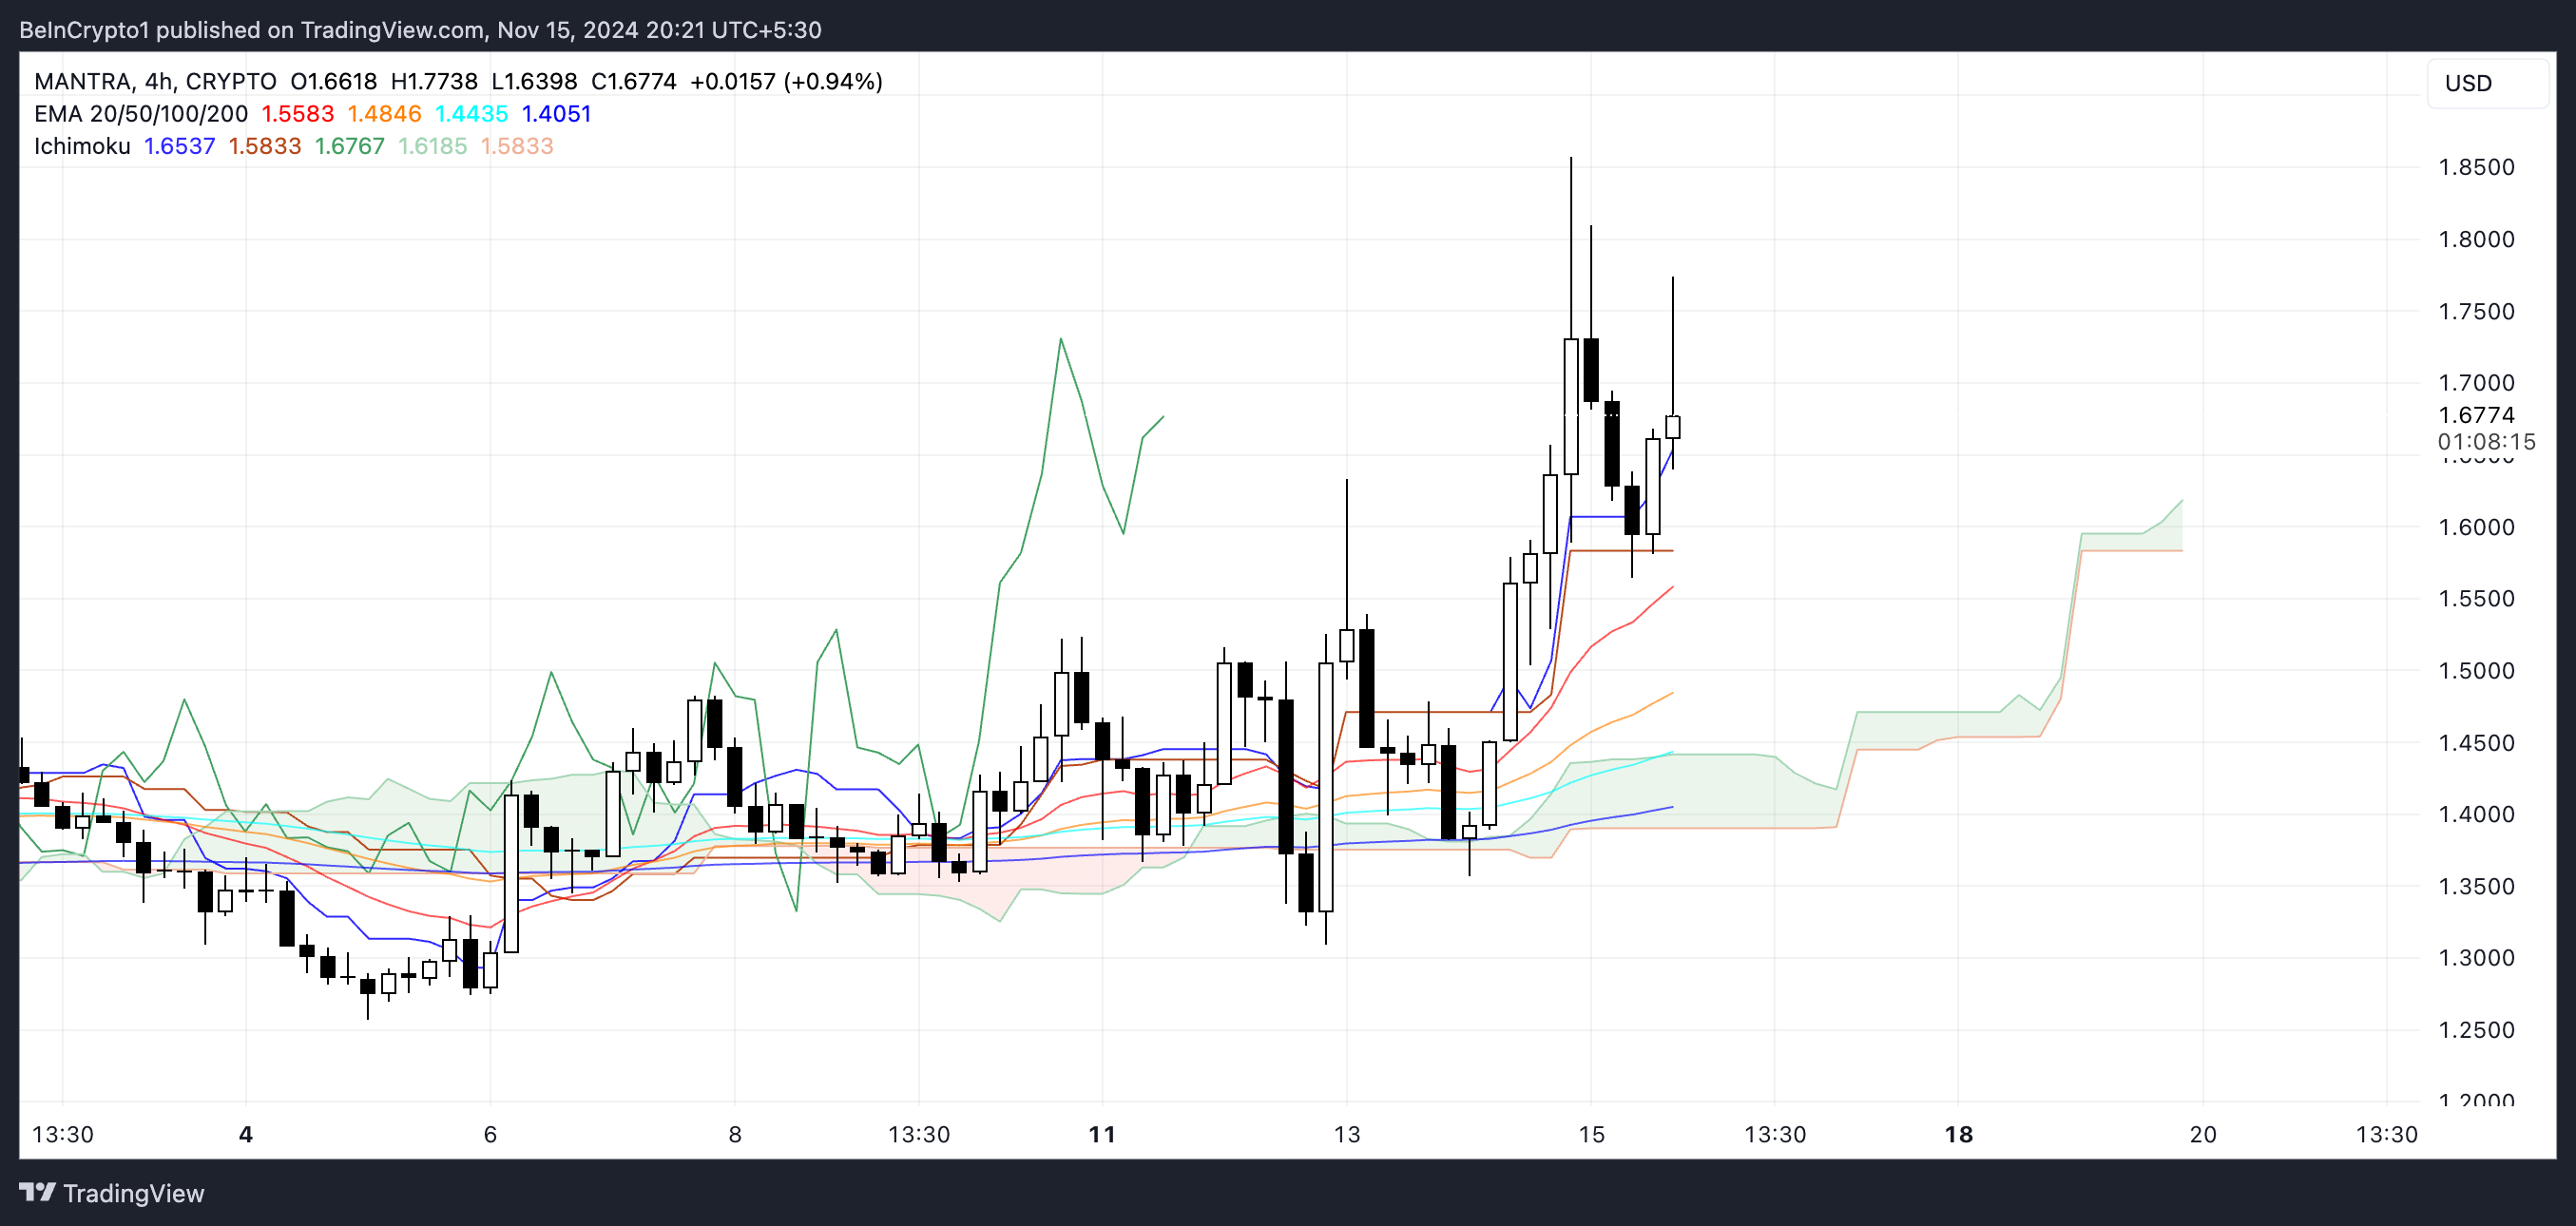
The Tenkan-sen (conversion line) is above the Kijun-sen (base line), another bullish signal suggesting that short-term momentum is stronger than the longer-term trend.
The lagging span (Chikou Span) is also positioned above the price, confirming that recent price action strongly supports the current trend. Together, these elements highlight a strengthening bullish sentiment for OM.
OM Price Prediction: New Highs Soon?
Mantra’s EMA lines currently exhibit a strong bullish alignment, with the price trading above all of them and shorter-term EMAs positioned above the longer-term ones. OM is one of the leading coins in the real-world assets ecosystem today and could benefit heavily if this narrative keeps growing.
This structure reflects solid upward momentum, reinforcing the notion of a sustained uptrend. The recent price action supports this bullish outlook, as OM price has managed to maintain levels well above key EMA thresholds, which often serve as dynamic support during uptrends.
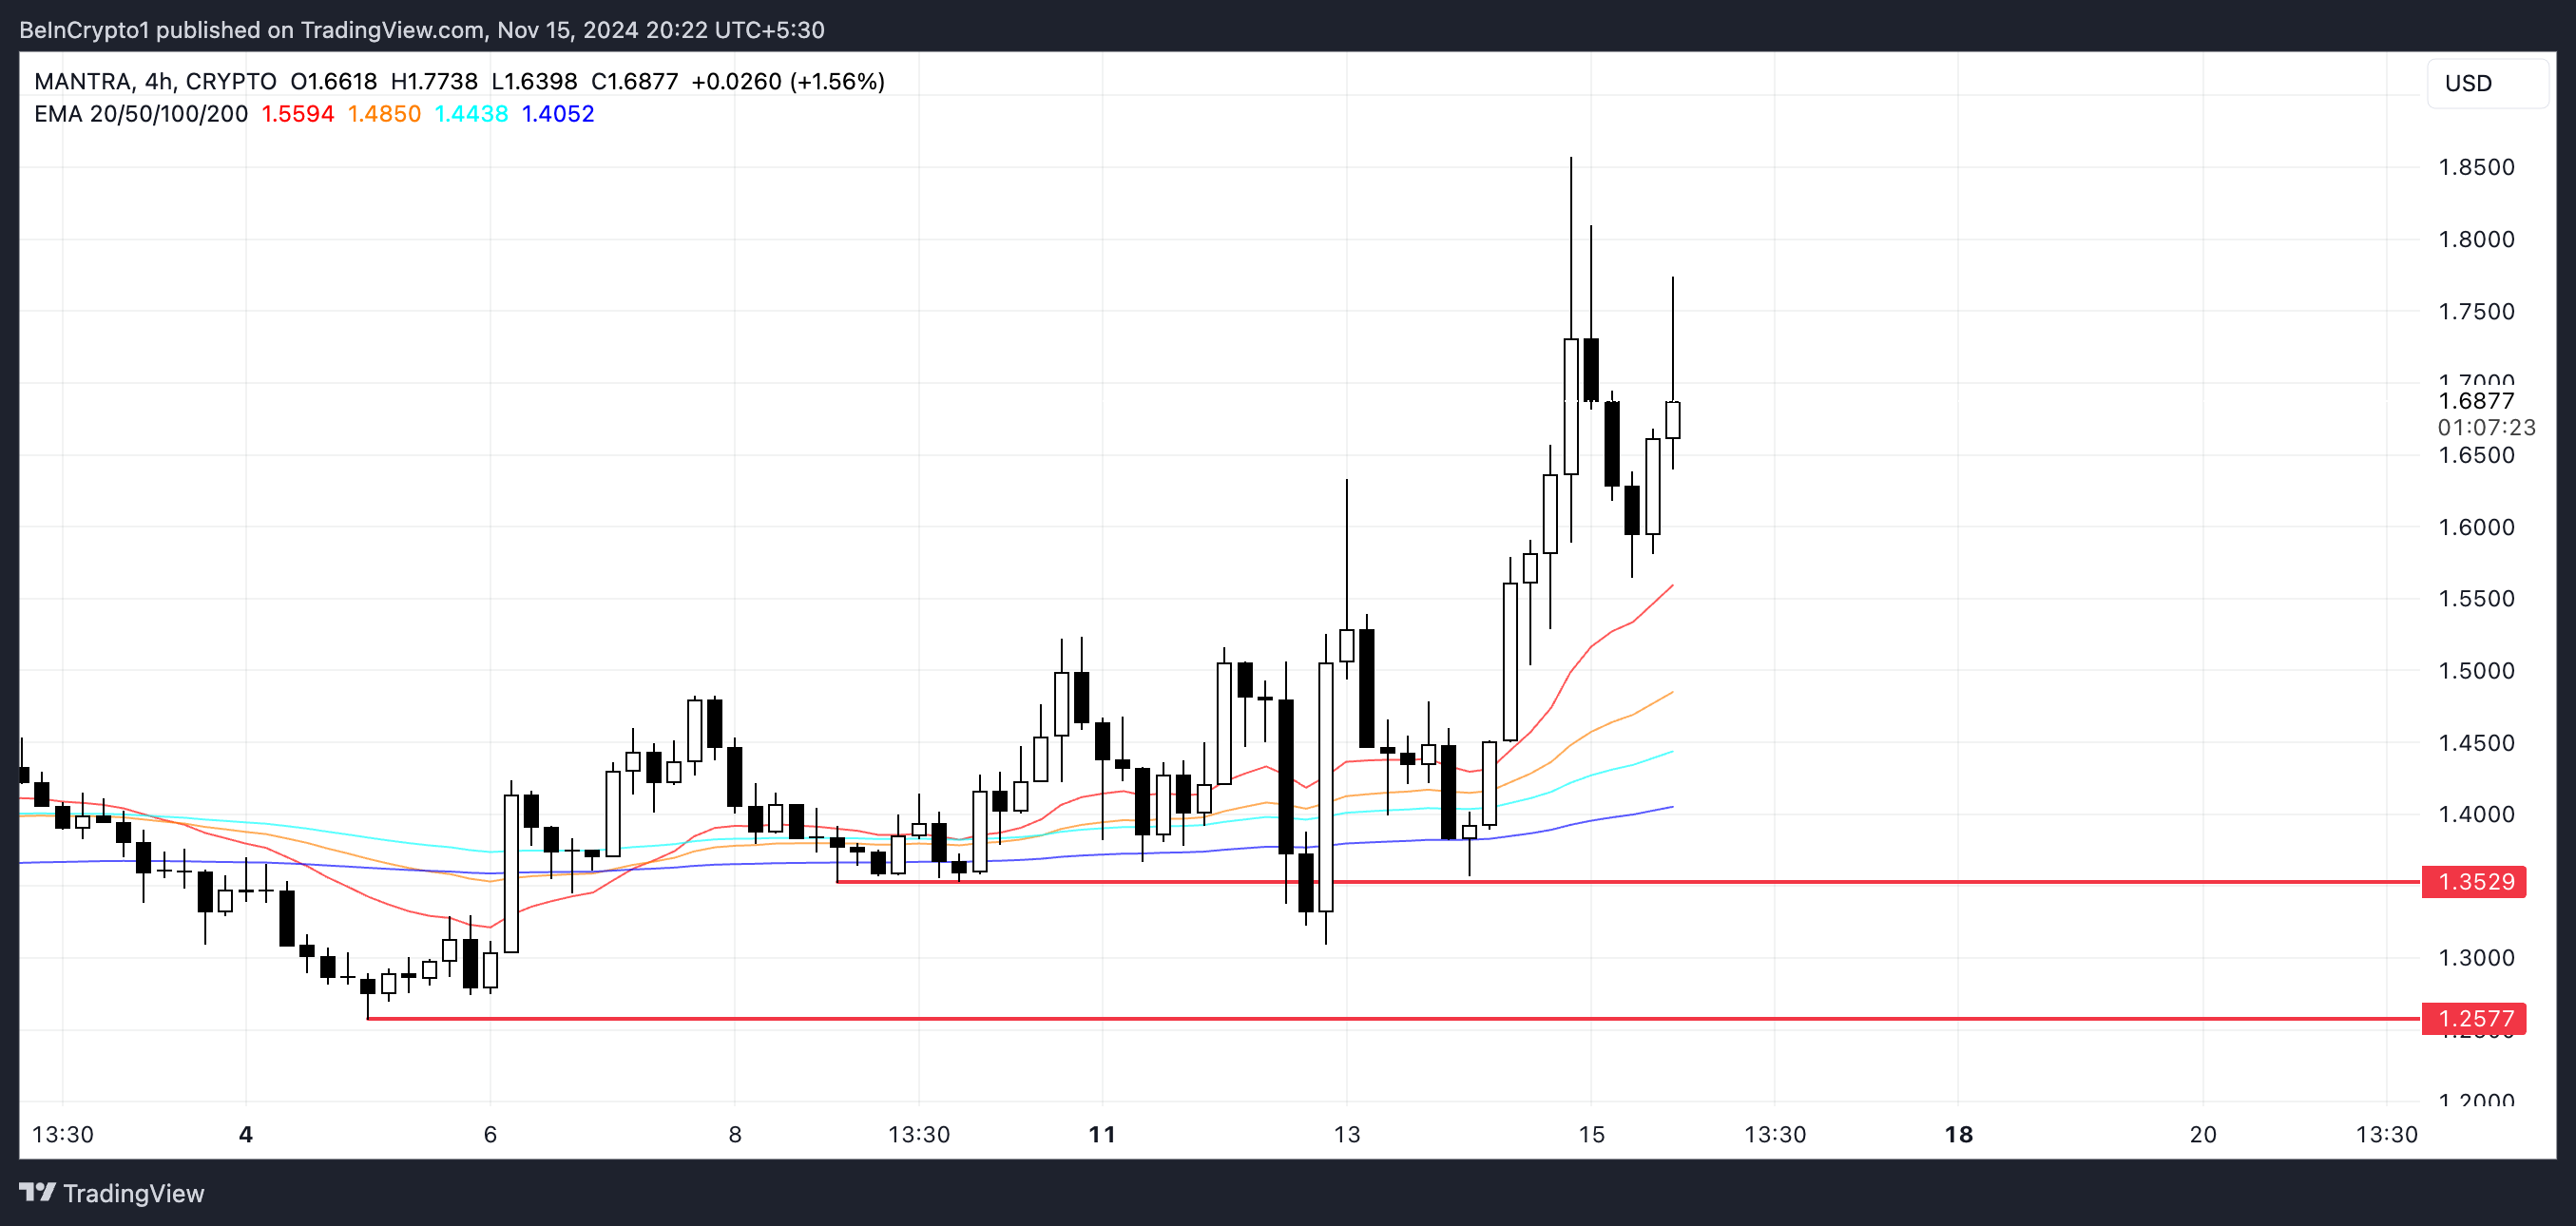
Combining insights from the ADX and Ichimoku Cloud metrics, OM’s recent breakout to a new all-time high of $1.85 could signal the start of an extended rally. If the bullish momentum continues, further attempts at new highs are plausible in the coming days, as the narrative around real-world assets (RWA) recovers traction.
However, if the uptrend falters and reverses, the OM price may test its first strong support zone around $1.35. Should this level fail to hold, the price could decline further, potentially reaching as low as $1.25, a critical area of support.
Disclaimer
In line with the Trust Project guidelines, this price analysis article is for informational purposes only and should not be considered financial or investment advice. BeInCrypto is committed to accurate, unbiased reporting, but market conditions are subject to change without notice. Always conduct your own research and consult with a professional before making any financial decisions. Please note that our Terms and Conditions, Privacy Policy, and Disclaimers have been updated.
Market
WIF Slide Below $3.582 Sparks Fears Of Further Losses
WIF latest dip below the crucial $3.582 support has triggered concerns across the market, as bearish sentiment appears to be gathering strength. Its break below this key level could pave the way for even greater losses, leaving traders to question whether the bulls can stage a comeback or if further declines are inevitable.
As downside risks grow, this analysis aims to examine WIF’s recent drop below the critical $3.582 support level and explore the potential implications of this bearish shift for future price movement. By assessing current market sentiment, key technical indicators, and possible support zones, we seek to determine whether WIF is positioned for more losses or if a reversal may be on the horizon.
Examining WIF’s Drop Below The Critical $3.582 Support Level
On the 4-hour chart, WIF has recently broken below the $3.582 level, triggering bearish momentum as the price moves toward the $2.896 support range and the 100-day Simple Moving Average (SMA). As the bearish trend develops, the market is closely watching for any signs of stabilization or a deeper slide toward key support zones.
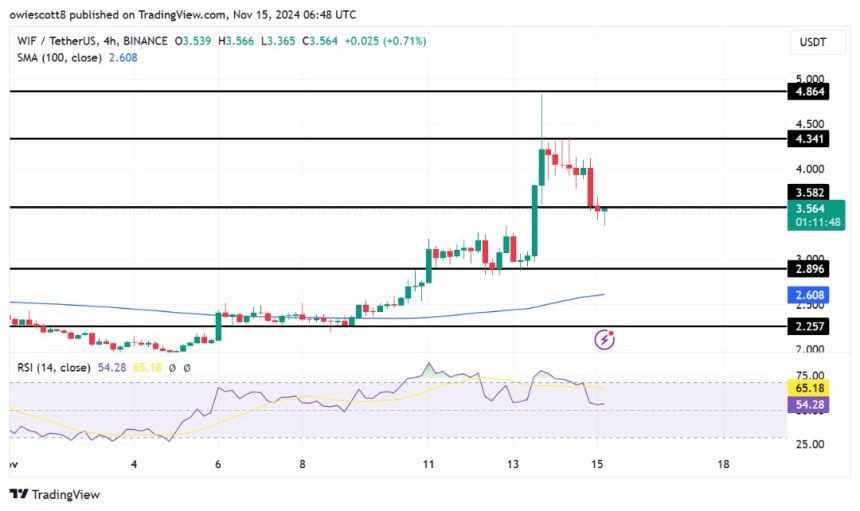
The 4-hour Relative Strength Index (RSI) has dropped from the overbought zone to 53%, signaling a reduction in upward momentum. This move toward neutral territory suggests that buying pressure may be waning, and market participants will be looking for indications of continued decline or a potential shift in momentum.
On the daily chart, WIF is showing strong negative strength, highlighted by a bearish candlestick pattern that has pushed the price below the critical $3.582 support. This pattern indicates that sellers are firmly in control of the market, relentlessly driving the price lower, prompting a strong likelihood of further drops in the near term.
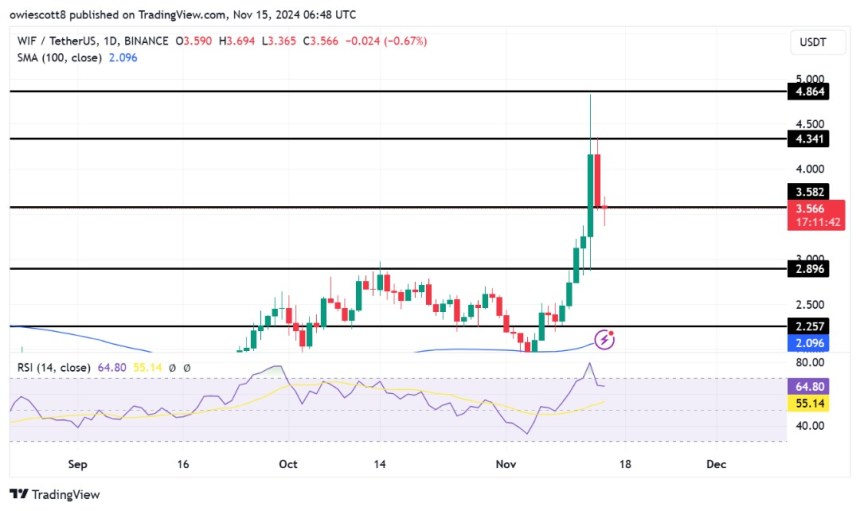
An analysis of the 1-day RSI suggests WIF may face extended losses as it has dropped from a high of 80% to 64%, indicating a reduction in buying pressure. Typically, this decline points to a possible weakness of bullish momentum, with more downward pressure likely if the RSI continues to wane.
Potential Support Zones To Watch If WIF Continues To Drop
If WIF continues to drop, key support zones to watch out for include the $2.896 level, which has previously acted as a critical point for price stabilization. Below this, the next support level to monitor is positioned around $2.257, where WIF may find additional buying interest. A break below these levels could open the door to further declines toward other psychological support zones.
Conversely, if WIF breaks below the $2.896 support level, it could signal the start of a bullish comeback, potentially pushing the price back above the $3.582 level and toward higher resistance points.
-

 Market21 hours ago
Crypto fear and greed rises as investors turn to Vantard
-

 Altcoin21 hours ago
Ethereum ETF Flows Flip Negative Again As ETH Price Slips 6%, What’s Next?
-

 Market20 hours ago
Can Support Prevent Further Losses?
-

 Altcoin19 hours ago
South Korea Exchange Upbit Faces Probe Over KYC Violations, Here’s All
-

 Market22 hours ago
Bitcoin (BTC) Struggles to Hold $90,000 Amid Profit-Taking
-

 Altcoin9 hours ago
Whales Move $30M DOGE Amid Dogecoin Price Correction
-

 Market8 hours ago
600,000 Potential KYC Violations Uncovered
-

 Market7 hours ago
These Are Today Trending Altcoins: HAMMY, Notcoin, PEPE


