
Market
Is the Altcoin Season Here?

After closing at a two-year high of 58.41% on September 19, Bitcoin’s dominance (BTC.D) has initiated its downward trend, noting a 2% decline. Meanwhile, the combined market capitalization of all altcoins (TOTAL2) has surged, indicating a shift in investor sentiment.
However, this is not without a catch. TOTAL 2 has experienced a steady decline, signaling a slowdown in market activity as traders hold back, waiting for the catalyst to spark the anticipated bull run in the year’s final quarter.
Altcoin Season May Be Underway, But With Weak Momentum
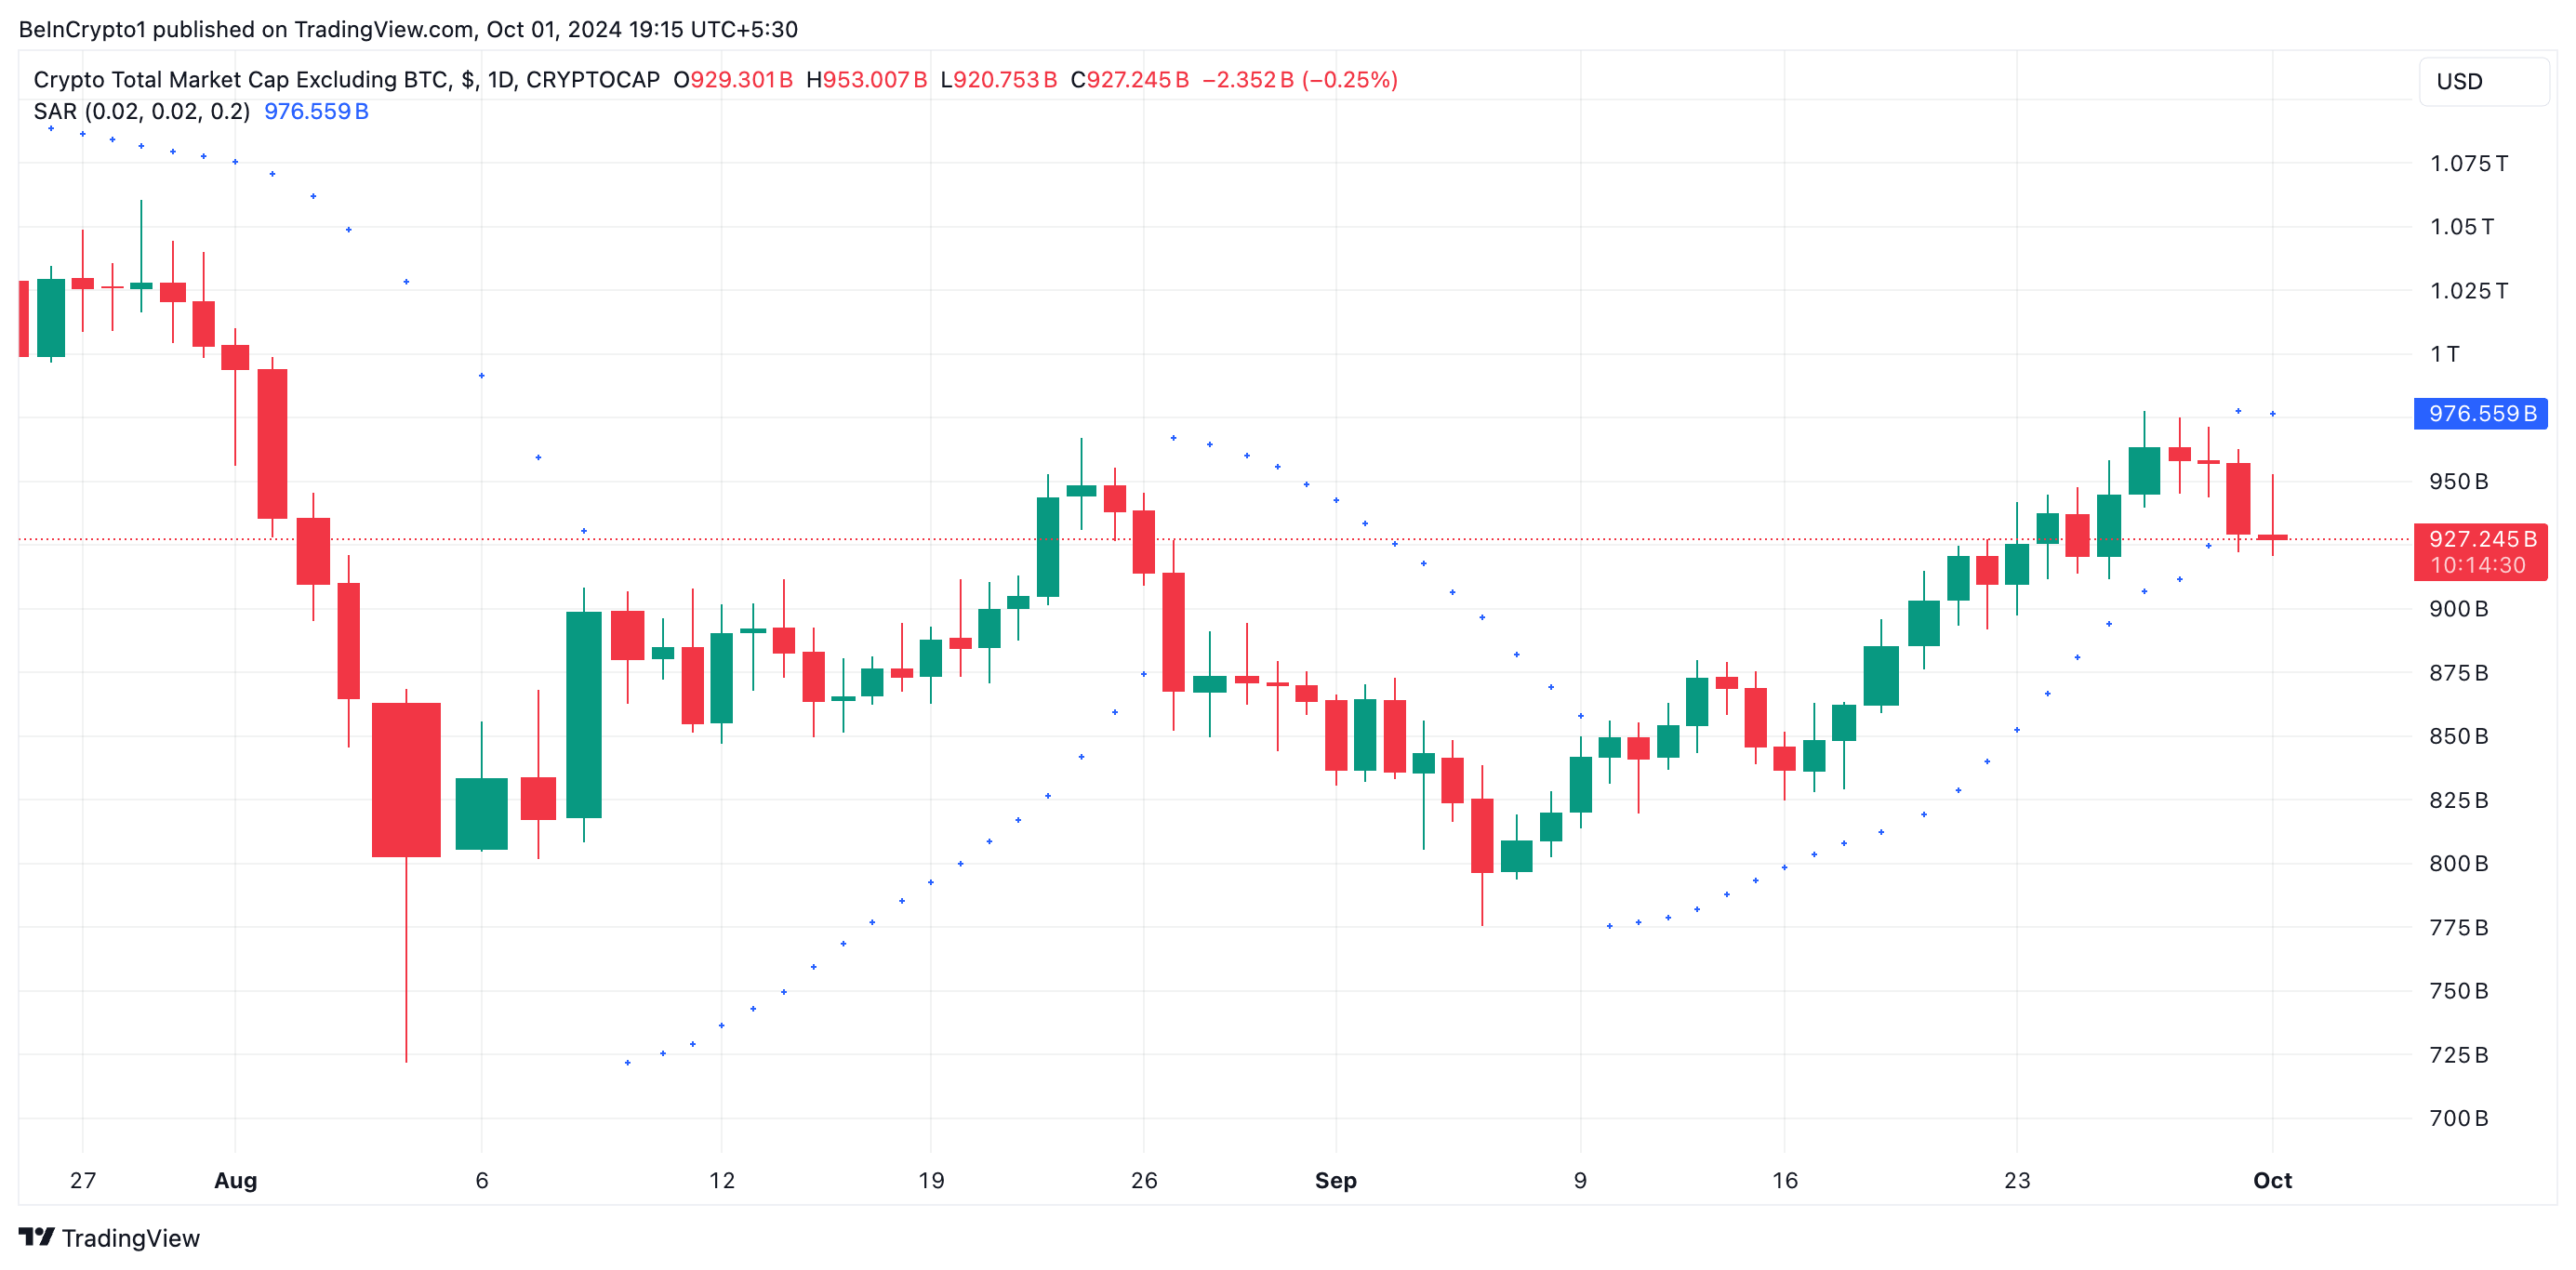
TOTAL2 is currently at $927 billion at press time, climbing by 5% since BTC.D started to fall. This reflects the surge in demand for altcoins over Bitcoin in the past ten days.
However, TOTAL2’s momentum indicators signal that buying pressure has weakened over the past few days. This is driven by a slowdown in broader market activity as traders wait for a trigger to ignite the highly anticipated “Uptober.”
For instance, the size of the histogram bars in TOTAL2’s Moving Average Convergence/Divergence (MACD) indicator has gradually decreased over the past few days.
Read More: 11 Cryptos To Add To Your Portfolio Before Altcoin Season
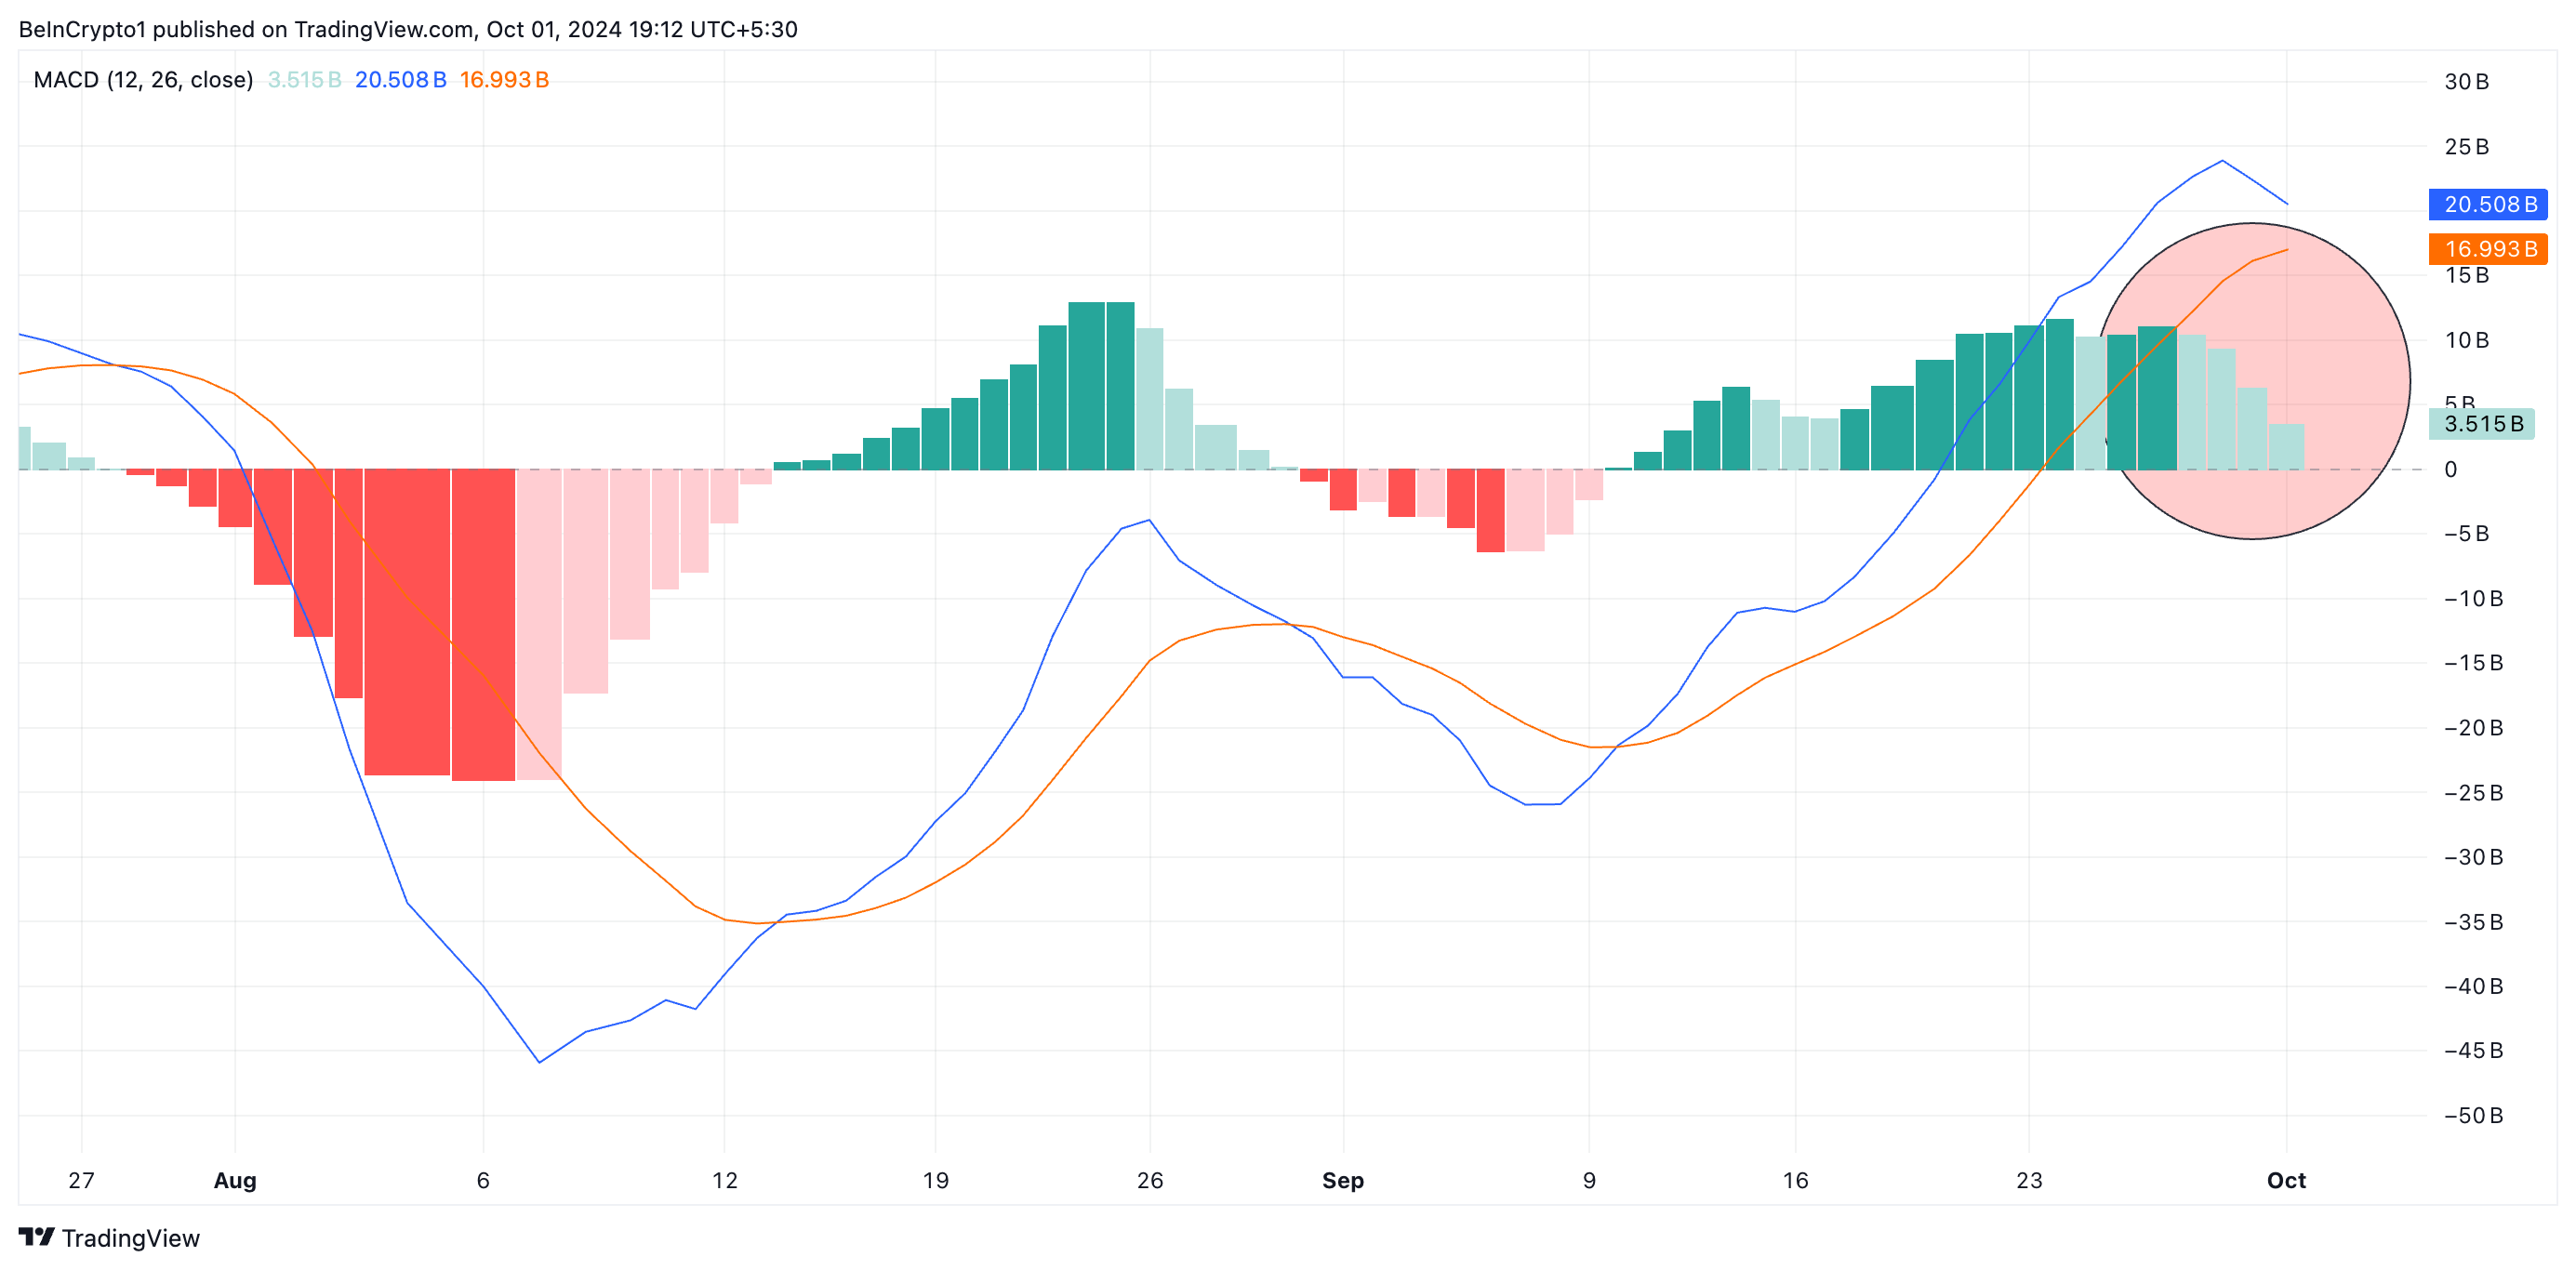
While the MACD line (blue) remains above the signal line (orange), indicating that buying activity is outpacing selling pressure in the altcoin market, the shrinking size of the histogram bars typically signifies a weakening momentum in bullish trends.
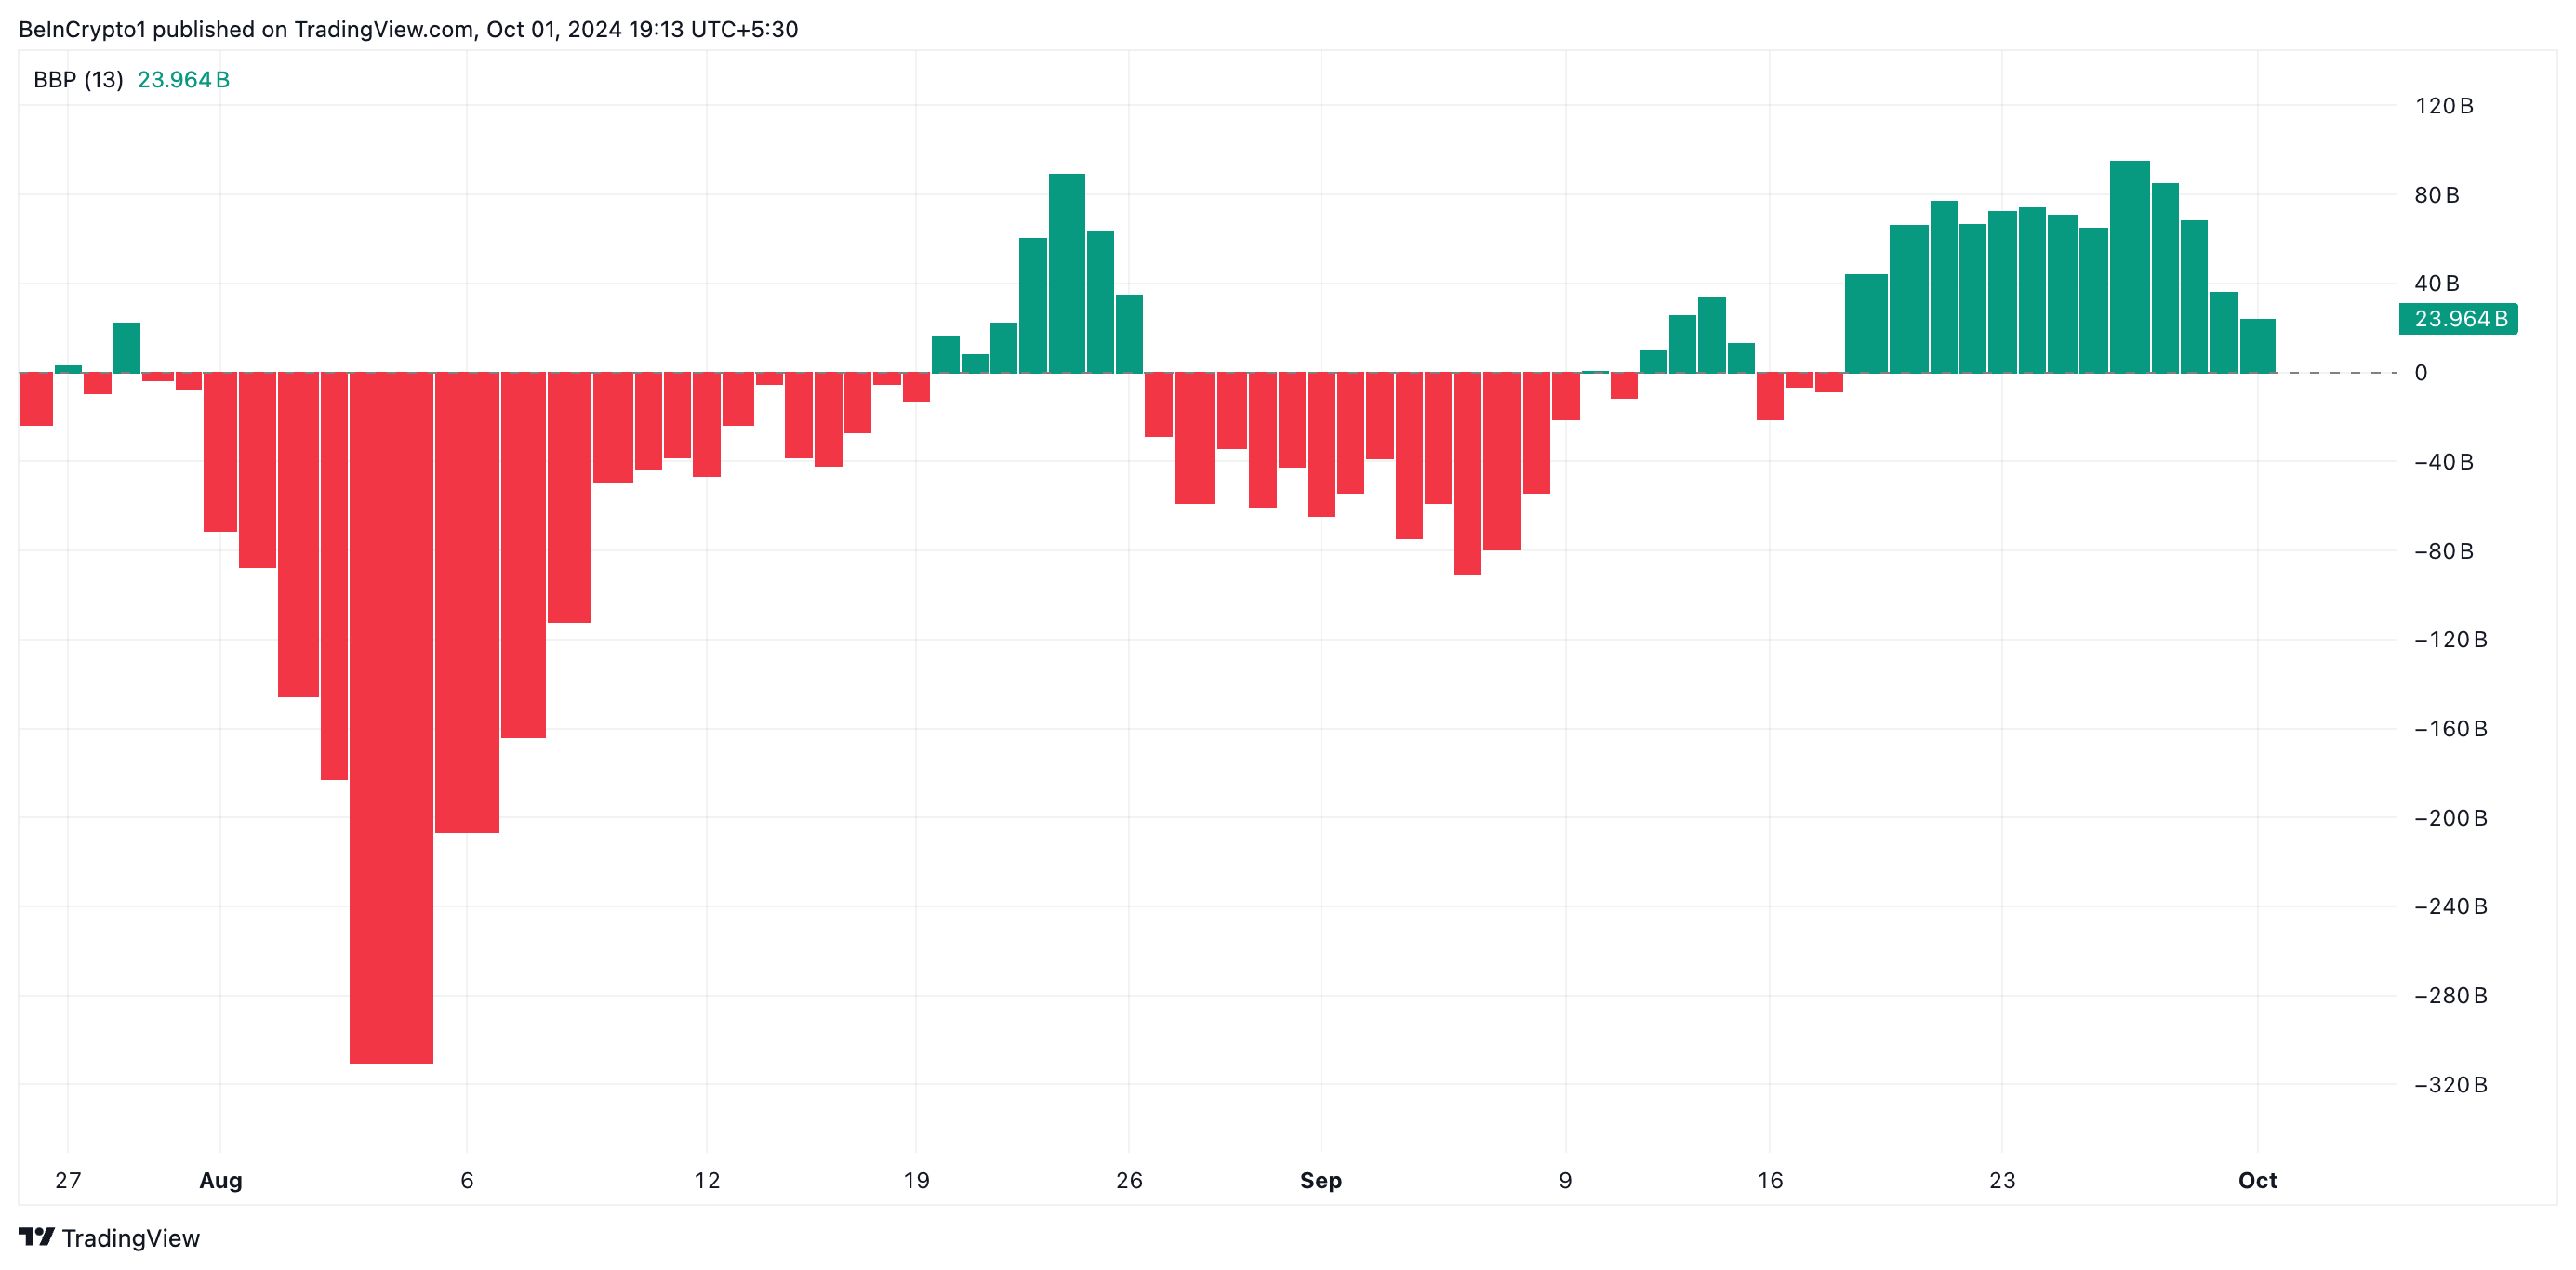
Furthermore, the declining bars of TOTAL2’s Elder-Ray Index, which measures the strength of the bulls and bears in the market, support this position. Although this indicator has shown green bars, indicating that bulls are currently in control, the diminishing size of these bars suggests that buying pressure is weakening and that bulls are gradually losing their grip on the market.
Altseason May Arrive Much Later
After spending 20 days below TOTAL2, the dots of its Parabolic Stop and Reverse (SAR) indicator flipped to the top during Monday’s trading session, signaling a shift in market sentiment. This reversal often indicates that the prevailing uptrend is losing momentum and that a downtrend could begin.
Moreover, according to data from Blockchain Center, the altcoin season commences when at least 75% of the top 50 altcoins outperform Bitcoin over a 3-month period. Currently, only 49 of these assets have surpassed Bitcoin’s performance in the last 90 days. Hence, the altcoin season has not yet arrived.
Disclaimer
In line with the Trust Project guidelines, this price analysis article is for informational purposes only and should not be considered financial or investment advice. BeInCrypto is committed to accurate, unbiased reporting, but market conditions are subject to change without notice. Always conduct your own research and consult with a professional before making any financial decisions. Please note that our Terms and Conditions, Privacy Policy, and Disclaimers have been updated.


A long-time supporter of XRP who is not afraid to speak his mind has issued stunning predictions concerning the future value of the cryptocurrency. His assertions have both interested and confused investors.
Investor Forecasts 50-Fold Return On XRP
As per the Alpha Lions Academy founder Edoardo Farina, an investment of $1,000 in XRP today can increase to more than $50,000 in the future. The estimate is based on the altcoin crossing Farina’s desired price target of $100 per token, from its current value of around $2.
“Buying $1,000 worth right now is really buying over $50,000 in the future when $XRP hits $100+”, Farina tweeted recently.
Farina previously revealed he will not sell any of his XRP holdings until the price reaches at least $100 per token. He terms the coin as sitting at the hub of what he refers to as a “multi-generational pump” and points out its potential function within the international finance system.
XRP @ $2
Buying $1,000 worth right now is really buying over $50,000 in the future when $XRP hits $100+
50x return
— EDO FARINA 🅧 XRP (@edward_farina) April 18, 2025
Minimum Holdings Suggestion Sparks Skepticism
According to reports, Farina urges retail investors to own a minimum of 1,000 XRP tokens. He asserts that such an amount is the minimum one needs in order to take advantage of the use and greater adoption of XRP in the future.
Such opinions regarding the issue have been unequivocal. Farina has reportedly said that individuals who have fewer than 1,000 XRP tokens “don’t care enough about their financial success” and called possessing less than that amount “insanity.”
Though these comments represent Farina’s individual investment strategy, they echo a developing perception among XRP enthusiasts that the asset is undervalued and poised for strong growth if regulatory clarity increases and more businesses embrace it.
Doubters Challenge The Life-Changing Assertions
Not everyone shares Farina’s positive perspective. Doubters have raised issues with his assertion that $1,000 in XRP today may be worth $50,000 someday.
One critic pointed out that even if XRP hits $100 and converts $1,000 into $50,000, this may not be sufficient for early retirement. The remark points out that what appears to be a good return may not necessarily be the life-altering wealth many investors expect.
Questions also arise regarding if XRP will ever hit the $100 level, and if so, how long it would take to arrive there.
Price Target Timeline Indicates Long Way To Go
The journey to $100 looks long for XRP, which is currently trading at about $2. It would need a nearly 5,000% rise from where it is now to reach $100.
Featured image from Pexels, chart from TradingView
Veteran market analyst Peter Brandt has issued a gloomy year-end forecast for XRP, suggesting the asset may struggle to maintain its momentum despite recent gains.
On April 18, Brandt shared his updated analysis on X (formerly Twitter), projecting two possible scenarios for XRP’s market capitalization by year’s end.
Cautionary Outlook for XRP Despite Recent Surge
The first scenario places XRP’s market cap around $116.67 billion, while the second offers a more bearish outlook of just above $60 billion.
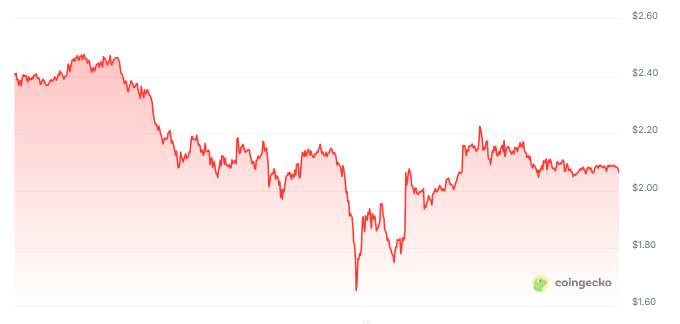
Essentially, both figures imply a decline from XRP’s current valuation of roughly $2.09 per token at a market capitalization of $121 billion.
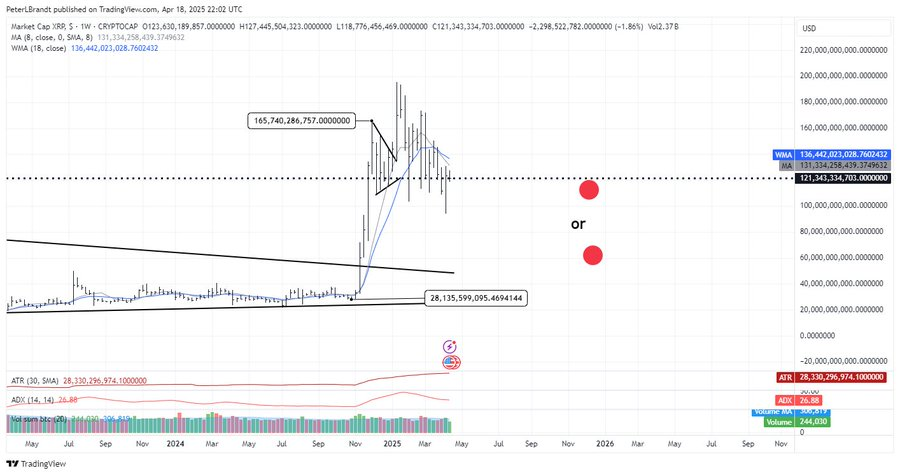
Brandt’s analysis is based on a technical pattern he previously identified on XRP’s price chart.
According to him, the formation resembles a classic head-and-shoulders setup—a pattern that often signals a trend reversal. If this plays out, XRP could fall as low as $1.07.
He added then that a move below $1.90 would confirm the pattern and likely trigger a steep correction of more than 50%. However, a break above $3 could invalidate the bearish outlook.
“XRP is forming a textbook H&S pattern. So, we are now range bound. Above 3.000 I would not want to be short. Below 1.9 I would not want to own it,” Brandt explained.
This cautious forecast follows a remarkable surge in XRP’s price since late 2024.
Following Donald Trump’s return to the White House, the token rallied over 300%, reaching a high of $3.28 before pulling back to its current level.
This price performance has led many investors to believe that the Trump administration’s friendlier stance toward digital assets could help the asset continue its rally.
One major catalyst was the Securities and Exchange Commission’s (SEC) decision to drop several lawsuits against crypto companies, including Ripple.
That shift reduced regulatory uncertainty and sparked renewed interest in XRP, culminating in the launch of exchange-traded funds (ETFs) focused on the product.
Adding to the momentum, Ripple launched its own stablecoin, RLUSD, aiming to tap into a growing segment of the digital asset market.
Still, Brandt’s warning suggests that XRP’s recent rally may not be sustainable if bearish pressure intensifies.
Ripple Not Rushing Into IPO Despite Industry Trend
Amid renewed attention on XRP’s performance, Ripple CEO Brad Garlinghouse has addressed growing speculation about the company going public.
In a recent video shared on X, Garlinghouse made it clear that Ripple does not plan to file for an IPO in 2025.
He emphasized that the company is not actively seeking external funding because it remains financially stable and is prioritizing product development and business expansion.
“Will we IPO in 2025? I think that’s a definitive no…We’ve said there’s no imminent plans to go public,” Garlinghouse stated.
While the company isn’t moving forward with an IPO this year, Garlinghouse didn’t completely close the door.
He noted that Ripple is evaluating whether going public would benefit the business in the long run. However, such a move isn’t a current priority.
“You have to ask yourself, okay, how does Ripple benefit from being a public company? And is it a high priority for us?” he said.
Moreover, Garlinghouse also hinted that the regulatory landscape—especially under new leadership at the SEC—could influence Ripple’s future decisions.
His comments come as several crypto firms, including Kraken and Ciecle, reportedly prepare for IPOs. For now, though, Ripple appears comfortable staying private until conditions become more favorable.
Disclaimer
In adherence to the Trust Project guidelines, BeInCrypto is committed to unbiased, transparent reporting. This news article aims to provide accurate, timely information. However, readers are advised to verify facts independently and consult with a professional before making any decisions based on this content. Please note that our Terms and Conditions, Privacy Policy, and Disclaimers have been updated.

SUI blockchain has been gaining traction in recent weeks, and its market cap is now approaching $7 billion. Fueled by meme coin activity and rising DeFi engagement, the network has seen a notable jump in DEX volume and technical momentum.
While indicators like RSI and EMA lines show early signs of a potential trend shift, overall strength remains mixed. SUI sits at a key crossroads—supported by short-term excitement but still needing stronger confirmation to challenge top-tier chains.
SUI Surges to 5th in DEX Volume, But Still Trails Top Chains
SUI’s recent surge in DEX activity has grabbed attention, largely fueled by growing interest in meme coins and speculative trading on its ecosystem. Over the past seven days, SUI’s DEX volume hit $2.1 billion, marking a 4.49% increase and continuing its steady upward trend.
This momentum has helped SUI outperform other ecosystems, most notably surpassing Arbitrum in the past 24 hours to become the fifth-largest chain by DEX volume.
However, despite the short-term gains, SUI still trails well behind top-tier networks like Base, BNB Chain, Ethereum, and Solana in total DEX activity.

These established ecosystems continue to dominate in terms of liquidity, user base, and overall transaction volume.
While SUI’s rise is notable, especially given its relatively new position in the DeFi ecosystem, it will need to sustain this growth and diversify beyond meme coin hype to truly challenge the leading players.
For now, it remains an exciting underdog with momentum—but not yet a major contender.
SUI Momentum Rebuilds, But Trend Remains Weak
SUI’s RSI is now at 51.86, up from 35.22 just three days ago. This suggests buying pressure has returned after a short-term dip, helping stabilize price action.
The Relative Strength Index (RSI) measures momentum on a scale from 0 to 100. Readings above 70 are considered overbought, while those below 30 indicate oversold conditions.

Sitting near the midpoint, SUI’s RSI points to neutral momentum. It hasn’t crossed above 70 in almost a month, showing that bullish strength has remained limited.
Meanwhile, SUI’s DMI (Directional Movement Index) shows that its ADX is down to 9 from 14.79 just two days ago. The ADX measures trend strength, and anything below 20 signals a weak or nonexistent trend.

The +DI is at 15.83 while the -DI is at 13.15, meaning buyers have a slight edge—but the low ADX suggests that edge isn’t strong. There’s no clear trend dominating the market right now.
Together, the RSI and DMI suggest that SUI is in a consolidation phase. Buyers are showing some activity, but not enough to build a strong, sustained trend—at least for now.
EMA Setup Still Bearish, But SUI Bulls Show Signs of Life
SUI’s EMA lines are still showing a bearish setup, with short-term averages sitting below the long-term ones. However, the gap between them has narrowed, and a potential golden cross may be forming.
A golden cross occurs when a short-term EMA crosses above a long-term one, often seen as a bullish signal. If this plays out, SUI could gain momentum and push toward the $2.28 resistance level.

Breaking above that could open the path toward $2.41 and $2.54. If bullish momentum builds further, SUI blockchain could even test the $2.83 level—its highest since early March.
But if the market fails to hold current levels and selling pressure returns, a correction could begin. In that case, it might fall back to test the $2.02 support.
Losing that support could bring deeper downside, potentially pushing SUI toward $1.71. For now, price action is at a critical point, with both breakout and breakdown scenarios on the table.
Disclaimer
In line with the Trust Project guidelines, this price analysis article is for informational purposes only and should not be considered financial or investment advice. BeInCrypto is committed to accurate, unbiased reporting, but market conditions are subject to change without notice. Always conduct your own research and consult with a professional before making any financial decisions. Please note that our Terms and Conditions, Privacy Policy, and Disclaimers have been updated.

Today’s $1K XRP Bag May Become Tomorrow’s Jackpot, Crypto Founder Says

Ethereum Consolidates In Symmetrical Triangle: Expert Predicts 17% Price Move

Ethereum Accumulators At A Crucial Moment: ETH Realized Price Tests Make-Or-Break Point

What’s Up With BTC, XRP, ETH?

Uniswap Founder Urges Ethereum To Pursue Layer 2 Scaling To Compete With Solana

Expert Reveals Why Consensus 2025 Will Be Pivotal For Pi Network

2.52 Million Altcoins Are Ruining Crypto’s Future

Animoca Brands Valuation Tanks 75% In Two Years, Here’s Why

Crypto exchange BingX hacked for $43 million

Are The Big Players Losing Interest?

Hong Kong’s Securities Association Tips Authorities On Crypto Self-Regulation

Coinbase cbBTC Set to go Live on Solana
2.52 Million Altcoins Are Ruining Crypto’s Future
Animoca Brands Valuation Tanks 75% In Two Years, Here’s Why
Crypto exchange BingX hacked for $43 million
Are The Big Players Losing Interest?
Hong Kong’s Securities Association Tips Authorities On Crypto Self-Regulation
Coinbase cbBTC Set to go Live on Solana
-
 Altcoin18 hours ago
Analyst Reveals Dogecoin Price Can Reach New ATH In 55 Days If This Happens
-
 Market22 hours ago
Cardano (ADA) Moves Sideways, But Bullish Shift May Be Brewing
-
Altcoin21 hours ago
Pi Coin Price Soars As Pi Network Reveals Massive Community Reward Plans.
-

 Market18 hours ago
Binance Mandates KYC Re-Verification For India Users
-
 Market24 hours ago
Canary Capital Aims to Launch TRON-Focused ETF
-

 Market20 hours ago
SCR, PLUME, ALT Tokens Unlocking This Week
-

 Altcoin12 hours ago
Cardano Bulls Secure Most Important Signal To Drive Price Rally
-
 Altcoin22 hours ago
XRP ETF Approval Could Spark a ‘Perfect Storm’ for Ripple Coin: Expert