Market
Is PEPE Price Primed for Another Major Rally?

PEPE’s price has risen 11% in the last 24 hours, sparking speculation on its potential for further growth. Despite some fluctuations, the current trend remains strong. Recent indicators show that while momentum is easing, the possibility for additional gains persists.
A possible golden cross formation suggests that a shift to a stronger uptrend could be on the horizon, with key resistance levels ahead offering room for continued growth.
PEPE Current Trend Is Still Strong
During the recent price surge, PEPE’s ADX climbed above 50, signaling a strong uptrend. Now, the ADX has dropped to 37, suggesting that the trend is losing strength.
While an ADX above 50 shows high momentum, a value of 37 means the market may be cooling down.
Read more: 5 Best Pepe (PEPE) Wallets for Beginners and Experienced Users

The ADX (Average Directional Index) measures the strength of a trend, regardless of its direction. It ranges from 0 to 100, with values above 25 indicating a strong trend and below 20 showing a weak one. An ADX above 50 means a very powerful trend, while 20-40 suggests moderate strength.
With PEPE’s ADX now at 37, the uptrend is still present but not as forceful as before. This drop in momentum could indicate a potential slowdown or a consolidation phase.
This Metric Shows PEPE Isn’t Overbought Yet
PEPE’s Relative Strength Index (RSI) has risen to 57.39, up from 36 just a day ago. This significant increase suggests growing buying interest and momentum in the market. The rapid jump in RSI reflects a shift from a previously neutral to a more bullish sentiment.

RSI measures the speed and magnitude of price movements. It ranges from 0 to 100, with values below 30 indicating an oversold condition and above 70 indicating overbought. PEPE’s RSI is at 57.39, which is still comfortably below the overbought threshold.
This means the price can continue rising without the immediate risk of being overextended, establishing PEPE as one of the biggest gainers in the last week among the most relevant meme coins in the market. The current RSI value suggests that PEPE could maintain its upward movement before hitting overbought levels.
PEPE Price Prediction: A New 25% Price Surge?
PEPE’s EMA lines are still bearish, but the short-term lines are close to crossing above the long-term lines. If this happens, it will form a golden cross, a bullish signal that indicates a potential shift in trend for PEPE price.
A golden cross often suggests that momentum is building, and further price gains may follow.
Read more: Pepe (PEPE) Price Prediction 2024/2025/2030
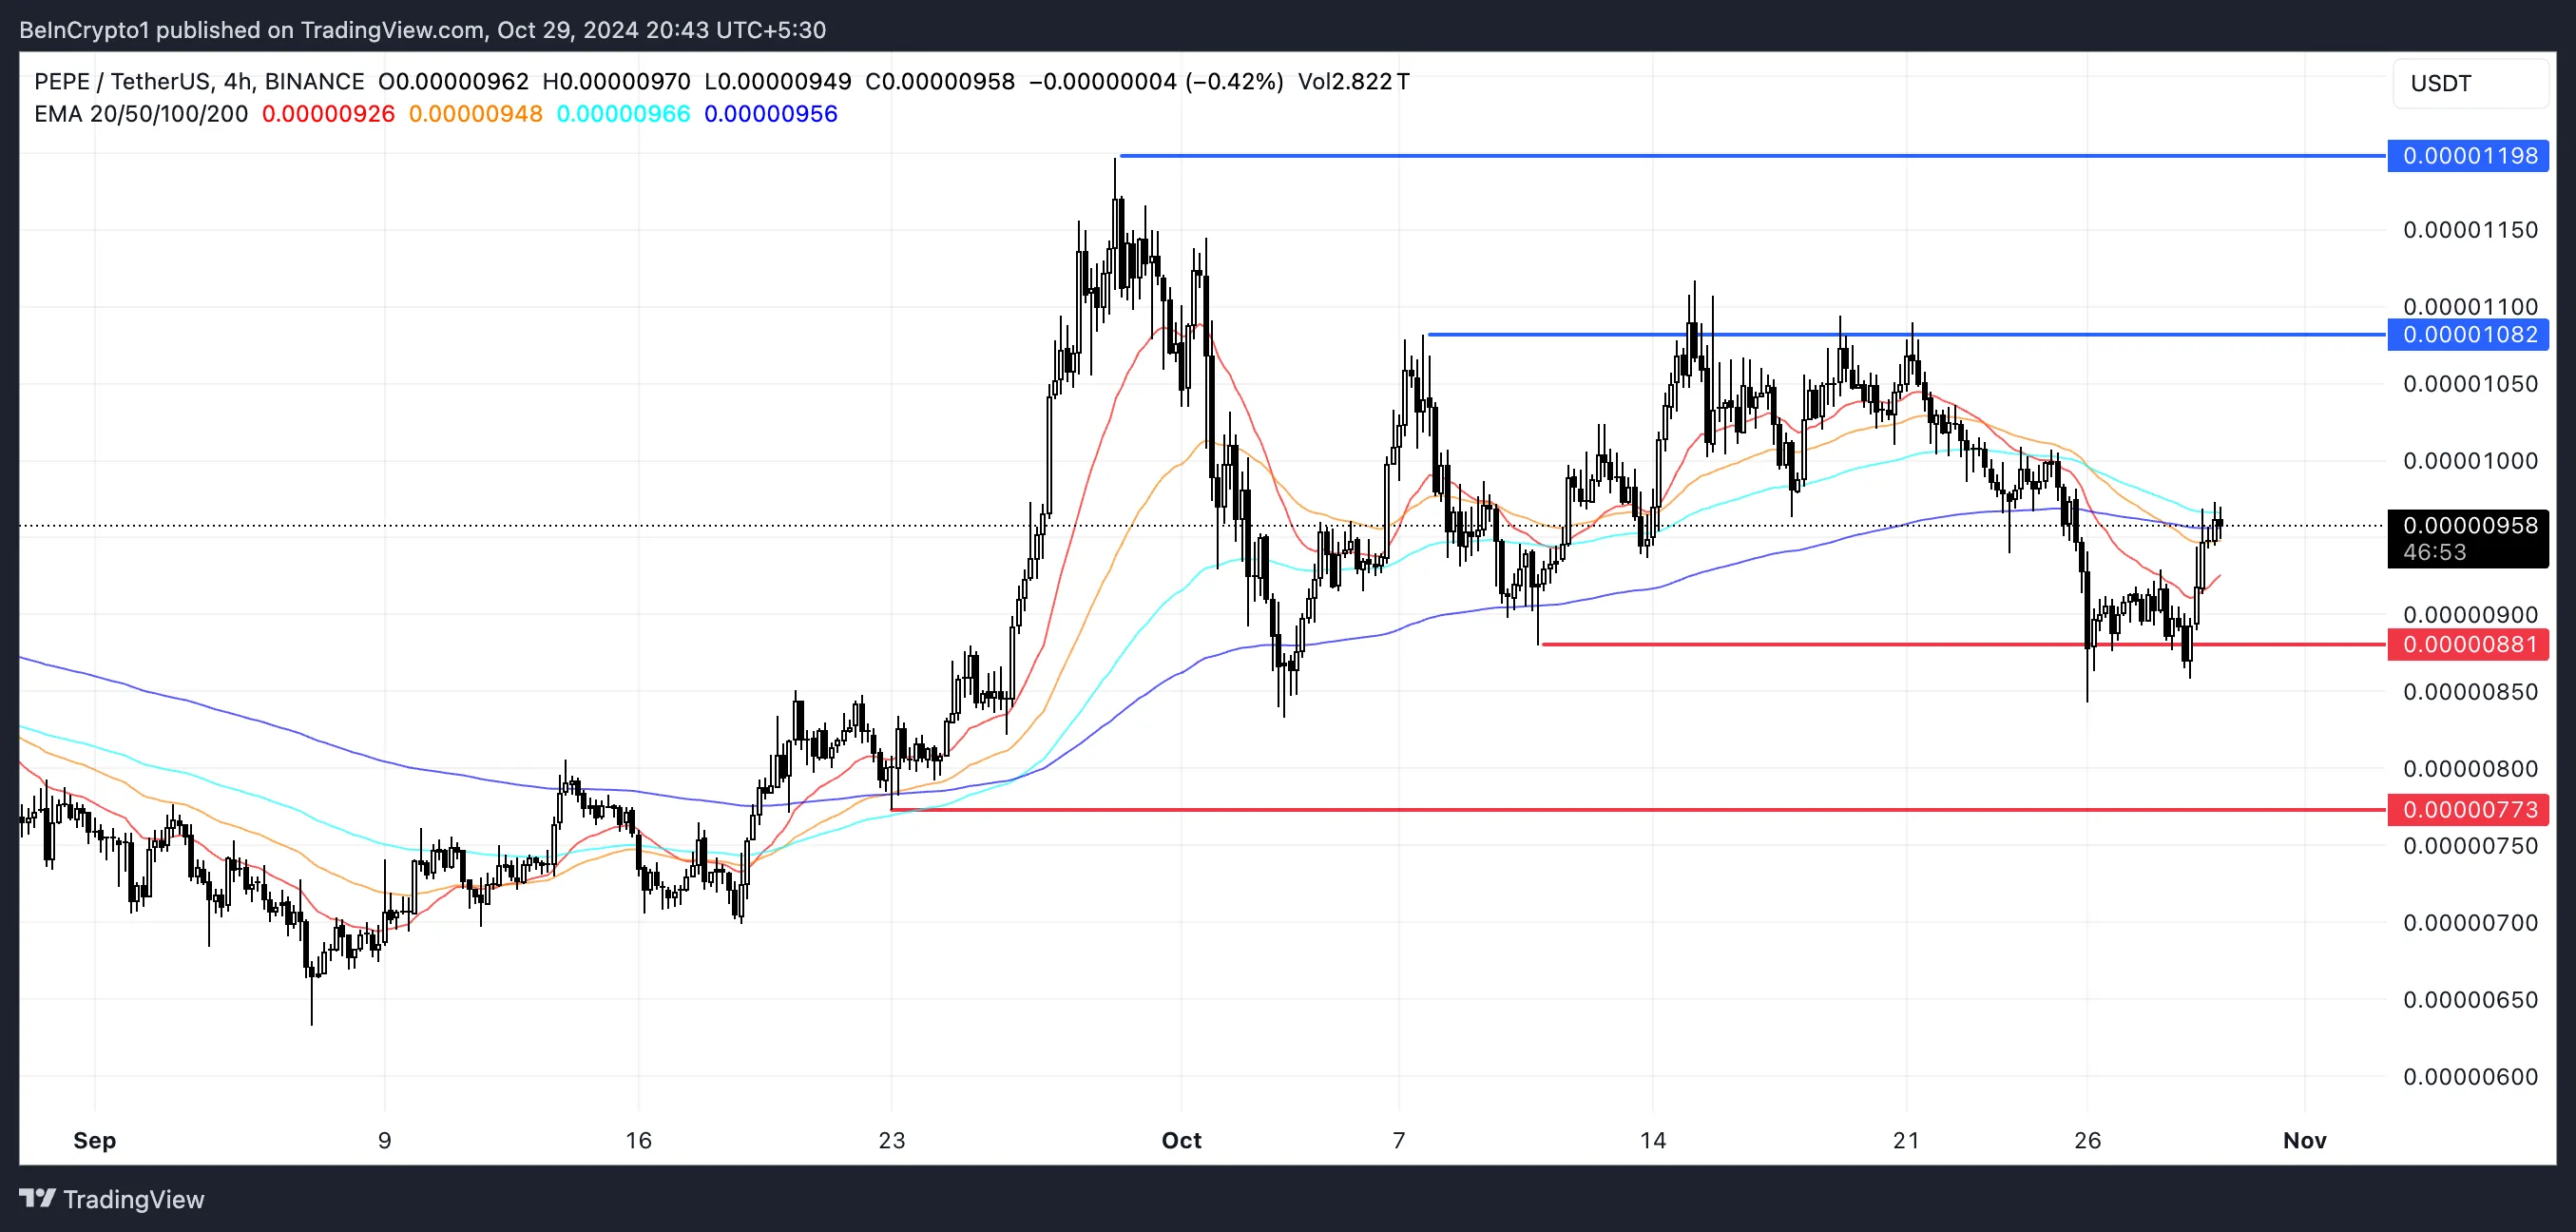
PEPE’s next resistance levels are at $0.00001082 and $0.00001198. Reaching the second one would result in a potential 25% price increase.
However, if the uptrend fails and PEPE enters a downtrend, the price might fall to support levels at $0.00000881 or even $0.00000773. This means that while there is an opportunity for growth, there is also a risk of decline if momentum doesn’t sustain.
Disclaimer
In line with the Trust Project guidelines, this price analysis article is for informational purposes only and should not be considered financial or investment advice. BeInCrypto is committed to accurate, unbiased reporting, but market conditions are subject to change without notice. Always conduct your own research and consult with a professional before making any financial decisions. Please note that our Terms and Conditions, Privacy Policy, and Disclaimers have been updated.
Market
Dogecoin (DOGE) Bleeds Further—Fresh Weekly Lows Test Investor Patience

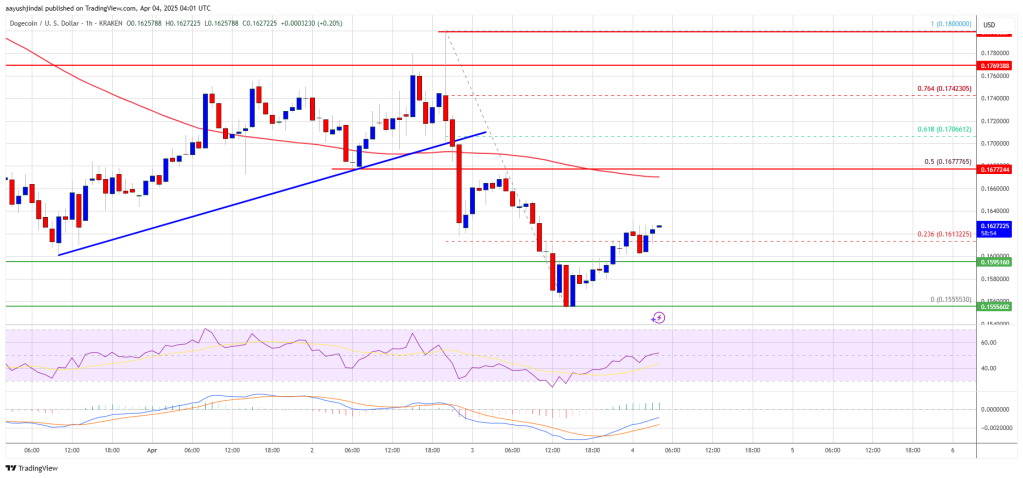
Dogecoin started a fresh decline from the $0.180 zone against the US Dollar. DOGE is consolidating and might struggle to recover above $0.1680.
- DOGE price started a fresh decline below the $0.1750 and $0.170 levels.
- The price is trading below the $0.1680 level and the 100-hourly simple moving average.
- There was a break below a key bullish trend line forming with support at $0.170 on the hourly chart of the DOGE/USD pair (data source from Kraken).
- The price could extend losses if it breaks the $0.1550 support zone.
Dogecoin Price Dips Again
Dogecoin price started a fresh decline after it failed to clear $0.180, like Bitcoin and Ethereum. DOGE dipped below the $0.1750 and $0.1720 support levels.
There was a break below a key bullish trend line forming with support at $0.170 on the hourly chart of the DOGE/USD pair. The bears were able to push the price below the $0.1620 support level. It even traded close to the $0.1550 support.
A low was formed at $0.1555 and the price is now consolidating losses. There was a minor move above the 23.6% Fib retracement level of the downward move from the $0.180 swing high to the $0.1555 low.
Dogecoin price is now trading below the $0.170 level and the 100-hourly simple moving average. Immediate resistance on the upside is near the $0.1650 level. The first major resistance for the bulls could be near the $0.1680 level. It is near the 50% Fib retracement level of the downward move from the $0.180 swing high to the $0.1555 low.
The next major resistance is near the $0.1740 level. A close above the $0.1740 resistance might send the price toward the $0.180 resistance. Any more gains might send the price toward the $0.1880 level. The next major stop for the bulls might be $0.1950.
Another Decline In DOGE?
If DOGE’s price fails to climb above the $0.170 level, it could start another decline. Initial support on the downside is near the $0.160 level. The next major support is near the $0.1550 level.
The main support sits at $0.150. If there is a downside break below the $0.150 support, the price could decline further. In the stated case, the price might decline toward the $0.1320 level or even $0.120 in the near term.
Technical Indicators
Hourly MACD – The MACD for DOGE/USD is now losing momentum in the bearish zone.
Hourly RSI (Relative Strength Index) – The RSI for DOGE/USD is now above the 50 level.
Major Support Levels – $0.1600 and $0.1550.
Major Resistance Levels – $0.1680 and $0.1740.
Market
Bitcoin & Ethereum Options Expiry: Can Prices Stay Stable?

The crypto market is set to see $2.58 billion in Bitcoin and Ethereum options expire today, a development that could trigger short-term price volatility and impact traders’ profitability.
Of this total, Bitcoin (BTC) options account for $2.18 billion, while Ethereum (ETH) options represent $396.16 million.
Bitcoin and Ethereum Holders Brace For Volatility
According to data on Deribit, 26,457 Bitcoin options will expire today, significantly lower than the first quarter (Q1) closer, where 139,260 BTC contracts went bust last week. The options contracts due for expiry today have a put-to-call ratio 1.25 and a maximum pain point of $84,000.
The put-to-call ratio indicates a higher volume of puts (sales) relative to calls (purchases), indicating a bearish sentiment. More traders or investors are betting on or protecting against a potential market drop.
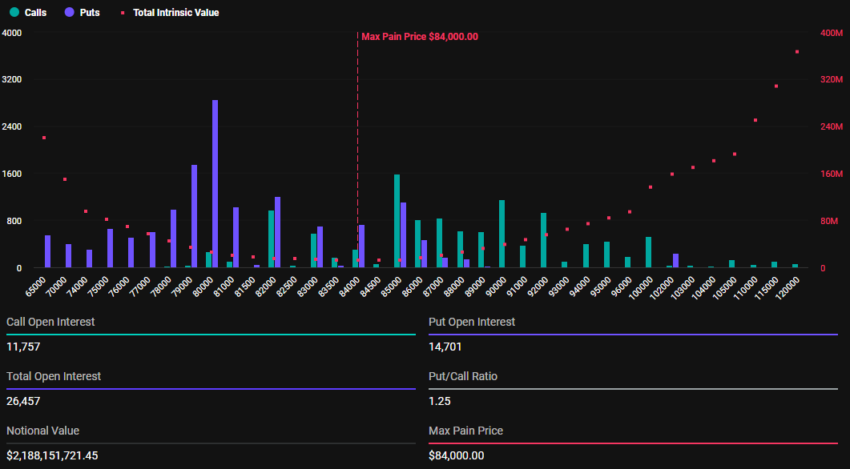
On the other hand, 221,303 Ethereum options will also expire today, down from 1,068,519 on the last Friday of March. With a put-to-call ratio of 1.41 and a max pain point of $1,850, the expirations could influence ETH’s short-term price movement.
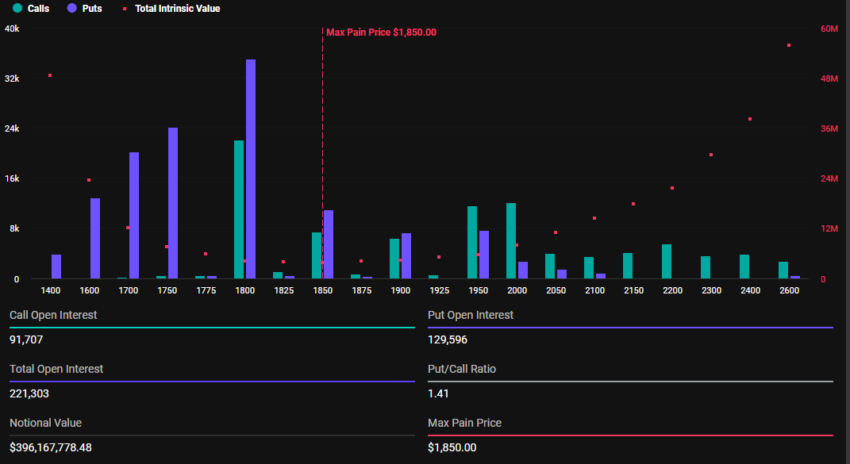
As the options contracts near expiration at 8:00 UTC today, Bitcoin and Ethereum prices are expected to approach their respective maximum pain points. According to BeInCrypto data, BTC was trading at $82,895 as of this writing, whereas ETH was exchanging hands for $1,790.
This suggests that prices might rise as smart money aims to move them toward the “max pain” level. Based on the Max Pain theory, options prices tend to gravitate toward strike prices where the highest number of contracts, both calls and puts, expire worthless.
Nevertheless, price pressure on BTC and ETH will likely ease after 08:00 UTC on Friday when Deribit settles the contracts. However, the sheer scale of these expirations could still fuel heightened volatility in the crypto markets.
“Where do you see the market going next? Deribit posed.
Elsewhere, analysts at Greeks.live explain the current market sentiment, highlighting a bearish outlook. This adds credence to why more traders are betting on or protecting against a potential market drop.
Bearish Sentiment Grips Markets
In a post on X (Twitter), Greeks.live reported a predominantly bearish sentiment in the options market. This follows US President Donald Trump’s tariff announcement.
BeInCrypto reported that the new tariffs constituted a 10% blanket rate and 25% on autos. While this fell short of market expectations, it was still perceived as a negative development, sparking widespread concern among traders.
According to the analysts, options flow reflected this pessimism, with heavy put buying dominating trades.
“Trump’s tariffs are viewed as severe trade disruption… The market’s initial positive reaction with a price spike to $88 was seen as gambling/short covering, followed by a sharp reversal as reality set in about economic impacts. Options flow remains heavily bearish, with traders noting significant put buying, including “700 79k puts for end of April,” wrote Greeks.live analysts.
Traders snapping up 700 $79,000 puts for the end of April signals expectations of a sustained downturn. According to the analysts, the consensus among traders points to continued volatility, with a potential “bad close” below $83,000 today, Friday, April 4. Such an action would erase the earlier pump entirely.
Meanwhile, many traders are adopting bearish strategies, favoring short calls or put calendars. Shorting calls is reportedly deemed the most effective approach in the current climate.
Therefore, while the market’s initial reaction to Trump’s tariffs was a mix of hope and reality, the reversal reflects the broader economic fallout from Trump’s policies. As traders brace for choppy conditions, the bearish outlook in options trading paints a cautious picture for the days ahead.
Global supply chain disruptions and economic uncertainty remain at the forefront of market concerns.
Disclaimer
In adherence to the Trust Project guidelines, BeInCrypto is committed to unbiased, transparent reporting. This news article aims to provide accurate, timely information. However, readers are advised to verify facts independently and consult with a professional before making any decisions based on this content. Please note that our Terms and Conditions, Privacy Policy, and Disclaimers have been updated.
Market
XRP Battle Heats Up—Can Bulls Turn the Tide?

XRP price started a fresh decline below the $2.050 zone. The price is now consolidating and might face hurdles near the $2.10 level.
- XRP price started a fresh decline below the $2.120 and $2.050 levels.
- The price is now trading below $2.10 and the 100-hourly Simple Moving Average.
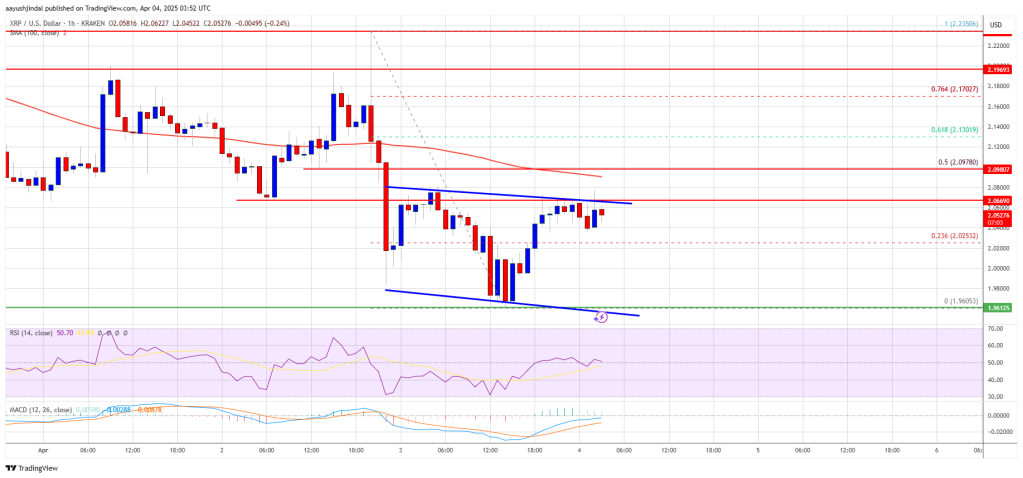
- There is a short-term declining channel forming with resistance at $2.0680 on the hourly chart of the XRP/USD pair (data source from Kraken).
- The pair might extend losses if it fails to clear the $2.10 resistance zone.
XRP Price Attempts Recovery
XRP price extended losses below the $2.050 support level, like Bitcoin and Ethereum. The price declined below the $2.00 and $1.980 support levels. A low was formed at $1.960 and the price is attempting a recovery wave.
There was a move above the $2.00 and $2.020 levels. The price surpassed the 23.6% Fib retracement level of the downward move from the $2.235 swing high to the $1.960 low. However, the bears are active below the $2.10 resistance zone.
The price is now trading below $2.10 and the 100-hourly Simple Moving Average. On the upside, the price might face resistance near the $2.070 level. There is also a short-term declining channel forming with resistance at $2.0680 on the hourly chart of the XRP/USD pair.
The first major resistance is near the $2.10 level. It is near the 50% Fib retracement level of the downward move from the $2.235 swing high to the $1.960 low. The next resistance is $2.120.
A clear move above the $2.120 resistance might send the price toward the $2.180 resistance. Any more gains might send the price toward the $2.2350 resistance or even $2.40 in the near term. The next major hurdle for the bulls might be $2.50.
Another Decline?
If XRP fails to clear the $2.10 resistance zone, it could start another decline. Initial support on the downside is near the $2.00 level. The next major support is near the $1.960 level.
If there is a downside break and a close below the $1.960 level, the price might continue to decline toward the $1.920 support. The next major support sits near the $1.90 zone.
Technical Indicators
Hourly MACD – The MACD for XRP/USD is now losing pace in the bearish zone.
Hourly RSI (Relative Strength Index) – The RSI for XRP/USD is now above the 50 level.
Major Support Levels – $2.00 and $1.960.
Major Resistance Levels – $2.10 and $2.120.
-

 Market22 hours ago
IP Token Price Surges, but Weak Demand Hints at Reversal
-

 Ethereum21 hours ago
Ethereum Trading In ‘No Man’s Land’, Breakout A ‘Matter Of Time’?
-

 Bitcoin21 hours ago
BlackRock Approved by FCA to Operate as UK Crypto Asset Firm
-

 Market21 hours ago
HBAR Foundation Eyes TikTok, Price Rally To $0.20 Possible
-

 Altcoin21 hours ago
John Squire Says XRP Could Spark A Wave of Early Retirements
-

 Altcoin24 hours ago
VanEck Seeks BNB ETF Approval—Big Win For Binance?
-

 Market20 hours ago
10 Altcoins at Risk of Binance Delisting
-

 Market19 hours ago
EDGE Goes Live, RSR Added to Roadmap


