
Market
Is Nick Szabo the Real Satoshi Nakamoto?
In a few hours, the world may finally learn the true identity of Satoshi Nakamoto, the enigmatic creator of Bitcoin (BTC).
In the run-up to the big reveal, speculation has run wild, with theories ranging from NSA involvement to various individuals like Nick Szabo and Adam Back.
10X Says Nick Szabo Is Satoshi
The crypto community remains divided over the true identity of Bitcoin’s creator, Satoshi Nakamoto, with debates reigniting ahead of an upcoming HBO documentary that promises to unveil their candidate. This ongoing speculation plays into two main theories: that Satoshi is either a single individual or part of a larger group. The principle of Occam’s Razor — favoring the simplest explanation — supports the idea of a sole inventor, but some argue that Bitcoin’s creation could be more complex.
A strong contender for Satoshi’s identity is Nick Szabo, a computer scientist and cryptographer. 10X Research, a well-regarded source for cryptocurrency insights, has pointed to Szabo as the likely figure behind Bitcoin, citing his early work on decentralized currencies and cryptographic techniques as key indicators.
“The most likely inventor of Bitcoin appears to be Nick Szabo, who developed the phrase and concept of smart contracts in the ’90s and designed a mechanism in 1998 for a decentralized currency called Bit Gold,” an excerpt in the research reads.
Read more: What Is a Satoshi? Everything About Bitcoin’s Smallest Unit
Szabo is a visionary who developed the concept of smart contracts in the 1990s. He constructed a decentralized currency mechanism known as Bit Gold, using his ideas combined with Glenn M. Lilly’s hashing algorithms. In the early 2000s, he assisted the US National Security Agency (NSA) in laying the groundwork for what eventually became the backbone of Bitcoin.
Interestingly, Szabo’s history has sparked further debate around his potential connection to Satoshi Nakamoto. He worked on digital cash initiatives and wrote prescient blog posts discussing the fundamental principles of currency and trust. Szabo also altered the dates of his writings to align with key moments in Bitcoin’s development timeline.
Taken together, these add an intriguing layer to the mystery surrounding the true identity of the anonymous and elusive Bitcoin creator.
More Satoshi Nakamoto Theories Demystified
Meanwhile, another potential candidate for Satoshi Nakamoto, Adam Back, has actively distanced himself from the speculation. After a user on X (formerly Twitter) asked him to explain beyond a reasonable doubt why he is not the anonymous Bitcoin creator, Back responded by clearly stating that he is not Satoshi.
“In 2013 I went on Bitcoin-wizards IRC and asked lots of questions to catch up with bitcoin details. For example, address holding balance vs utxo coin, etc. here are logs of that IRC channel, so developers who were in the channel are confident it’s not me,” Back explained.
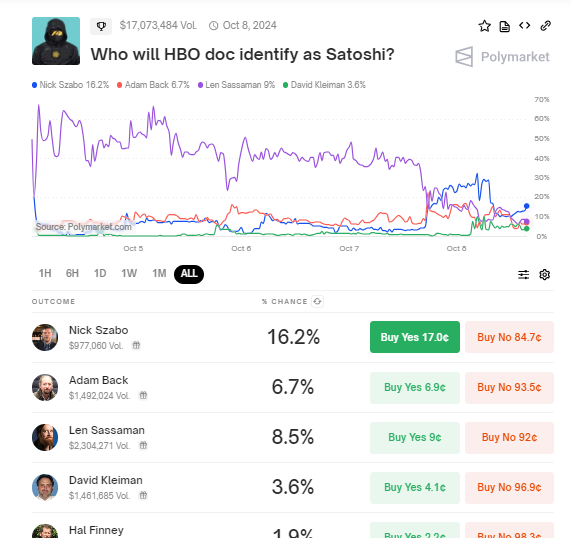
Another individual stricken from the list is Len Sassaman, who was previously a favored candidate for Satoshi Nakamoto according to Polymarket bettors. As of Monday, Sassaman led the odds, but his likelihood dropped after his widow, Meredith L. Patterson, denied the speculation.
“Meredith L Patterson, Len Sassaman’s widow, denied the speculation that Len Sassaman was Satoshi Nakamoto in an interview. HBO never contacted her when making the documentary,” WuBlockchain reported.
Amidst ongoing speculation, the latest Polymarket data shows bettors increasingly backing Nick Szabo, supported by 10X Research as a leading candidate for Satoshi Nakamoto.
Read more: What Is Bitcoin? A Guide to the Original Cryptocurrency
With HBO’s upcoming documentary expected to potentially reveal Bitcoin’s creator, some, like Adam Back, continue to argue that maintaining Satoshi’s anonymity is beneficial. They believe that Bitcoin’s decentralized nature should stay free from sovereign control, a principle that aligns with the cryptocurrency’s foundational ideals of freedom and autonomy.
Whether Satoshi’s identity will be unveiled or the mystery deepens further remains uncertain, but the debate highlights the core values that have driven Bitcoin’s success.
Disclaimer
In adherence to the Trust Project guidelines, BeInCrypto is committed to unbiased, transparent reporting. This news article aims to provide accurate, timely information. However, readers are advised to verify facts independently and consult with a professional before making any decisions based on this content. Please note that our Terms and Conditions, Privacy Policy, and Disclaimers have been updated.


Reason to trust
![]()
Strict editorial policy that focuses on accuracy, relevance, and impartiality
Created by industry experts and meticulously reviewed
The highest standards in reporting and publishing
Strict editorial policy that focuses on accuracy, relevance, and impartiality
Morbi pretium leo et nisl aliquam mollis. Quisque arcu lorem, ultricies quis pellentesque nec, ullamcorper eu odio.
Ethereum price started a increase from the $1,550 zone. ETH is now rising and might attempt to recover above the $1,650 resistance.
- Ethereum started a fresh increase above the $1,580 and $1,600 levels.
- The price is trading above $1,600 and the 100-hourly Simple Moving Average.
- There was a break above a connecting bearish trend line with resistance at $1,590 on the hourly chart of ETH/USD (data feed via Kraken).
- The pair could start a fresh increase if it clears the $1,650 resistance zone.
Ethereum Price Eyes Upside Break
Ethereum price remained stable above the $1,500 level and started a fresh increase, like Bitcoin. ETH traded above the $1,550 and $1,600 levels to enter a short-term positive zone.
There was a break above a connecting bearish trend line with resistance at $1,590 on the hourly chart of ETH/USD. The pair even cleared the $1,620 resistance. A high was formed at $1,644 and the price is stable above the 23.6% Fib retracement level of the upward move from the $1,566 swing low to the $1,644 high.
Ethereum price is now trading above $1,600 and the 100-hourly Simple Moving Average. On the upside, the price seems to be facing hurdles near the $1,640 level. The next key resistance is near the $1,650 level. The first major resistance is near the $1,680 level.

A clear move above the $1,680 resistance might send the price toward the $1,720 resistance. An upside break above the $1,720 resistance might call for more gains in the coming sessions. In the stated case, Ether could rise toward the $1,800 resistance zone or even $1,840 in the near term.
Downside Correction In ETH?
If Ethereum fails to clear the $1,650 resistance, it could start a downside correction. Initial support on the downside is near the $1,620 level. The first major support sits near the $1,605 zone and the 50% Fib retracement level of the upward move from the $1,566 swing low to the $1,644 high.
A clear move below the $1,605 support might push the price toward the $1,580 support. Any more losses might send the price toward the $1,550 support level in the near term. The next key support sits at $1,500.
Technical Indicators
Hourly MACD – The MACD for ETH/USD is gaining momentum in the bullish zone.
Hourly RSI – The RSI for ETH/USD is now above the 50 zone.
Major Support Level – $1,600
Major Resistance Level – $1,650
Barry Silbert, CEO of Digital Currency Group, has stated that Bittensor (TAO) has the potential to outperform Bitcoin (BTC) as a global store of value.
His comments come amid notable growth in the Bittensor network, with its subnet ecosystem market capitalization and the TAO token’s price on the rise.
Will Bittensor’s Decentralized AI Model Outperform Bitcoin’s Legacy?
In a recent interview with Raoul Pal, Silbert highlighted the growing influence of artificial intelligence (AI) in the crypto sector. According to him, Bittensor is at the forefront of this revolution, representing the “next big era for crypto.”
“You had the Bitcoin and the Ethereum and the NFTs, and you had the layer 2s and DeFi. I think this is the next big investment theme for crypto,” Silbert stated.
He went on to explain that Bittensor shares the same pioneering spirit as early Bitcoin. Still, its purpose extends beyond financial sovereignty.
“The boldest prediction that I could make for Bittensor is it could be a better version of Bitcoin as a global store of value,” he claimed.
He argued that instead of the $10 to $12 billion spent annually to secure the Bitcoin network, that same amount could be redirected toward incentivizing a global network of individuals working to solve major world problems. He envisions this money fostering innovation on a massive scale, with the potential to grow into a multi-billion-dollar ecosystem.
While acknowledging the value of securing the Bitcoin network, Silbert emphasized that Bittensor’s potential lies in its ability to harness this vast financial backing to address real-world challenges.
He noted that Bittensor operates on a similar economic model to Bitcoin, with halving mechanisms and decentralization, positioning it as a powerful contender in the quest for a more impactful and value-driven global network.
Silbert also noted that while plenty of decentralized AI projects have emerged, Bittensor has set itself apart. He referred to it as having reached “escape velocity.” This term is used to convey a project’s rapid growth and increasing market influence.
“99.9% of crypto tokens that are out there have no reason to exist and are worthless,” he added.
Market data reflects the growing enthusiasm for Bittensor. Notably, amid the ongoing volatility, TAO has fared well in comparison to the broader market, rising 32.1% in the last week. At press time, the altcoin was trading at $328, up 7.2% over the past day.

Additionally, TAO is currently the top trending cryptocurrency on CoinGecko, underlining its rising popularity among investors. Google Trends data further proves the growing interest in Bittensor. The search volume peaked at 100 at the time of writing.
Meanwhile, the Bittensor ecosystem is also seeing notable progress. The latest data indicated that the market capitalization of Bittensor’s subnet tokens more than doubled in April 2025.

It increased by 166%, rising from $181 million at the beginning of April to $481 million at press time. As reported by BeInCrypto, this growth follows a tripling of active subnets over the past year.
Disclaimer
In adherence to the Trust Project guidelines, BeInCrypto is committed to unbiased, transparent reporting. This news article aims to provide accurate, timely information. However, readers are advised to verify facts independently and consult with a professional before making any decisions based on this content. Please note that our Terms and Conditions, Privacy Policy, and Disclaimers have been updated.

Aayush Jindal, a luminary in the world of financial markets, whose expertise spans over 15 illustrious years in the realms of Forex and cryptocurrency trading. Renowned for his unparalleled proficiency in providing technical analysis, Aayush is a trusted advisor and senior market expert to investors worldwide, guiding them through the intricate landscapes of modern finance with his keen insights and astute chart analysis.
From a young age, Aayush exhibited a natural aptitude for deciphering complex systems and unraveling patterns. Fueled by an insatiable curiosity for understanding market dynamics, he embarked on a journey that would lead him to become one of the foremost authorities in the fields of Forex and crypto trading. With a meticulous eye for detail and an unwavering commitment to excellence, Aayush honed his craft over the years, mastering the art of technical analysis and chart interpretation.
As a software engineer, Aayush harnesses the power of technology to optimize trading strategies and develop innovative solutions for navigating the volatile waters of financial markets. His background in software engineering has equipped him with a unique skill set, enabling him to leverage cutting-edge tools and algorithms to gain a competitive edge in an ever-evolving landscape.
In addition to his roles in finance and technology, Aayush serves as the director of a prestigious IT company, where he spearheads initiatives aimed at driving digital innovation and transformation. Under his visionary leadership, the company has flourished, cementing its position as a leader in the tech industry and paving the way for groundbreaking advancements in software development and IT solutions.
Despite his demanding professional commitments, Aayush is a firm believer in the importance of work-life balance. An avid traveler and adventurer, he finds solace in exploring new destinations, immersing himself in different cultures, and forging lasting memories along the way. Whether he’s trekking through the Himalayas, diving in the azure waters of the Maldives, or experiencing the vibrant energy of bustling metropolises, Aayush embraces every opportunity to broaden his horizons and create unforgettable experiences.
Aayush’s journey to success is marked by a relentless pursuit of excellence and a steadfast commitment to continuous learning and growth. His academic achievements are a testament to his dedication and passion for excellence, having completed his software engineering with honors and excelling in every department.
At his core, Aayush is driven by a profound passion for analyzing markets and uncovering profitable opportunities amidst volatility. Whether he’s poring over price charts, identifying key support and resistance levels, or providing insightful analysis to his clients and followers, Aayush’s unwavering dedication to his craft sets him apart as a true industry leader and a beacon of inspiration to aspiring traders around the globe.
In a world where uncertainty reigns supreme, Aayush Jindal stands as a guiding light, illuminating the path to financial success with his unparalleled expertise, unwavering integrity, and boundless enthusiasm for the markets.

Dollar Dips While Bitcoin Hits New Heights

Ethereum Price Clings to Support—Upside Break Could Trigger Rally

Expert Reveals Why BlackRock Hasn’t Pushed for an XRP ETF
Will Bittensor Surpass Bitcoin as a Store of Value? Expert Predicts

Solana, Bitcoin in Texas, and Initia

XRP Bulls Defend $2.00—Is a Fresh Price Surge Loading?

2.52 Million Altcoins Are Ruining Crypto’s Future

Animoca Brands Valuation Tanks 75% In Two Years, Here’s Why

Crypto exchange BingX hacked for $43 million

Are The Big Players Losing Interest?

Hong Kong’s Securities Association Tips Authorities On Crypto Self-Regulation

Coinbase cbBTC Set to go Live on Solana
2.52 Million Altcoins Are Ruining Crypto’s Future
Animoca Brands Valuation Tanks 75% In Two Years, Here’s Why
Crypto exchange BingX hacked for $43 million
Are The Big Players Losing Interest?
Hong Kong’s Securities Association Tips Authorities On Crypto Self-Regulation
Coinbase cbBTC Set to go Live on Solana
-
 Market18 hours ago
1 Year After Bitcoin Halving: What’s Different This Time?
-

 Market22 hours ago
MELANIA Crashes to All-Time Low Amid Insiders Continued Sales
-

 Market19 hours ago
VOXEL Climbs 200% After Suspected Bitget Bot Glitch
-

 Market23 hours ago
Charles Schwab Plans Spot Crypto Trading Rollout in 2026
-

 Market17 hours ago
Tokens Big Players Are Buying
-

 Altcoin21 hours ago
XRP Leads Crypto Shopping List For Latin America Ahead Of ETH, SOL—Report
-

 Market20 hours ago
How Token Launch Frenzy Is Delaying 2025 Altcoin Season
-
 Altcoin20 hours ago
Binance Traders Go Big On Dogecoin—Majority Holding Long Positions