
Market
Is Bitcoin (BTC) Attempting to Push to a New All-Time High Next?
Bitcoin (BTC) currently trades within an ascending channel. The rally in the past few days has pushed the leading coin’s price toward the upper line of this channel.
If the coin successfully crosses above this line, it will have breached a key resistance level of $72,690.
Bitcoin “Big Boys” Weigh In
Bitcoin’s recent rally above $70,000 is partly due to the uptick in the coin’s whale activity over the past few weeks.
On-chain data reveals a significant increase in the number of large daily transactions over the past 30 days. BTC transactions valued between $100,000 and $1 million have surged 9% during this period.
Even more notable, transactions valued above $10 million have skyrocketed by 165% in the last month.
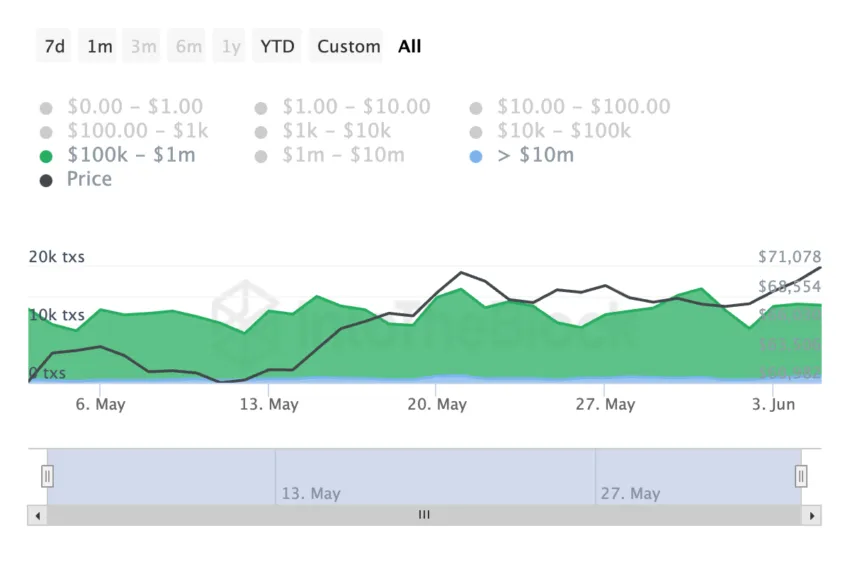
Upticks like these in BTC transactions suggest increased participation from institutional investors, such as hedge funds, investment firms, and corporations, during the period under review.
This attention from this cohort of BTC investors played out on June 4 when the US-based spot BTC ETFs recorded its 15 consecutive days of inflows, Bloomberg Intelligence senior ETF analyst Eric Balchunas noted in a post on X.
“The ability to bounce back w/ renewed interest after a couple nasty selloffs is rare for hot sauce type strategies. Shows staying power.” Balchunas added.
However, general market sentiment around the leading crypto continues to be negative. On-chain data showed that despite BTC’s recent price performance, its weighted sentiment has been negative since May 23.
Also Read: Bitcoin Halving Cycles and Investment Strategies: What To Know
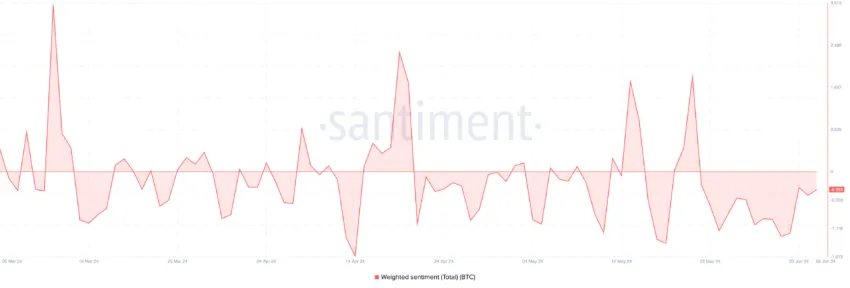
With a weighted sentiment of -0.3 when writing, there was more negative chatter than positive around BTC on social media.
BTC Price Prediction: Is Demand Losing Steam?
At press time, BTC’s Relative Strength Index (RSI) was in an uptrend. This indicator measures an asset price momentum.
It oscillates between 0 and 100 and is used to identify overbought or oversold market conditions. At 64, the indicator’s value showed steady demand for BTC.
However, BTC’s declining Chaikin Money Flow (CMF) forms a bearish divergence that hints at a potential price dip. This indicator measures money flow into and out of an asset’s market.
When it declines when an asset’s price rises, a bearish divergence is formed. This divergence suggests that despite the rising price, buying pressure is decreasing, indicating a potential price decline.
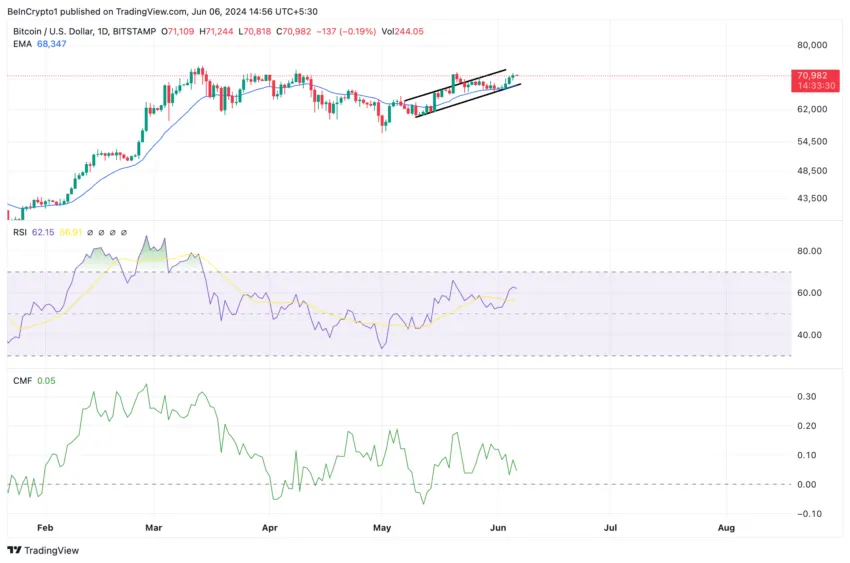
If this trend continues, and the CMF continues to record lower values, BTC may eventually retrace and slip back to $68,180.
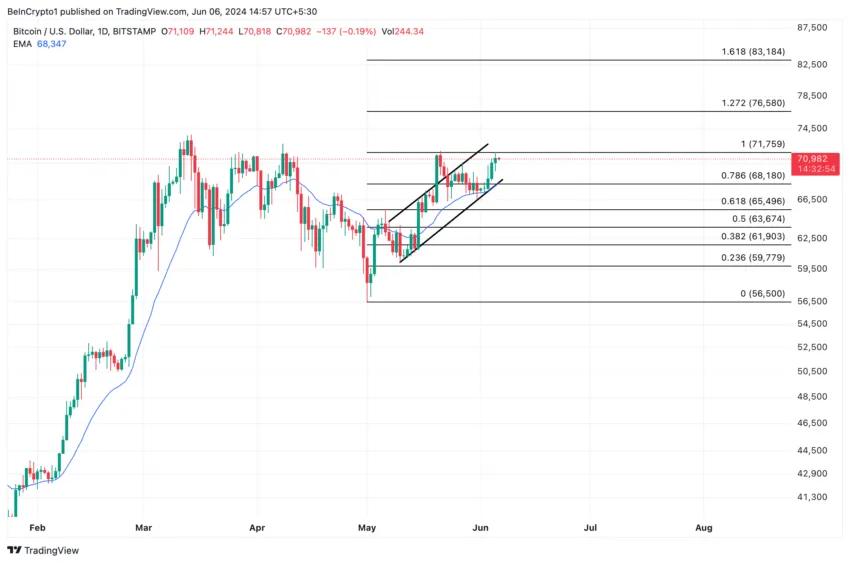
However, if buying pressure regains momentum and spikes, it will push the coin’s price above resistance at $72,690.
Disclaimer
In line with the Trust Project guidelines, this price analysis article is for informational purposes only and should not be considered financial or investment advice. BeInCrypto is committed to accurate, unbiased reporting, but market conditions are subject to change without notice. Always conduct your own research and consult with a professional before making any financial decisions. Please note that our Terms and Conditions, Privacy Policy, and Disclaimers have been updated.


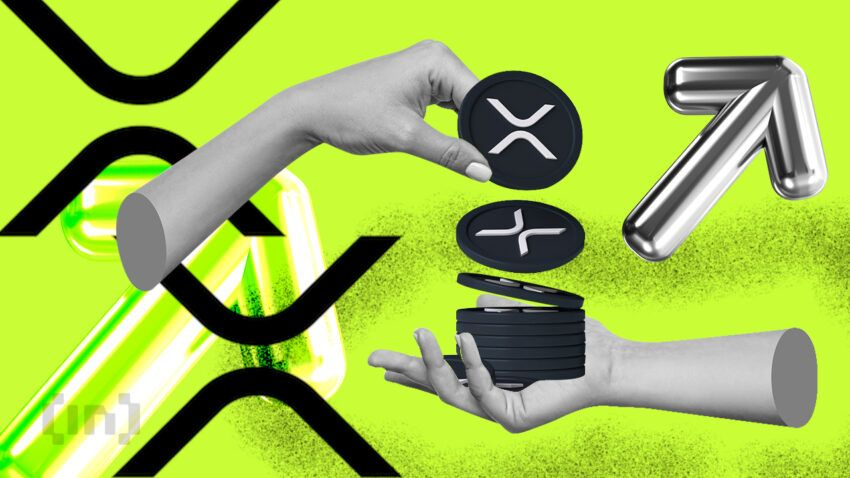
Over the past week, XRP’s price has remained range-bound amid the broader market’s recovery attempt.
However, with a growing bullish bias toward the altcoin, XRP may be on the brink of breaking free from this range and trending upward. This analysis explains why.
XRP Futures Traders Bet on Upside as Long Positions
The momentum shift towards the bulls has become evident, particularly within the futures market, where long bets on XRP are now surpassing short positions. This is reflected by the token’s XRP’s long/short ratio, which is currently at 1.07.

The long/short ratio measures the proportion of long positions (bets on price increases) to short positions (bets on price declines) in the market.
When its value is below one, it indicates that the number of short positions outweighs long positions in the market, suggesting bearish sentiment or a lack of confidence in the token’s future price performance.
As with XRP, when an asset’s long/short ratio is above one, it means there are more long positions than short ones. It indicates that traders are predominantly bullish on XRP and hints at a higher likelihood of an upward breach of its narrow range.
In addition, XRP’s relative strength index (RSI) has climbed steadily, indicating a gradual rise in demand for the token. The key momentum indicator, at 50.77, currently rests above the neutral line and is in an uptrend.
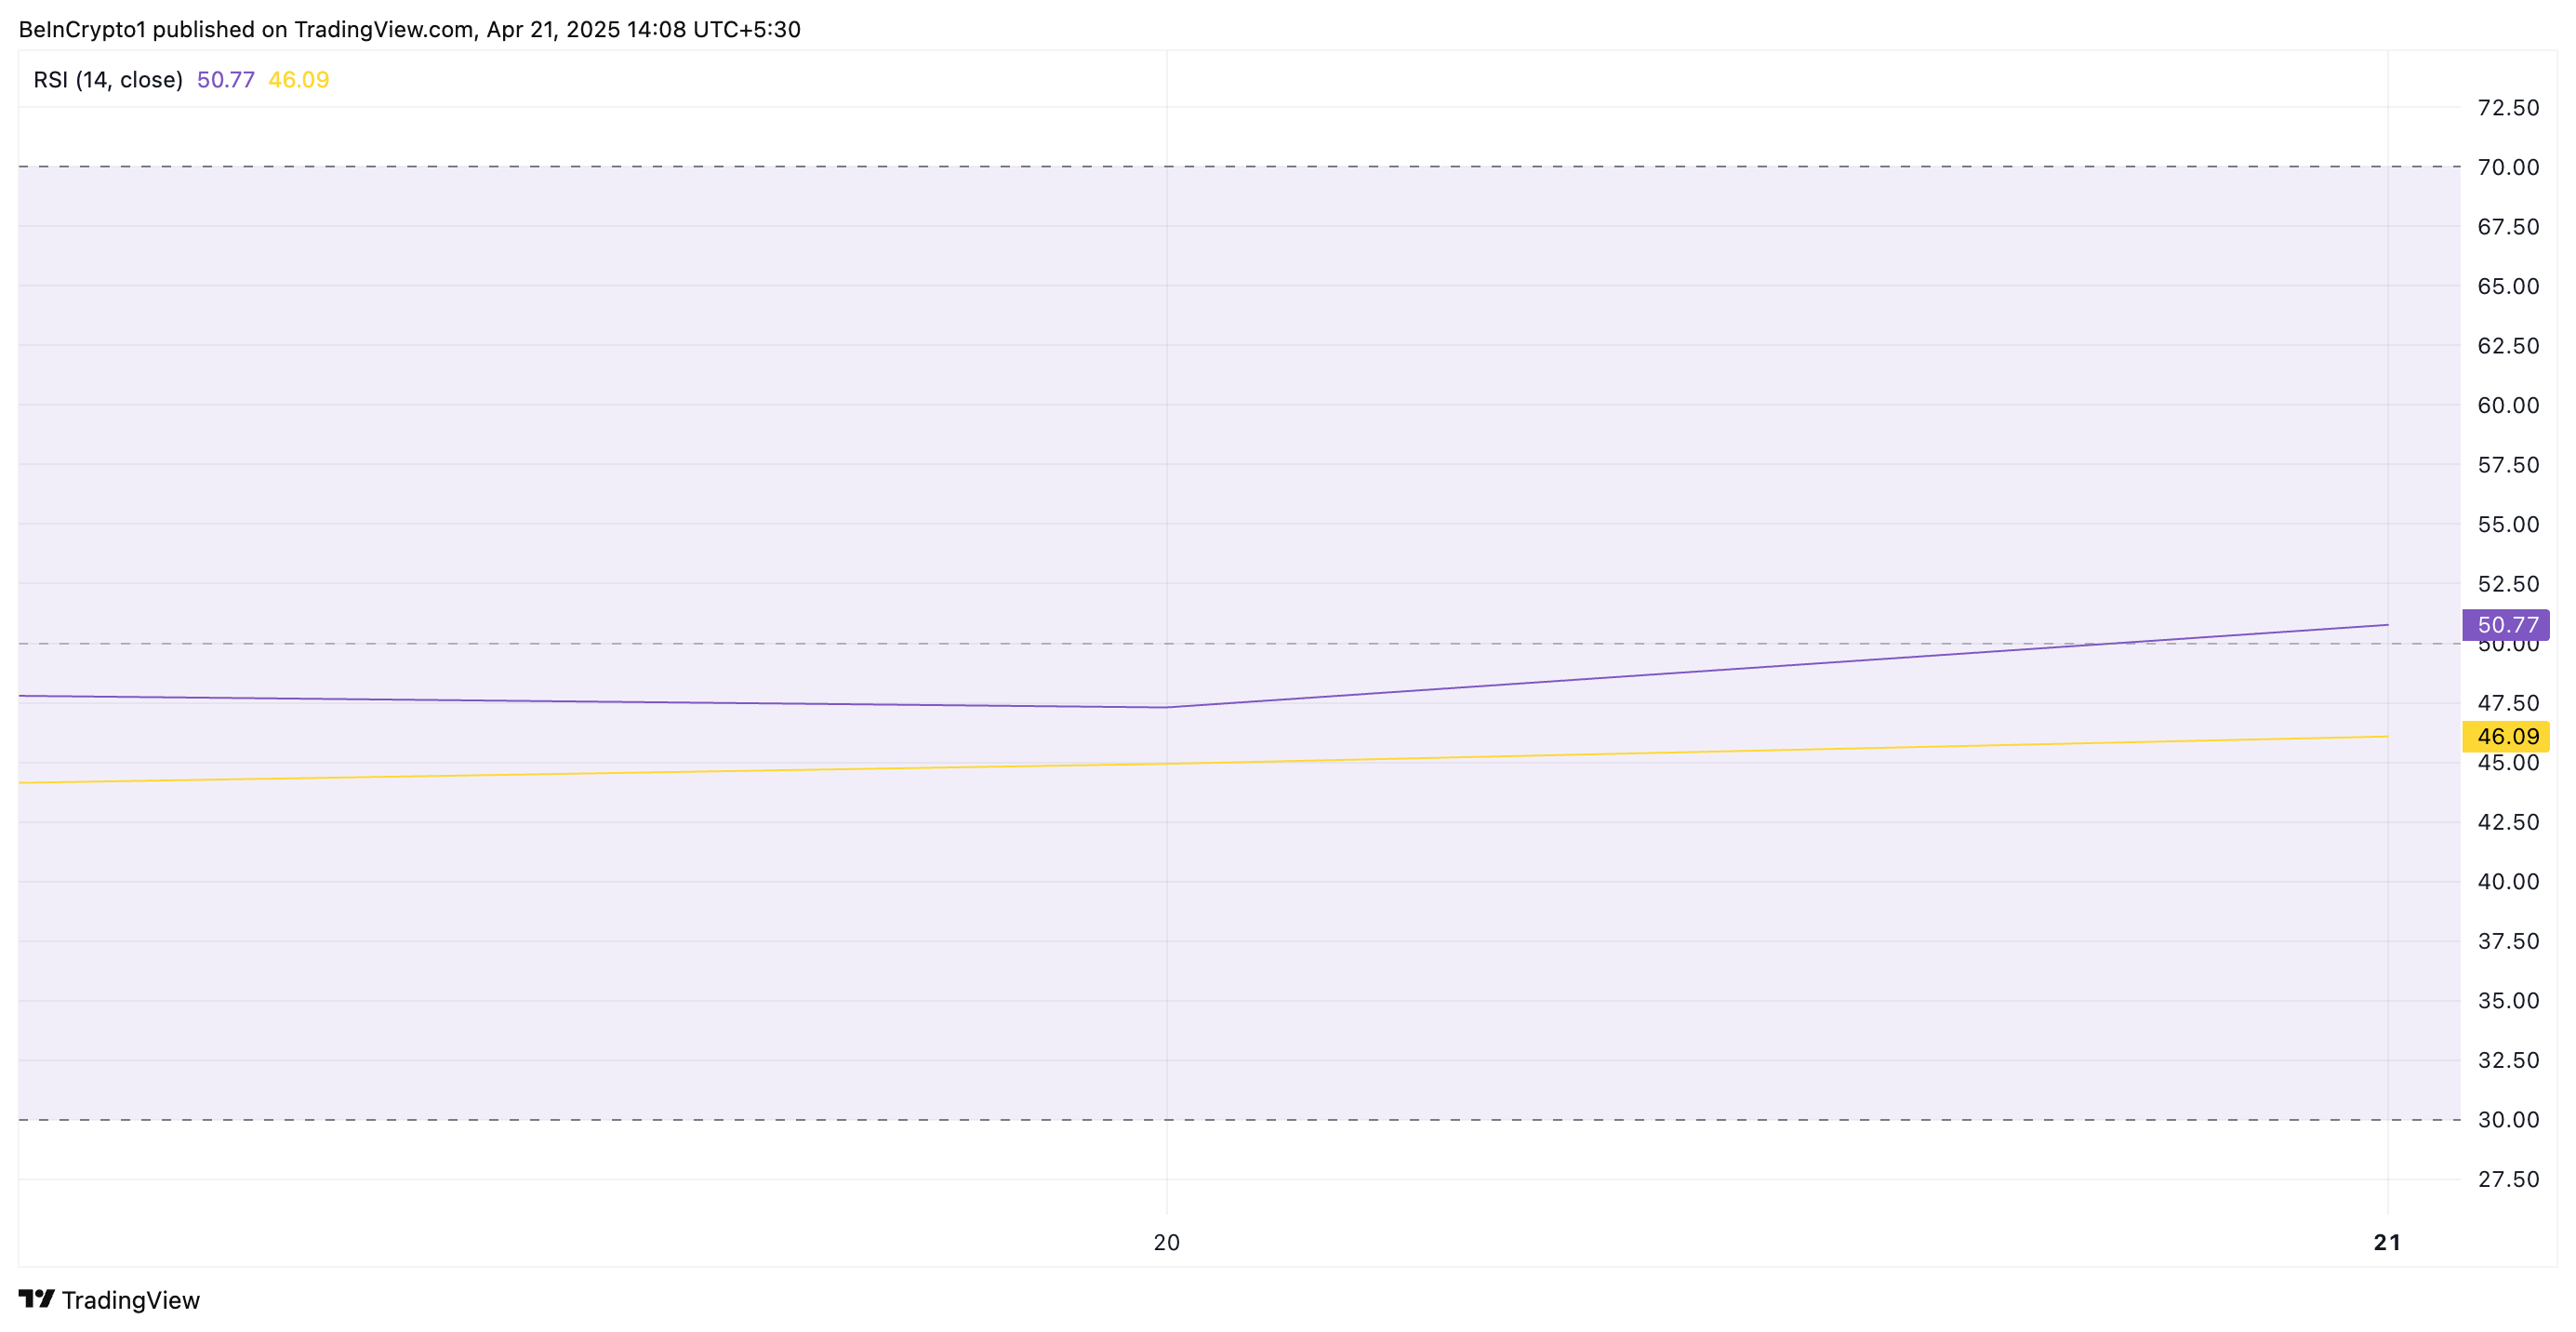
The RSI indicator measures an asset’s overbought and oversold market conditions. It ranges between 0 and 100. Values above 70 suggest that the asset is overbought and due for a price decline, while values under 30 indicate that the asset is oversold and may witness a rebound.
At 50.77, XRP’s RSI signals a shift toward bullish momentum. It indicates that buying pressure is starting to outweigh selling pressure, and the asset may be poised for further price increases.
XRP Eyes $2.18 Resistance as Bulls Look to Push for $2.29
XRP currently trades at $2.13, just 3% away from its next significant resistance level, $2.18. If buying pressure intensifies and the altcoin successfully flips this price point into a support floor, it could trigger further price growth. In this scenario, XRP could potentially climb to $2.29.
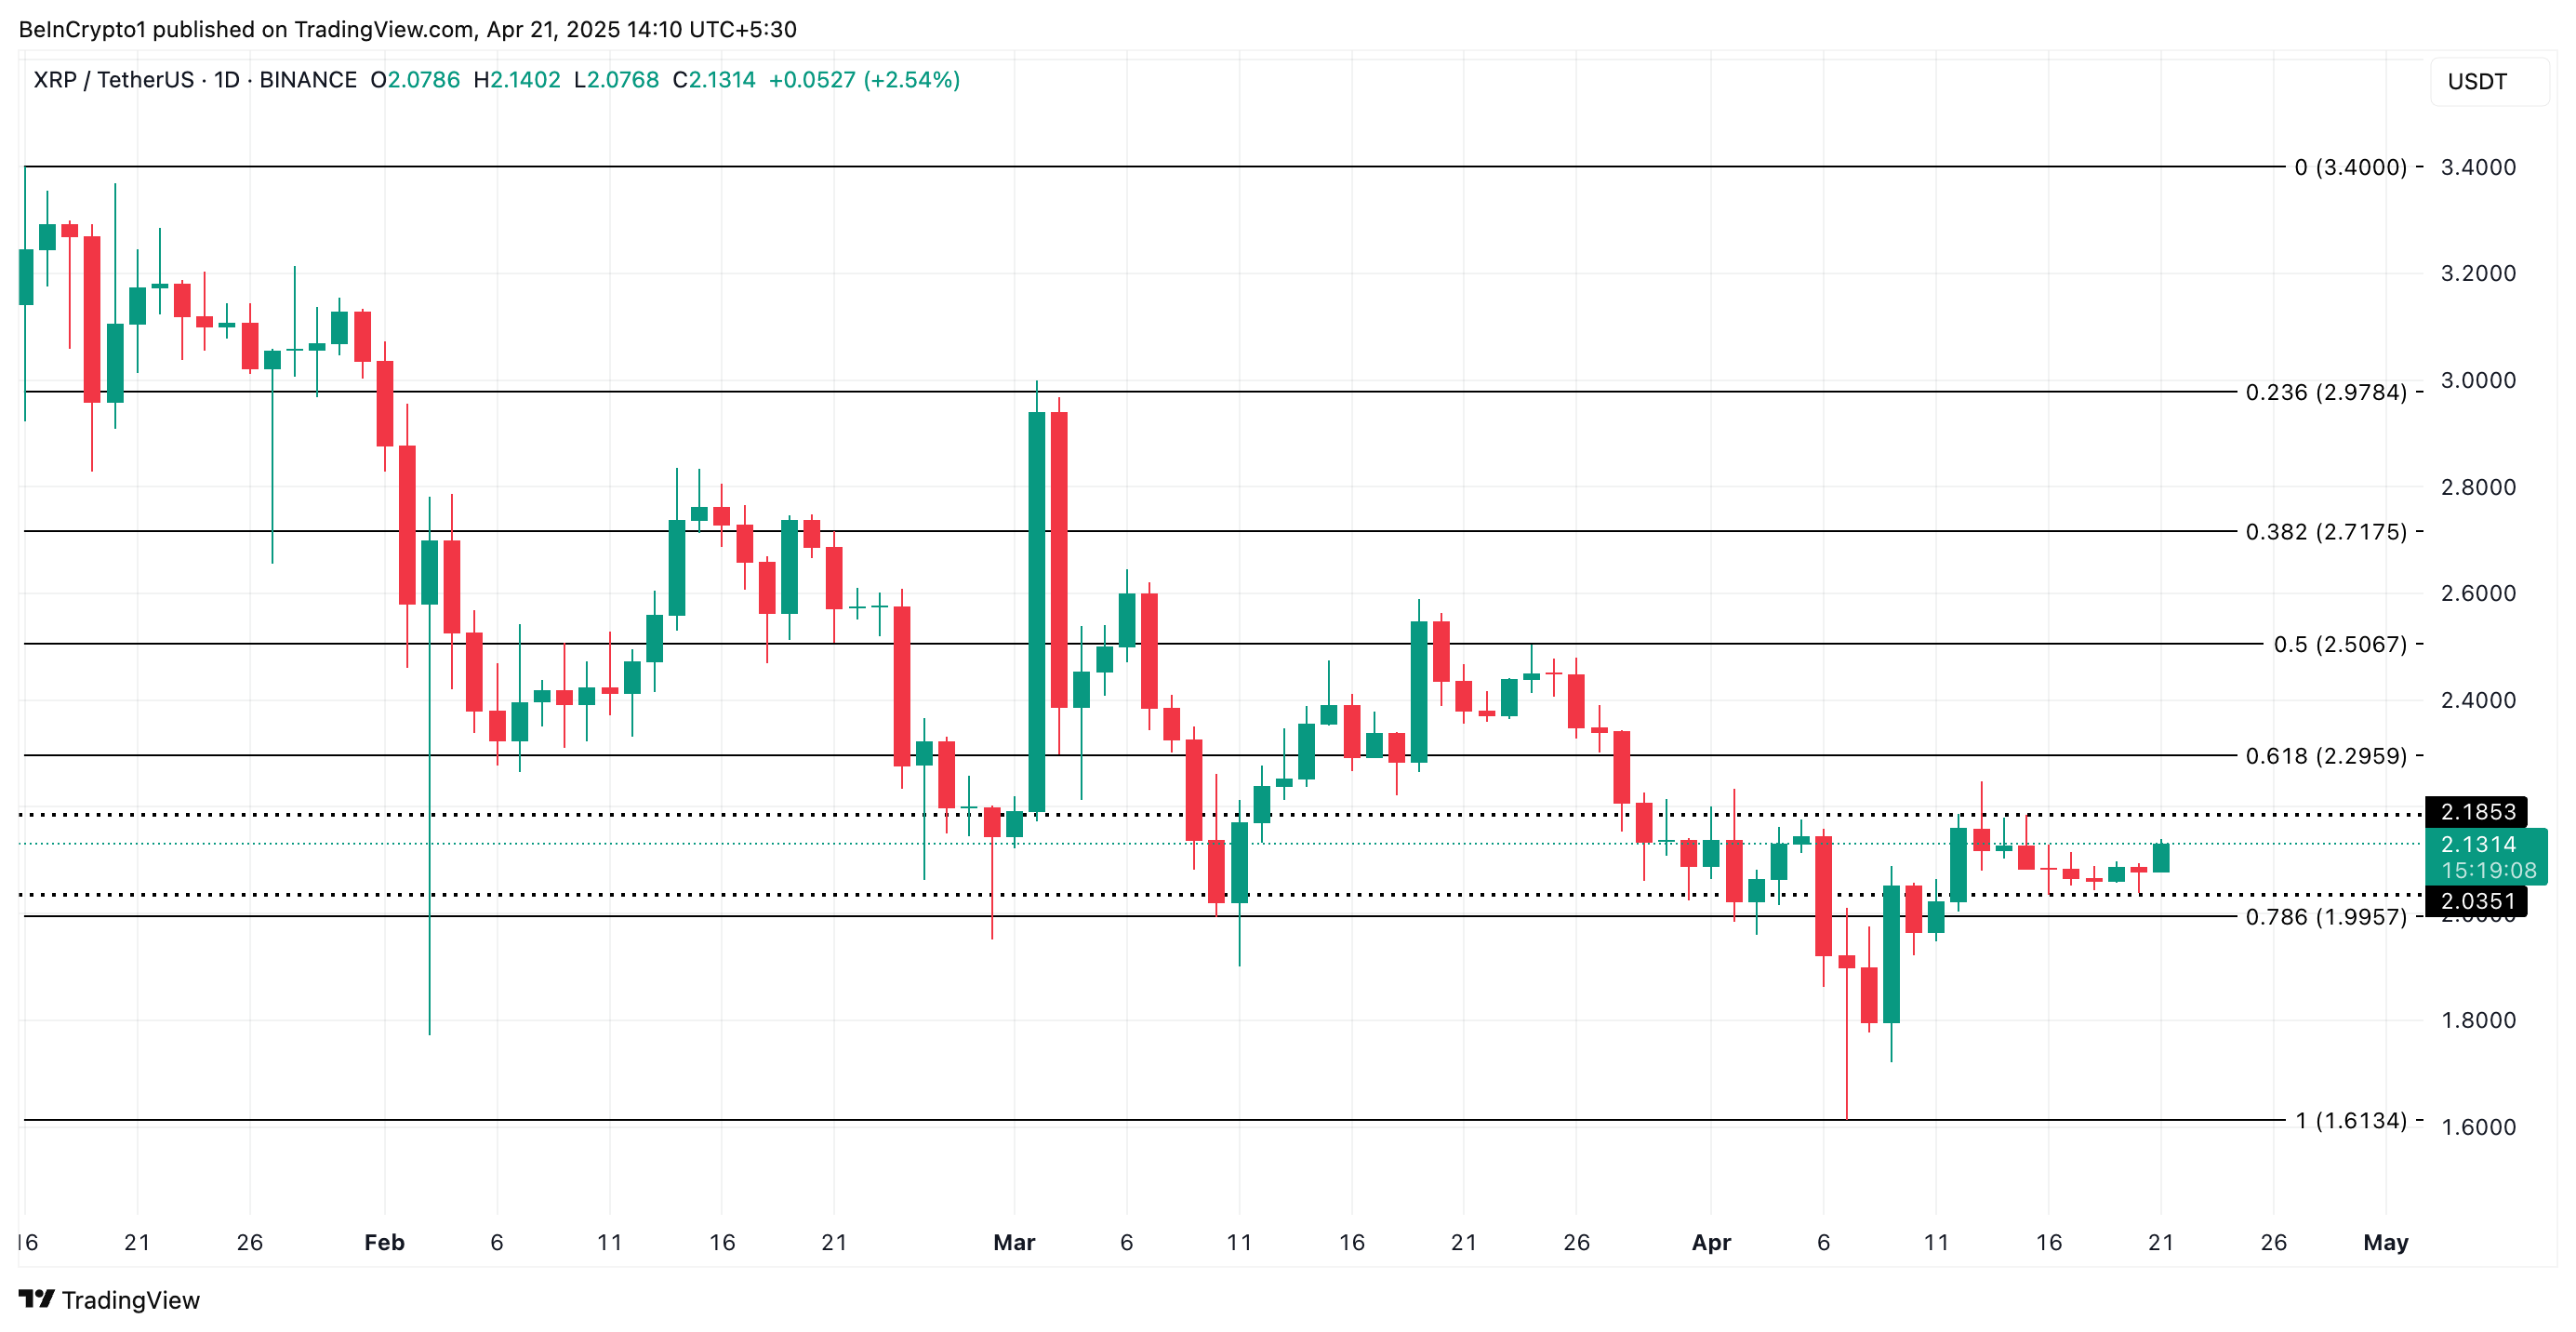
However, if demand weakens and the bears regain control, XRP may remain range-bound. It could even break below the $2.03 support and fall to $1.99.
Disclaimer
In line with the Trust Project guidelines, this price analysis article is for informational purposes only and should not be considered financial or investment advice. BeInCrypto is committed to accurate, unbiased reporting, but market conditions are subject to change without notice. Always conduct your own research and consult with a professional before making any financial decisions. Please note that our Terms and Conditions, Privacy Policy, and Disclaimers have been updated.


The crypto market is attempting a recovery, with Bitcoin (BTC) nearing the $90,000 milestone. Amidst improving sentiment, several startups are launching enticing airdrops, providing crypto enthusiasts with opportunities to engage with budding platforms without initial financial input.
This week, we discuss airdrop participation opportunities from three projects with financial backing from renowned investors.
Optimism
Layer-2 blockchain Optimism is one of the top three crypto airdrops this week. The Optimism crypto airdrop comes after the network raised $267.50 million from key investors such as Andreessen Horowitz, Coinbase Ventures, Paradigm, and IDEO CoLab Ventures, among others.
The airdrop concerns a SuperStacks Campaign, which opened on April 16 and will remain until June 30.
“With many chains building as one, a new network structure is emerging to solve fragmentation in Ethereum. This network is modular, interoperable, and composable by default. We call it the Superchain: and it changes everything,” Optimism explained.
Rewards are in the form of points, awarded for interacting with the projects. Airdrop farmers also get rewarded for providing liquidity to superchains, scalable blockchains combined into a single ecosystem to solve Ethereum fragmentation.
Actual tasks bring 10 EXP (experience points) per $1 of daily liquidity. In the past, Optimism held five airdrops, giving away over 265 million tokens.
“You may be eligible for the 6th airdrop without realizing it. In the system, we collect badges as you perform operations on Optimism. However, since it counts your previous operations when you log in, you may have opened many badges.,” one airdrop farmer explained.
This means even minimal effort could yield rewards. However, participating in the Optimism airdrop does not guarantee future rewards. Instead, it only provides an opportunity to earn points.
Aztec
Another top crypto airdrop to watch this week is Aztec, bringing forth a privacy-focused Layer-2 zero-knowledge (ZK) rollup on Ethereum.
Aztec is backed by $119.1 million in funding from investors such as Andreessen Horowitz (a16z), Paradigm, Consensys, and Coinbase Ventures.
The project has garnered significant attention, following talks of a native AZTEC token and a confirmed retroactive airdrop for early users.
On April 17, the network announced the Aztec Sequencer Form, front-running a public testnet. Interested participants were asked to fill out the form to gain early access to the testnet.
Historically, blockchain projects reward testnet participants with tokens. Based on this, Aztec’s funding and investor backing increase the probability of an airdrop.
Huma Finance
This week, the watchlist also includes Huma Finance, the first PayFi (Payment Finance) network built on Solana. The project focuses on transforming global payment settlements using blockchain technology.
Huma Finance launched the second version of point farming, which is available only on the Solana network. Participants can deposit USDC tokens and earn Feathers (points). Notably, no KYC is needed in this version, and more pools are available.
Recently, the project announced social and deposit quests on Galxe, allowing users to complete these quests and try to win a share of $2,000. Notably, participants should have at least lvl 2 of Web3 Passport.
“Huma 2.0 is The Next Wave! Now anyone can earn real yield and stack rewards, exclusively on Solana. New quest is LIVE on Galxe Quest. Join the PayFi movement for a chance to grab a share of $2000 USDC,” the network shared.
The project also launched a point farming program, in which participants can deposit USDC tokens into one of the pools. For this activity, users must pass KYC.
Meanwhile, Huma Finance boasts up to $46.3 million in funds raised from backers such as HashKey Capital, Circle, ParaFi Capital, and Distributed Global.
Disclaimer
In adherence to the Trust Project guidelines, BeInCrypto is committed to unbiased, transparent reporting. This news article aims to provide accurate, timely information. However, readers are advised to verify facts independently and consult with a professional before making any decisions based on this content. Please note that our Terms and Conditions, Privacy Policy, and Disclaimers have been updated.
According to data from StakingRewards, Solana (SOL) has overtaken Ethereum (ETH) in staking market capitalization, reaching $53.15 billion compared to Ethereum’s $53.72 billion.
This milestone has sparked heated discussions across the social media platform X, raising the question: Is this a turning point for Solana, or merely a short-lived surge?
Solana Outpaces Ethereum As High Staking Yields Prove Appealing
Recent data reveals that 64.86% of Solana‘s total supply is currently staked, delivering an impressive annual percentage yield (APY) of 8.31%. In contrast, Ethereum has only 28.18% of its supply staked, with an APY of 2.98%.
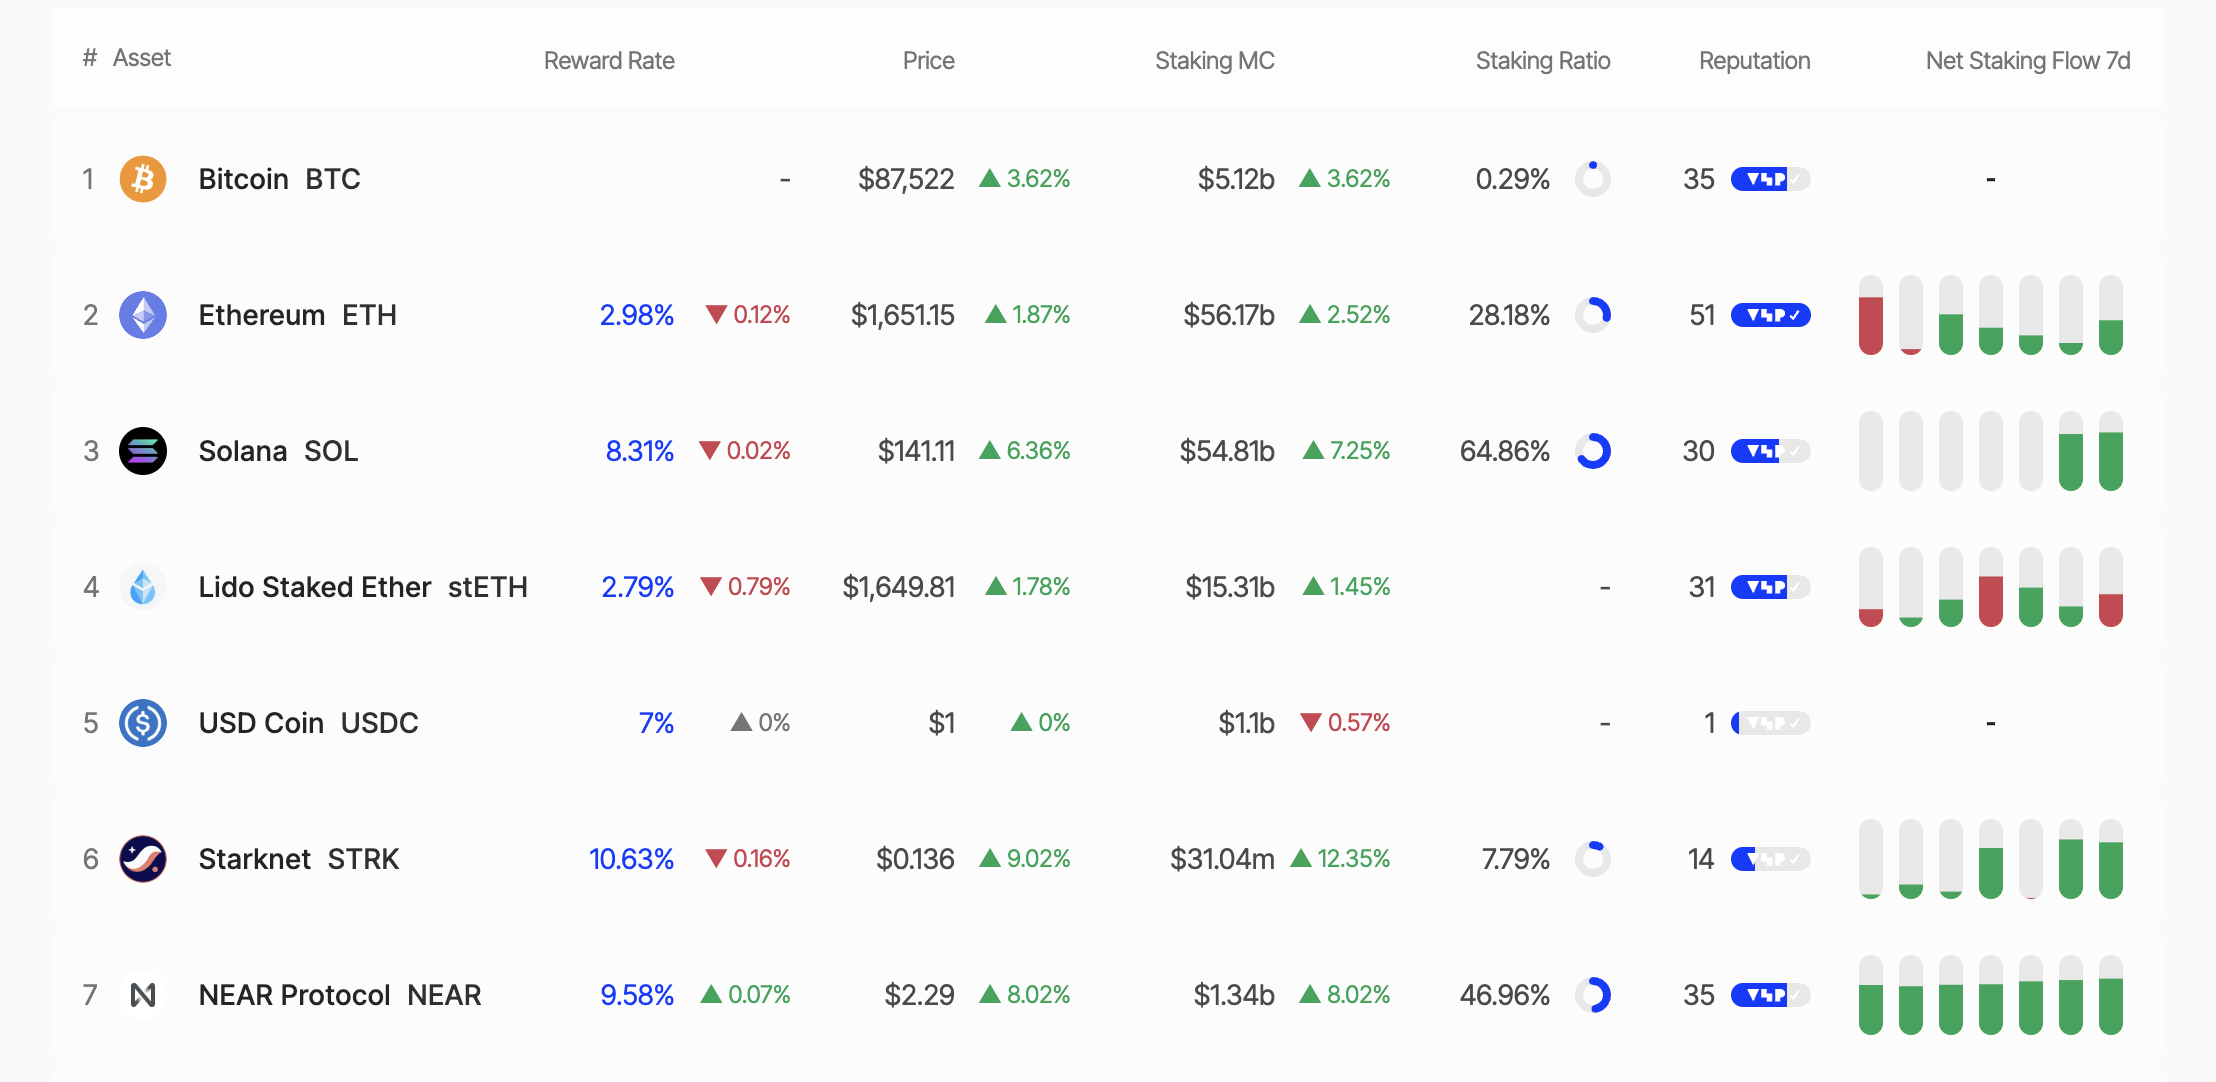
This disparity highlights Solana’s growing appeal for investors seeking passive income through staking. Staking market capitalization is calculated by multiplying the total number of staked tokens by their current price. With SOL priced at $138.91 as of this writing, Solana has officially surpassed Ethereum in this metric.
However, Solana’s high staking ratio has sparked some controversy. Critics, such as Dankrad Feist on X, argue that Solana’s lack of a slashing mechanism (or penalties for validator violations) undermines the economic security of its staking model. With its slashing mechanism, Ethereum offers greater security, despite its lower staking ratio.
“It’s very ironic to call it ‘staking’ when there is no slashing. What’s at stake? Solana has close to zero economic security at the moment,” Dankrad Feist shared.
Increased Whale Activity Signals Caution
Meanwhile, recent moves by “whales” (large investors) have further fueled interest in Solana. On April 20, 2025, a whale unstaked 37,803 SOL (worth $5.26 million). Similarly, Galaxy Digital withdrew 606,000 SOL from exchanges over four days (April 15–19, 2025), concluding with 462,000 SOL.
Additionally, on April 17, 2025, a newly created wallet withdrew approximately $5.15 million worth of SOL from the Binance exchange. In the same tone, Binance whales withdrew over 370,000 SOL tokens valued at $52.78 million.
While some whales withdrew their SOL holdings, other large holders accumulated. Janover, a US-listed company, increased its Solana holdings to 163,651.7 SOL (worth $21.2 million) and partnered with Kraken exchange for staking on April 16, 2025.
These actions signal diverging plays from institutional investors and whales, as the Solana price fluctuates around key levels.
SOL Price Analysis: Opportunities and Challenges
As of this writing, SOL was trading at $140.49, up 3.53% in the past 24 hours. Analysts highlight $129 as crucial support for the Solana price, with $144 presenting the key roadblock to overcome before Solana’s upside potential can be realized. Breaking above the aforementioned roadblock could propel SOL toward new highs.
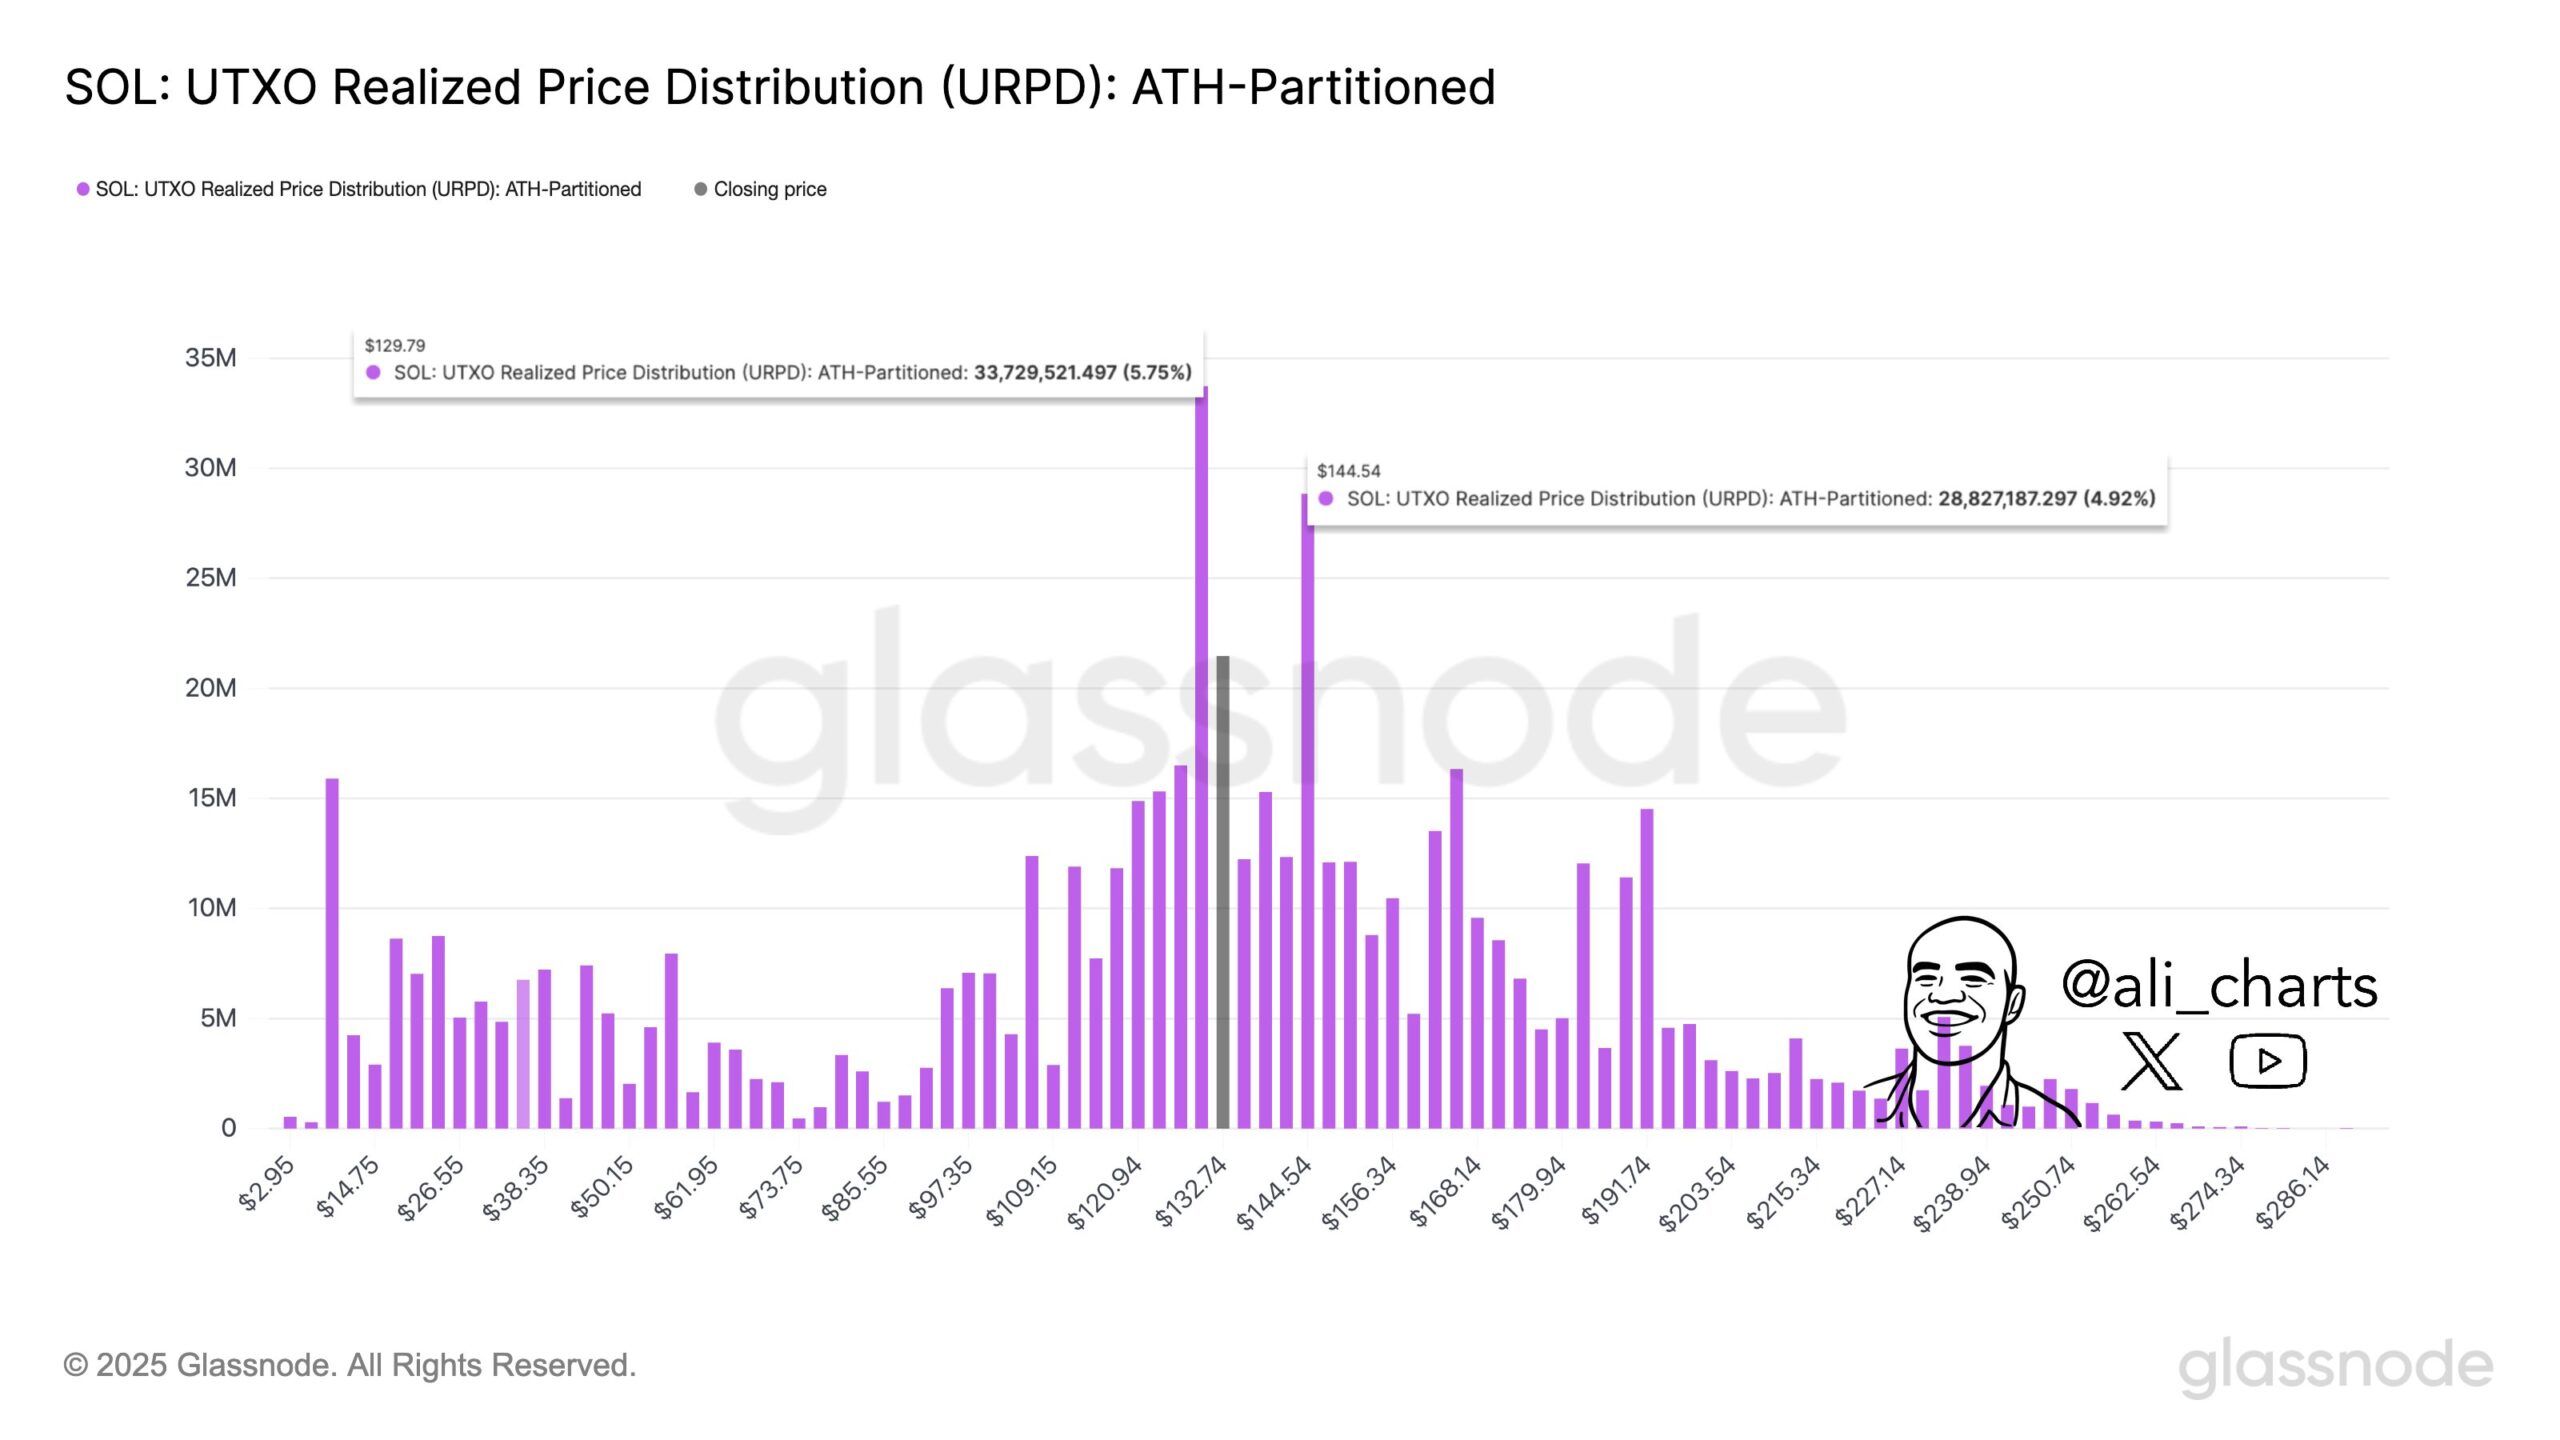
Conversely, dropping below the $129 support level could trigger increased selling pressure. Nevertheless, SOL has shown a remarkable recovery, with a 14.34% increase over the past week.
Another factor to consider is the ongoing development of the Solana ecosystem. Key innovations include the QUIC data transfer protocol, the combination of Proof-of-History (PoH) and Proof-of-Stake (PoS), and the diversification of validator clients.
With these, Solana continues to enhance its performance and decentralization. Additionally, the launch of the Solang compiler, compatible with Ethereum’s Solidity, has attracted developers from the Ethereum ecosystem.
BeInCrypto also reported on Solana’s upcoming community conference, otherwise termed Solana Breakpoint. Key announcements from this event could provide further tailwinds for the SOL price.
Nevertheless, despite surpassing Ethereum in staking market capitalization, Solana faces significant challenges. Ethereum benefits from a more mature DeFi ecosystem, greater institutional trust, and enhanced security through its slashing mechanism.
To some, Ethereum’s lower staking ratio (28%) may be a deliberate strategy to reduce network pressure and ensure liquidity for DeFi applications.
In contrast, Solana’s high staking ratio (65%) could limit liquidity within its DeFi ecosystem. This raises the question of whether Solana can strike a balance between staking and the growth of its decentralized applications.
As Solana continues challenging Ethereum’s dominance, the crypto community remains divided. Is Solana’s rise a sustainable breakthrough, or just another wave of hype?
Disclaimer
In adherence to the Trust Project guidelines, BeInCrypto is committed to unbiased, transparent reporting. This news article aims to provide accurate, timely information. However, readers are advised to verify facts independently and consult with a professional before making any decisions based on this content. Please note that our Terms and Conditions, Privacy Policy, and Disclaimers have been updated.

XRP Futures Traders Increase Bets on Upside

Optimism, Aztec, and Huma Finance

Solana Staking Cap Surpasses Ethereum, But Is This Sustainable?

Dollar Dips While Bitcoin Hits New Heights

Ethereum Price Clings to Support—Upside Break Could Trigger Rally

Expert Reveals Why BlackRock Hasn’t Pushed for an XRP ETF

2.52 Million Altcoins Are Ruining Crypto’s Future

Animoca Brands Valuation Tanks 75% In Two Years, Here’s Why

Crypto exchange BingX hacked for $43 million

Are The Big Players Losing Interest?

Hong Kong’s Securities Association Tips Authorities On Crypto Self-Regulation

Coinbase cbBTC Set to go Live on Solana
2.52 Million Altcoins Are Ruining Crypto’s Future
Animoca Brands Valuation Tanks 75% In Two Years, Here’s Why
Crypto exchange BingX hacked for $43 million
Are The Big Players Losing Interest?
Hong Kong’s Securities Association Tips Authorities On Crypto Self-Regulation
Coinbase cbBTC Set to go Live on Solana
-
 Market21 hours ago
1 Year After Bitcoin Halving: What’s Different This Time?
-

 Market22 hours ago
VOXEL Climbs 200% After Suspected Bitget Bot Glitch
-

 Market20 hours ago
Tokens Big Players Are Buying
-

 Market19 hours ago
Dogecoin Defies Bullish Bets During Dogeday Celebration
-
 Altcoin23 hours ago
Binance Traders Go Big On Dogecoin—Majority Holding Long Positions
-

 Market17 hours ago
Will XRP Break Support and Drop Below $2?
-

 Market23 hours ago
How Token Launch Frenzy Is Delaying 2025 Altcoin Season
-
 Altcoin19 hours ago
Expert Predicts Pi Network To Reach $5 As Whales Move 41M Pi Coins Off Exchanges