
Market
Is $1 the Next Stop for ENA?

Ethena (ENA) is gaining notable attention, stirring discussions among traders and analysts with its potential price trajectory aimed at flipping the $1 mark.
The cryptocurrency maintains relevance without the hype surrounding AI or meme tokens, which are currently the key trending sectors at the moment. Based on recent sentiment and market trends, ENA shows signs of a bullish breakout.
Ethena Mentions on Social Platforms on the Rise
Over the past month, key influential accounts within the crypto community have steadily mentioned ENA, indicating rising interest. Analysis reveals that 32 significant X users discussed ENA in the last 30 days, with a reinvigorated focus from 12 of them in just the past week.
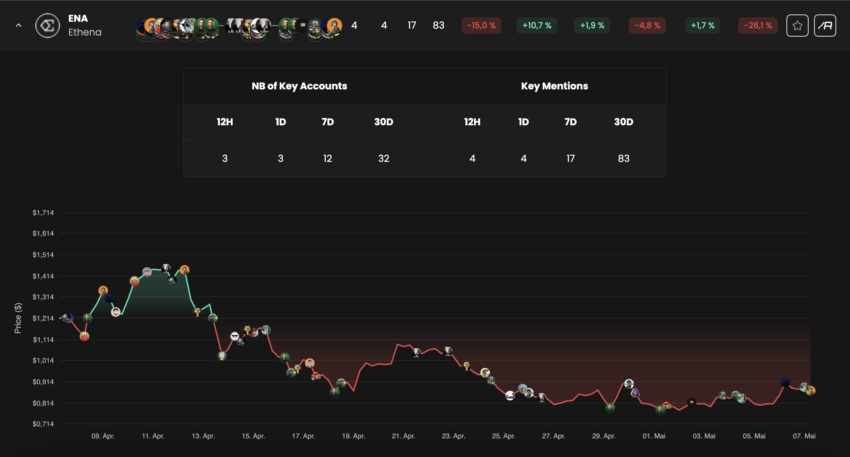
Remarkably, three unique key opinion leaders (KOLs) have again highlighted ENA in the last 12 hours, adding to the short-term bullish sentiment.
Despite this uptick in mentions and social buzz, long-term sentiment stability remains uncertain. Only 20% of the monthly mentions have occurred in the last week, suggesting that while the immediate outlook may be positive, sustained momentum could require further growth in engagement and discussion.
Ethena Bagholders Await Favorable Selling Conditions as Price Stalls
As Ethena (ENA) inches towards the significant $1 price point, recent market dynamics hint at a potential upward trajectory. Currently trading at approximately $0.90, the token has seen notable activity in its trading volume and investor sentiment.
Read More: What Is Ethena Protocol and its USDe Synthetic Dollar?
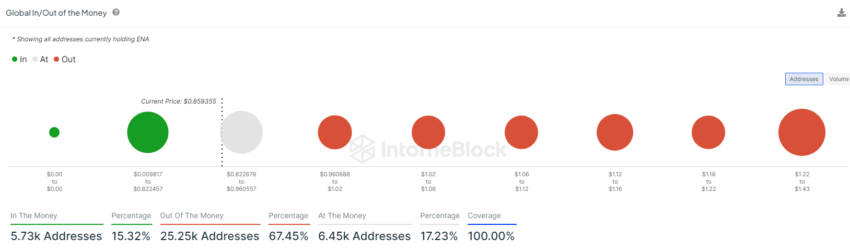
The most recent data indicates a strong holding pattern among investors, with a substantial 67.45% of ENA holders “Out of the Money,” meaning their holding price is higher than the current market price. This will likely cause a slow-down in selling at current levels and force the majority of holders to continue holding until their positions flip In the Money.”
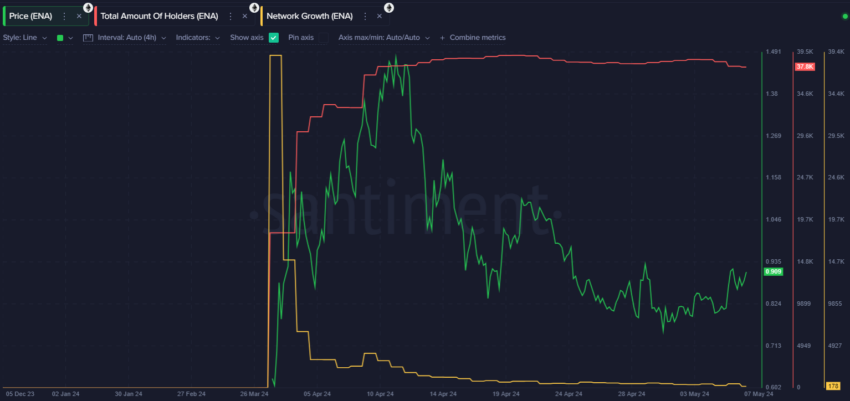
Moreover, ENA’s network metrics reveal a healthy and growing ecosystem despite a slowing market. Despite fluctuations, the total number of ENA holders has maintained relatively steady growth. currently sitting above 36,000 holders for the past month.
The network’s growth, illustrated by the number of new addresses being created daily, continues to decline as the price has followed a similar pattern. However, it is worth noting holders are still holding firm, as previously illustrated.
ENA Price Prediction: Push Above $1 Next
Technical analysis of the ENA price chart shows a consolidation phase with the price stabilizing above key Fibonacci support levels. The Relative Strength Index (RSI), currently at 55, points to a balanced market condition, neither overbought nor oversold.
This stability, combined with sustained holder growth, presents a case for potential price appreciation after an extended consolidation period. Currently, ENA sits in the middle of the 0.737 and 0.5 fib levels – representing a strong consolidation area for ENA.
A push toward $1 is likely, and should it flip this psychological resistance area, the price will likely test $1.12 next.

Given these factors, the $1 price level is not just a psychological barrier but a feasible short-term target. As the market conditions align with increased user engagement and solid technical support levels, ENA could see its value appreciate to or beyond this threshold soon.
Read More: How To Use Ethena Finance To Stake USDe
Additionally, if market sentiment remains bearish, momentum could shift in favor of the bears, pushing the price back to the key fib support level at $0.735. Which would invalidate the bullish price target.
Disclaimer
In line with the Trust Project guidelines, this price analysis article is for informational purposes only and should not be considered financial or investment advice. BeInCrypto is committed to accurate, unbiased reporting, but market conditions are subject to change without notice. Always conduct your own research and consult with a professional before making any financial decisions. Please note that our Terms and Conditions, Privacy Policy, and Disclaimers have been updated.


On Friday, Changpeng Zhao (CZ) sparked fresh momentum toward simplifying the BNB staking ecosystem.
The Binance founder proposed the unification of multiple liquid staking tokens into a single, streamlined structure.
CZ’s Bold Plan to Unify BNB’s Staking Maze
Changpeng Zhao’s comments come amid rising concerns over the fragmentation of BNB staking products. Their impact on user adoption and capital efficiency within the decentralized finance (DeFi) space has also been questioned.
“There are so many different versions of BNB rewards. asBNB, slisBNB, clisBNB… combine them?” CZ wrote on X (Twitter).
These tokens, each tied to a different platform or crypto staking strategy, represent staked BNB assets while allowing users to remain liquid.
However, the proliferation of variant tokens like asBNB, slisBNB, and clisBNB has created operational barriers for users, particularly newcomers. Each derivative often carries reward structures, lock-up conditions, and platform-specific limitations, making it harder to maneuver the ecosystem.
This highlights the growing problem in BNB’s liquid staking ecosystem. However, as more derivatives emerge, confusion has mounted. The call for consolidation follows recent activity in the BNB DeFi ecosystem. This week, Aster DEX (decentralized exchange) announced “back-to-back rewards” for asBNB holders.
While this added to the mix of incentives, it also highlighted the complexity of managing multiple tokens.
“INIT rewards are loading now and will be available for holders with previous rewards soon,” Aster posted.
The post demonstrates how derivative-specific reward systems may confuse users who are unfamiliar with each staking product’s nuances.
CZ shared a follow-up post, urging users to support projects in the ecosystem. The call to action reflects his commitment to nurturing BNB’s DeFi growth, albeit with a more coherent strategy.
As Binance aims to maintain its leadership in Web3 usability, Zhao’s suggestion to unify these staking derivatives could be a pivotal move to streamline BNB’s functionality across DeFi platforms.
BNB remains one of the most utilized assets in the DeFi ecosystem. The network underpins a wide array of liquidity pools, staking protocols, and yield-generating strategies.
CZ’s unification proposal aligns with a broader trend across DeFi to improve composability and standardization. Industry leaders increasingly recognize that overly complex or siloed token designs can deter participation and limit interoperability.
A standardized BNB staking token could help reduce fragmentation and boost liquidity. It could also encourage deeper integration across platforms using BNB Chain infrastructure.
While Binance has not yet issued an official roadmap for staking token consolidation, CZ’s comments may hint at a coming initiative to build a unified liquid staking standard.
Such a move could further solidify BNB’s position as a core DeFi asset, simplify staking for everyday users, and drive broader adoption of Binance’s on-chain ecosystem.
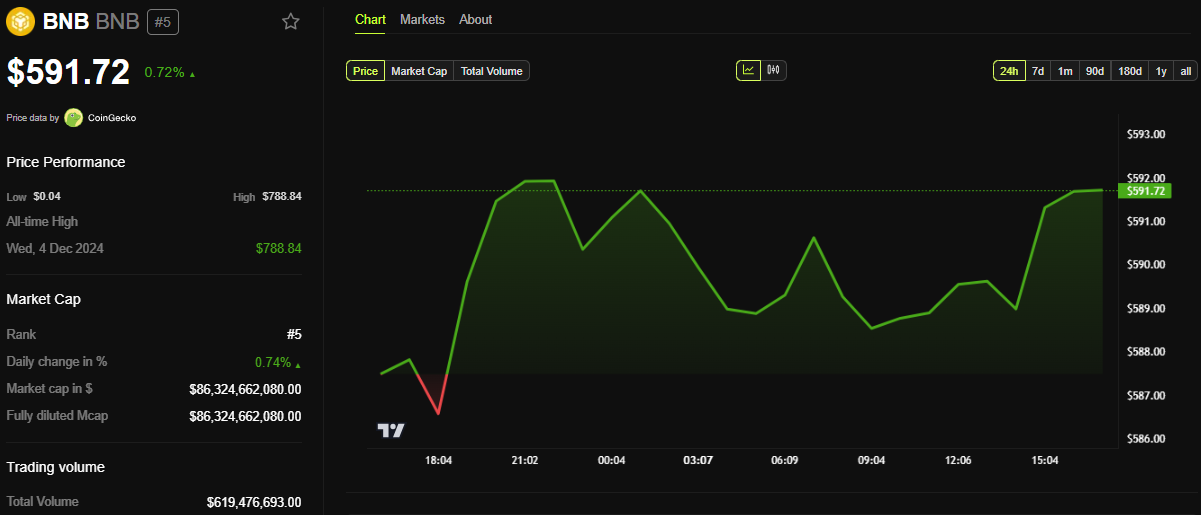
BeInCrypto data shows BNB was trading for $591.72 as of this writing, up by a modest 0.72% in the last 24 hours.
Disclaimer
In adherence to the Trust Project guidelines, BeInCrypto is committed to unbiased, transparent reporting. This news article aims to provide accurate, timely information. However, readers are advised to verify facts independently and consult with a professional before making any decisions based on this content. Please note that our Terms and Conditions, Privacy Policy, and Disclaimers have been updated.
Total value locked (TVL) is a widely used metric to track the popularity, adoption, and overall health of decentralized finance (DeFi) projects. However, is it the most accurate reflection of a chain’s true value? David Silverman, SVP of Strategic Product Initiatives at Polygon Labs, believes TVL is useful for grabbing headlines but doesn’t provide the full picture.
In an exclusive interview with BeInCrypto, Silverman explained why TVL has its limitations. He also revealed how the Chain-Aligned TVL (CAT) could provide a more meaningful measure for the crypto ecosystem.
Why TVL Falls Short as a Key DeFi Metric
Silverman acknowledged that TVL provides a general overview of the assets held within a protocol or chain. Yet, he argued that its importance and accuracy remain debatable.
“TVL mainly serves as a tool for crafting headlines and providing a general overview of the value held on a DeFi platform or a chain, and most people don’t really know what exactly this metric entails in particular. Saying that Ethereum has a TVL of $44.38 billion doesn’t really mean much until you dig deeper into the specifics,” Silverman told BeInCrypto.
According to DefiLlama data, in April 2025, Ethereum (ETH) ranks the highest among all chains in terms of TVL, dominating more than half of the market. Meanwhile, Polygon’s (POL) TVL stands at $760.9 million, making it the 13th largest chain.

Although there have been advancements in tracking the TVL over time, Silverman believes several issues persist. Thus, he advocated for what he calls a Chain-Aligned TVL.
According to Silverman, the name itself clearly differentiates it from traditional TVL. This metric focuses on the active use of assets rather than their mere presence on the chain.
“Knowing how much USDC or USDT is on a chain can make for good headlines, but if those tokens are just collecting dust in a wallet and don’t contribute to anything, do they really add any value to the ecosystem?” he questioned.
To illustrate his point, he emphasized that holding $1 million worth of USDT in Morpho is arguably far more beneficial for the chain, its users, and the ecosystem. Why? Because on the platform, it earns a yield and helps grow the chain’s TVL by extending credit.
“This is the main idea of Chain-Aligned TVL, which is the total value of assets that directly support and strengthen their underlying chain, whether held natively or within aligned protocols,” Silverman disclosed to BeInCrypto.
Furthermore, he said, the goal is to associate CAT with projects that truly add value to their communities.
Maximizing DeFi Potential: How Chain-Aligned TVL Benefits Users
The Polygon executive also outlined the benefits Chain-Aligned TVL brings to users. He explained that CAT’s nuanced way of gauging a chain’s value can help users find better yield opportunities.
“Chains will naturally want to promote projects that benefit them and their ecosystems, so they are more likely to promote projects with higher chain-aligned TVLs, making it easier for users to locate high-yielding opportunities,” he noted.
Silverman stressed that focusing on CAT can drive the development of more effective and user-friendly applications. The underlying chain will prioritize well-integrated projects beneficial to its ecosystem.
“Benefits to users include things like easier/cheaper/faster transitions and better DeFi opportunities,” he claimed.
Additionally, CAT-driven projects may offer better interest rates and provide more engaging experiences in areas like games and non-fungible tokens (NFTs), as developers are incentivized to enhance ecosystem engagement.
The benefits aren’t limited to users only. Rather, it can also have positive implications for entire blockchains.
“CAT is a metric that all chains can leverage and benefit from to get a better understanding of where their development efforts should be focused,” Silverman revealed to BeInCrypto.
He pointed out that transaction fees alone are not always a sustainable business model for chains. According to Silverman, the focus on CAT helps bring long-term value to a chain and its ecosystem beyond just short-term transaction revenue.
Meanwhile, to showcase Chain-Aligned TVL in action, Silverman cited Agora’s AUSD deployment on Polygon as an example.
“While other stables may have large amounts of idle TVL, the issuer and the issuer alone benefits from this not the chain and not the users. With AUSD, a portion of the yield generated from reserves is emitted on the chain as incentives helping grow protocols, rewarding active users and growing the chain’s economy even when the assets remain idle,” he highlighted.
While Silverman presents a strong case for Chain-Aligned TVL, widespread adoption of this metric remains a challenge. TVL has dominated the DeFi space for years, becoming the standard by which projects are measured.
Shifting to a more nuanced metric like CAT will require industry-wide education and a change in how both developers and users evaluate blockchain value.
However, as the ecosystem matures and the need for more accurate assessments of chain health grows, metrics like CAT could gradually gain traction, offering a more sustainable and meaningful way to measure a chain’s true impact.
Disclaimer
In adherence to the Trust Project guidelines, BeInCrypto is committed to unbiased, transparent reporting. This news article aims to provide accurate, timely information. However, readers are advised to verify facts independently and consult with a professional before making any decisions based on this content. Please note that our Terms and Conditions, Privacy Policy, and Disclaimers have been updated.

Welcome to the US Morning Crypto News Briefing—your essential rundown of the most important developments in crypto for the day ahead.
Grab a coffee to see what experts say about Bitcoin’s (BTC) price, with $90,000 in sight. Global and regional liquidity is expanding, a trend that has historically proven bullish for risk assets like crypto.
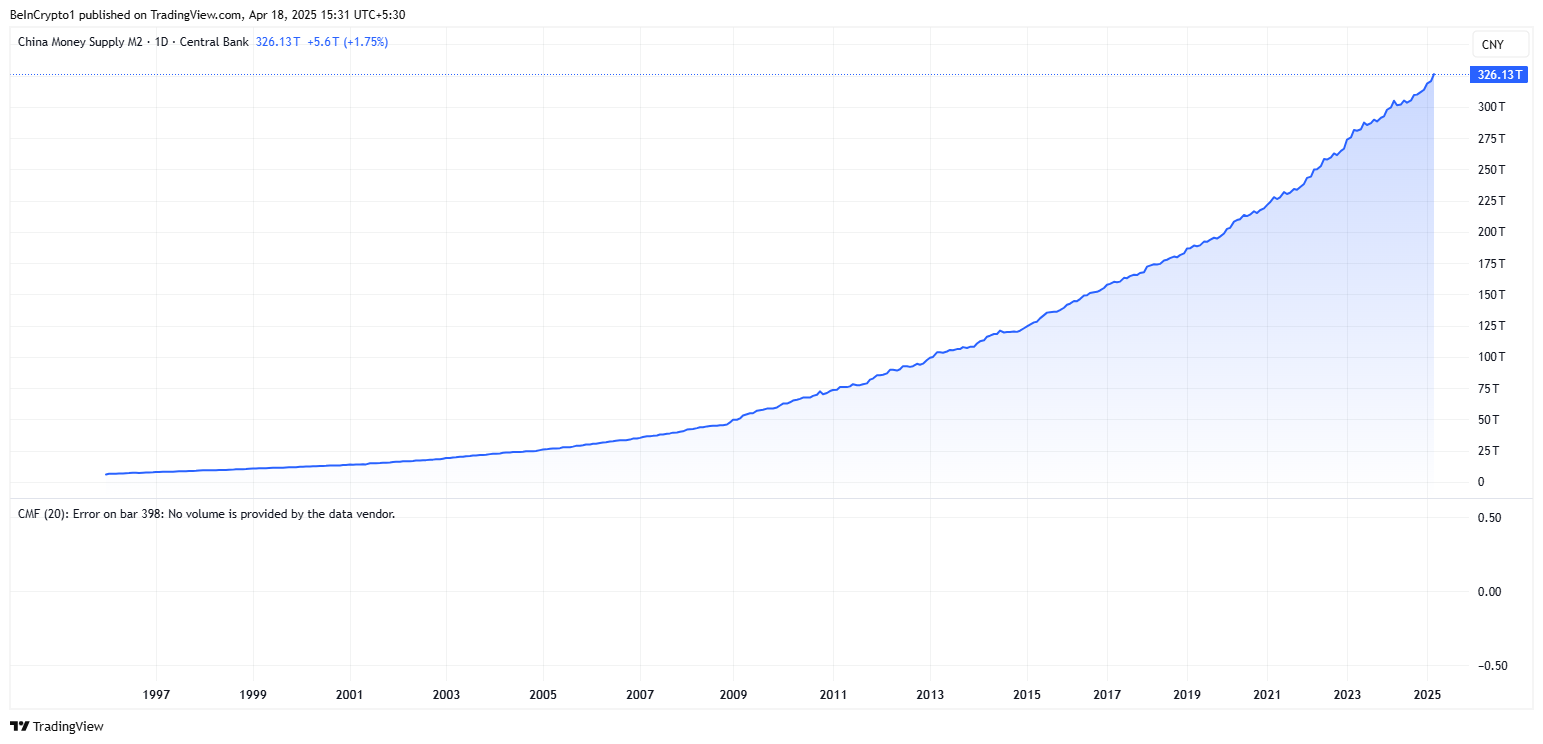
Will Bitcoin Follow As China’s M2 Money Supply Rises?
According to data on TradingView, China’s M2 money supply has reached a record $326.13 trillion, steadily surging to new record highs.
A rise in M2 signals greater liquidity in the financial system, suggesting more money is often seeking returns in riskier assets like Bitcoin and altcoins or others, such as equities and real estate.
“China’s M2 money supply just hit 326 trillion. The money printers are back on. Risk assets are about to go parabolic.,” analyst Kong Trading remarked.
Data on BGeometrics show that the global M2 is rising, a trend similar to that seen in China’s M2 money supply. Recent spikes have taken both metrics to their respective peaks.
Against this backdrop, analysts suggest a strong upside may be imminent for Bitcoin and altcoins. BeInCrypto contacted Brickken market analyst Enmanuel Cardozo D’Armas, who said Bitcoin could retest $90,000 soon.
“If China’s M2 keeps growing, it could give Bitcoin a push upwards, based on what we’ve seen before. Right now, Bitcoin’s at $85,000, and if M2 keeps increasing, we could potentially see a retest of $90,000,” Enmanuel Cardozo D’Armas told BeInCrypto.
This target aligns with yesterday’s US crypto news, where Blockhead Research Network (BRN) analyst Valentin Fournier highlighted the $90,000 target for Bitcoin price.
Meanwhile, Cardozo D’Armas articulated that China’s M2 money supply is projected to hit record levels by the end of 2025. In his opinion, more money floating around in China could mean more people willing to invest their cash into riskier assets like crypto, especially now that China’s stance is shifting positively.
According to the analyst, the $90,000 threshold is an important resistance level, necessary to conquer before a run-up to the $100,000 milestone. However, whether this is attainable by mid-year remains debatable amid macroeconomic jitters.
“But it’s not a sure bet, as there are a lot of things that could affect the markets at the moment. If the Fed cuts rates in May or June, as some expect, that could add more fuel. On the flip side, if trade tensions with China or crypto regulations tighten again, we might not see those targets hit,” the Brickken market analyst added.
Indeed, there remain concerns about Trump’s tariff chaos and China’s retaliatory stance. Amidst these uncertainties, investors may delay allocating capital to high-volatility assets until trade tensions stabilize.
The macro context also includes a hawkish Federal Reserve (Fed) stance from Jerome Powell, which ruled out any imminent rate cuts.
Reports also indicate that China is liquidating seized cryptocurrencies through private firms to support local government finances amid economic struggles.
Cognizant of these factors, Cardozo D’Armas explained that while China’s M2 can contribute to Bitcoin’s upward momentum, especially in bullish times, it is not the only thing crypto market participants should pay attention to.
Despite the bullish prediction, traders and investors should brace for macroeconomic headwinds, among other elements, which could temper any near-term gains.
Charts of the Day

This chart suggests Bitcoin may follow China’s M2 trend toward a price surge.
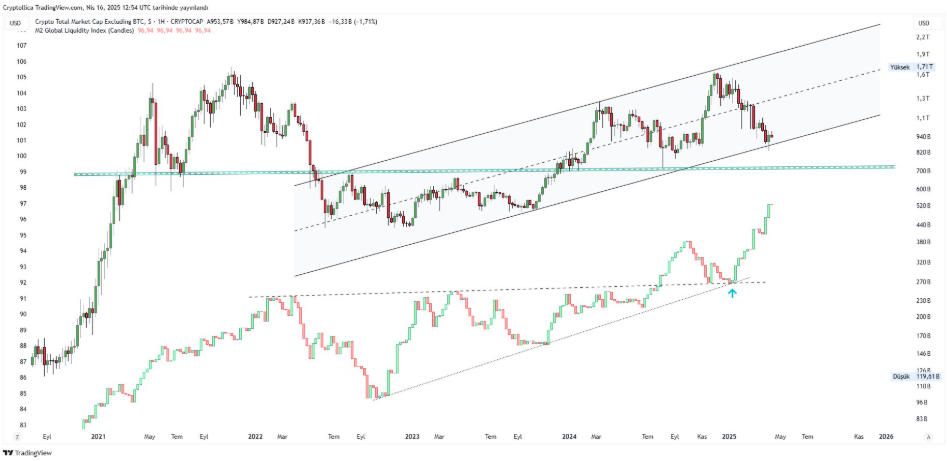
This chart shows a historical correlation where rising M2 often precedes altcoin price surges.
“Altcoins don’t run until liquidity breaks out. It’s time,” crypto analyst TechDev quipped.
Byte-Sized Alpha
Crypto Equities Pre-Market Overview
| Company | At the Close of April 17 | Pre-Market Overview |
| Strategy (MSTR) | $317.20 | $316.25 (-0.30%) |
| Coinbase Global (COIN) | $175.03 | $175.02 (-0.009%) |
| Galaxy Digital Holdings (GLXY.TO) | $15.36 | $15.12 (-1.51%) |
| MARA Holdings (MARA) | $12.66 | $12.68 (+0.16%) |
| Riot Platforms (RIOT) | $6.46 | $6.46 (+0.009%) |
| Core Scientific (CORZ) | $6.63 | $6.65 (+0.29%) |
Disclaimer
In adherence to the Trust Project guidelines, BeInCrypto is committed to unbiased, transparent reporting. This news article aims to provide accurate, timely information. However, readers are advised to verify facts independently and consult with a professional before making any decisions based on this content. Please note that our Terms and Conditions, Privacy Policy, and Disclaimers have been updated.

Ethereum ETFs Record $32M Weekly Outflow; ETH Price Crash To $1.1K Imminent?

CZ’s Plan to Streamline BNB Staking Could Boost DeFi

Babylon’s TVL Drops 32% After Massive Bitcoin Unstaking

Why Relying on TVL Could Mislead Your DeFi Strategy

China’s M2 Surge Could Send Bitcoin to $90,000
Ripple CEO Brad Garlinghouse Drives XRP’s Global Expansion; Know How

2.52 Million Altcoins Are Ruining Crypto’s Future

Animoca Brands Valuation Tanks 75% In Two Years, Here’s Why

Crypto exchange BingX hacked for $43 million

Are The Big Players Losing Interest?

Hong Kong’s Securities Association Tips Authorities On Crypto Self-Regulation

Coinbase cbBTC Set to go Live on Solana
2.52 Million Altcoins Are Ruining Crypto’s Future
Animoca Brands Valuation Tanks 75% In Two Years, Here’s Why
Crypto exchange BingX hacked for $43 million
Are The Big Players Losing Interest?
Hong Kong’s Securities Association Tips Authorities On Crypto Self-Regulation
Coinbase cbBTC Set to go Live on Solana
-

 Market21 hours ago
Over $700 Million In XRP Moved In April, What Are Crypto Whales Up To?
-

 Altcoin21 hours ago
CZ Honors Nearly $1 Billion Token Burn Promise
-

 Altcoin22 hours ago
Coinbase Reveals Efforts To Make Its Solana Infrastructure Faster, Here’s All
-
 Market20 hours ago
Crypto Casino Founder Charged With Fraud in New York
-
 Market24 hours ago
Bitcoin Price Poised for $90,000 Surge
-
 Altcoin24 hours ago
XRP Continues To Outpace ETH For 5 Months; What Lies Ahead?
-

 Market22 hours ago
XRP Price Finds Stability Above $2 As Opposing Forces Collide
-

 Altcoin14 hours ago
Dogecoin Price Breakout in view as Analyst Predicts $5.6 high