
Market
How Bitcoin Realized Profits May Impact BTC Price

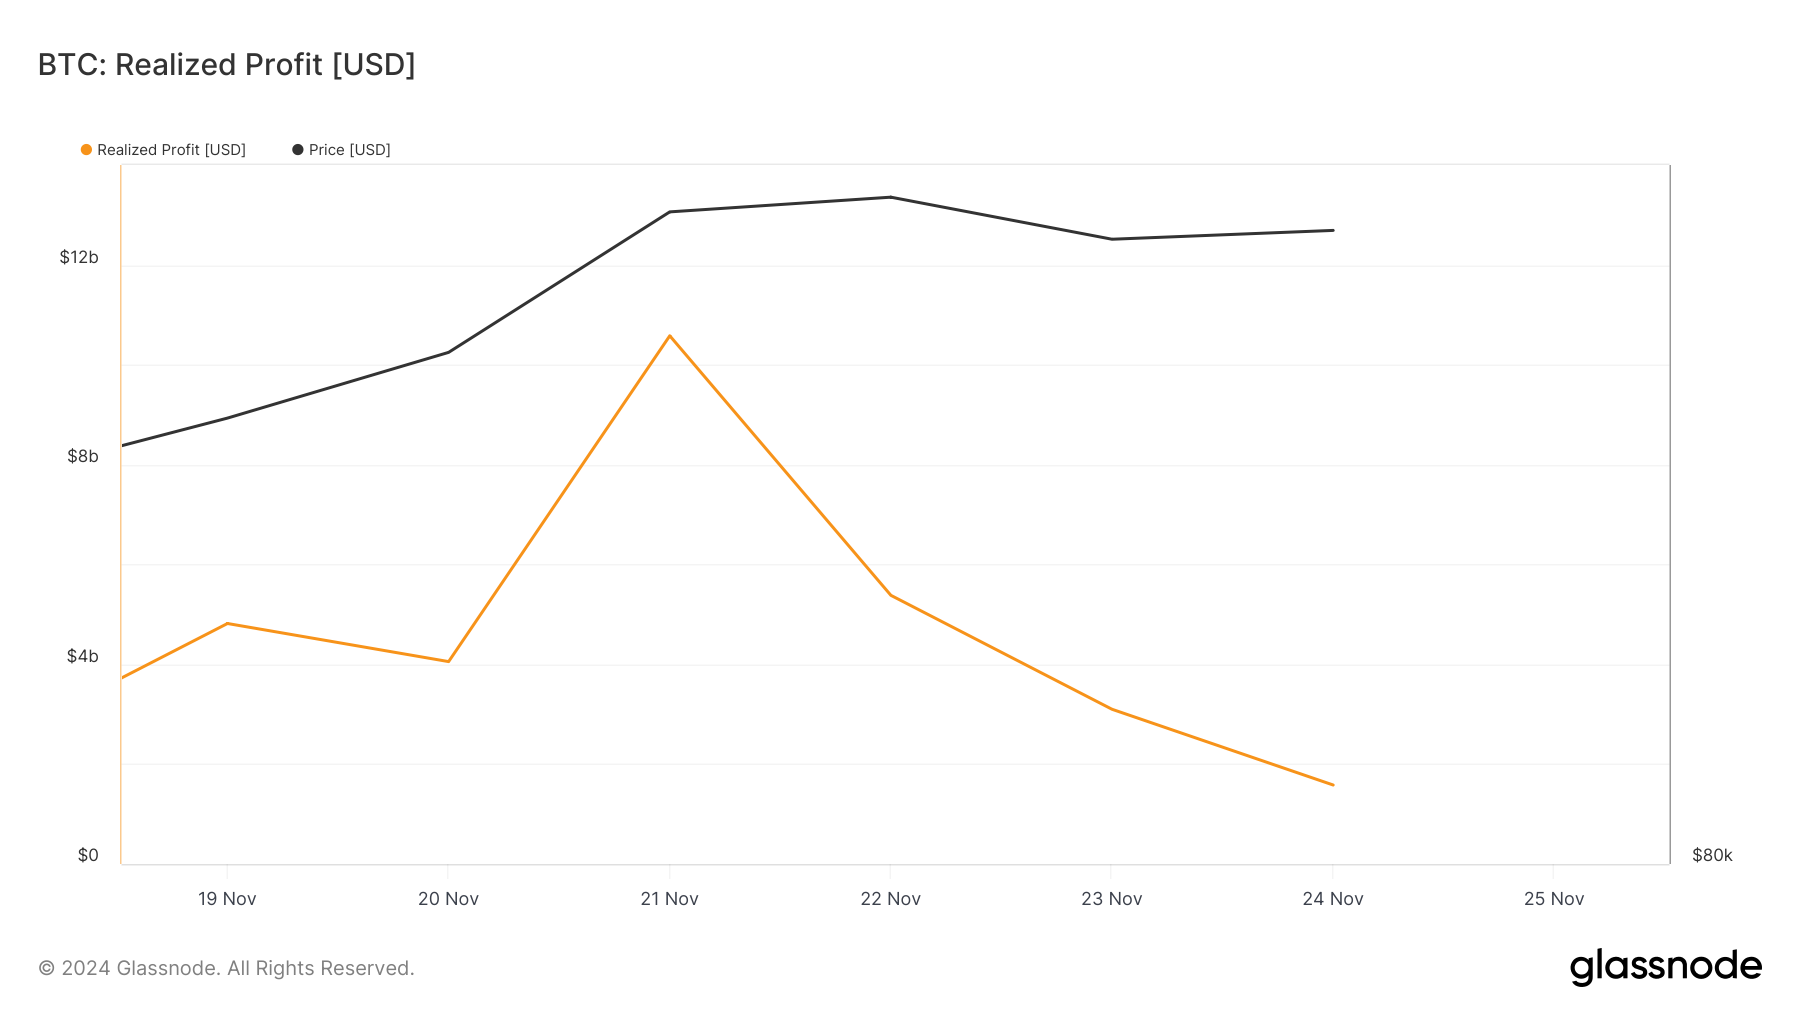
Since November 21, Bitcoin (BTC) has hovered near the $100,000 mark but hasn’t hit it, with BeInCrypto attributing this to increased realized profits.
Recent data shows that profit-taking activity has slowed. What does this mean for Bitcoin’s price?
Bitcoin Holders Step Back from Booking Gains
Data from Glassnode shows that Bitcoin realized profits surged to $10.58 million on Thursday, November 21. However, as of this writing, the value has dropped to $1.58 million, a $9 million difference.
As the name implies, realized profit is the value of coins sold after their price has increased. Therefore, when this metric rises, it becomes challenging for the cryptocurrency’s price to continue its rally.
However, since the realized profit has dropped, most BTC holders have halted selling in large volumes. If this trend continues, Bitcoin’s price could bounce and probably rise to the $100,000 milestone.
This sentiment is further supported by the Coins Holding Time metric, which tracks how long a cryptocurrency has been held without being transacted or sold.
When the Coins Holding Time decreases, it means holders of a particular crypto are selling. If this continues, the trend becomes bearish. However, over the last seven days, BTC Coins Holding Time has increased by 65%.

This increment reinforces the bias by the Bitcoin realized profit that selling pressure has decreased. Interestingly, IT Tech, an analyst on CryptoQuant, agrees with the thesis that Bitcoin might continue to climb.
“The green bars showing STH selling in profit have yet to reach levels seen during the previous $72,400 peak. This suggests that profit-taking pressure hasn’t peaked, leaving room for further upward movement in price,” IT Tech said.
BTC Price Prediction: $102, 500 Seems Close
On the daily chart, BTC continues to trade within an ascending channel, suggesting that it has the potential to climb higher.
BeInCrypto also observed that the Supetrend indicator has remained bullish. The Supertrend is a technical indicator used to spot the direction in which an asset moves.
If the red part of the indicator is above the price, the trend is downward, and the price can decrease. However, since the green area is below the price, the value might rise above $99,780. If that were the case, Bitcoin’s price might climb to $102,500.
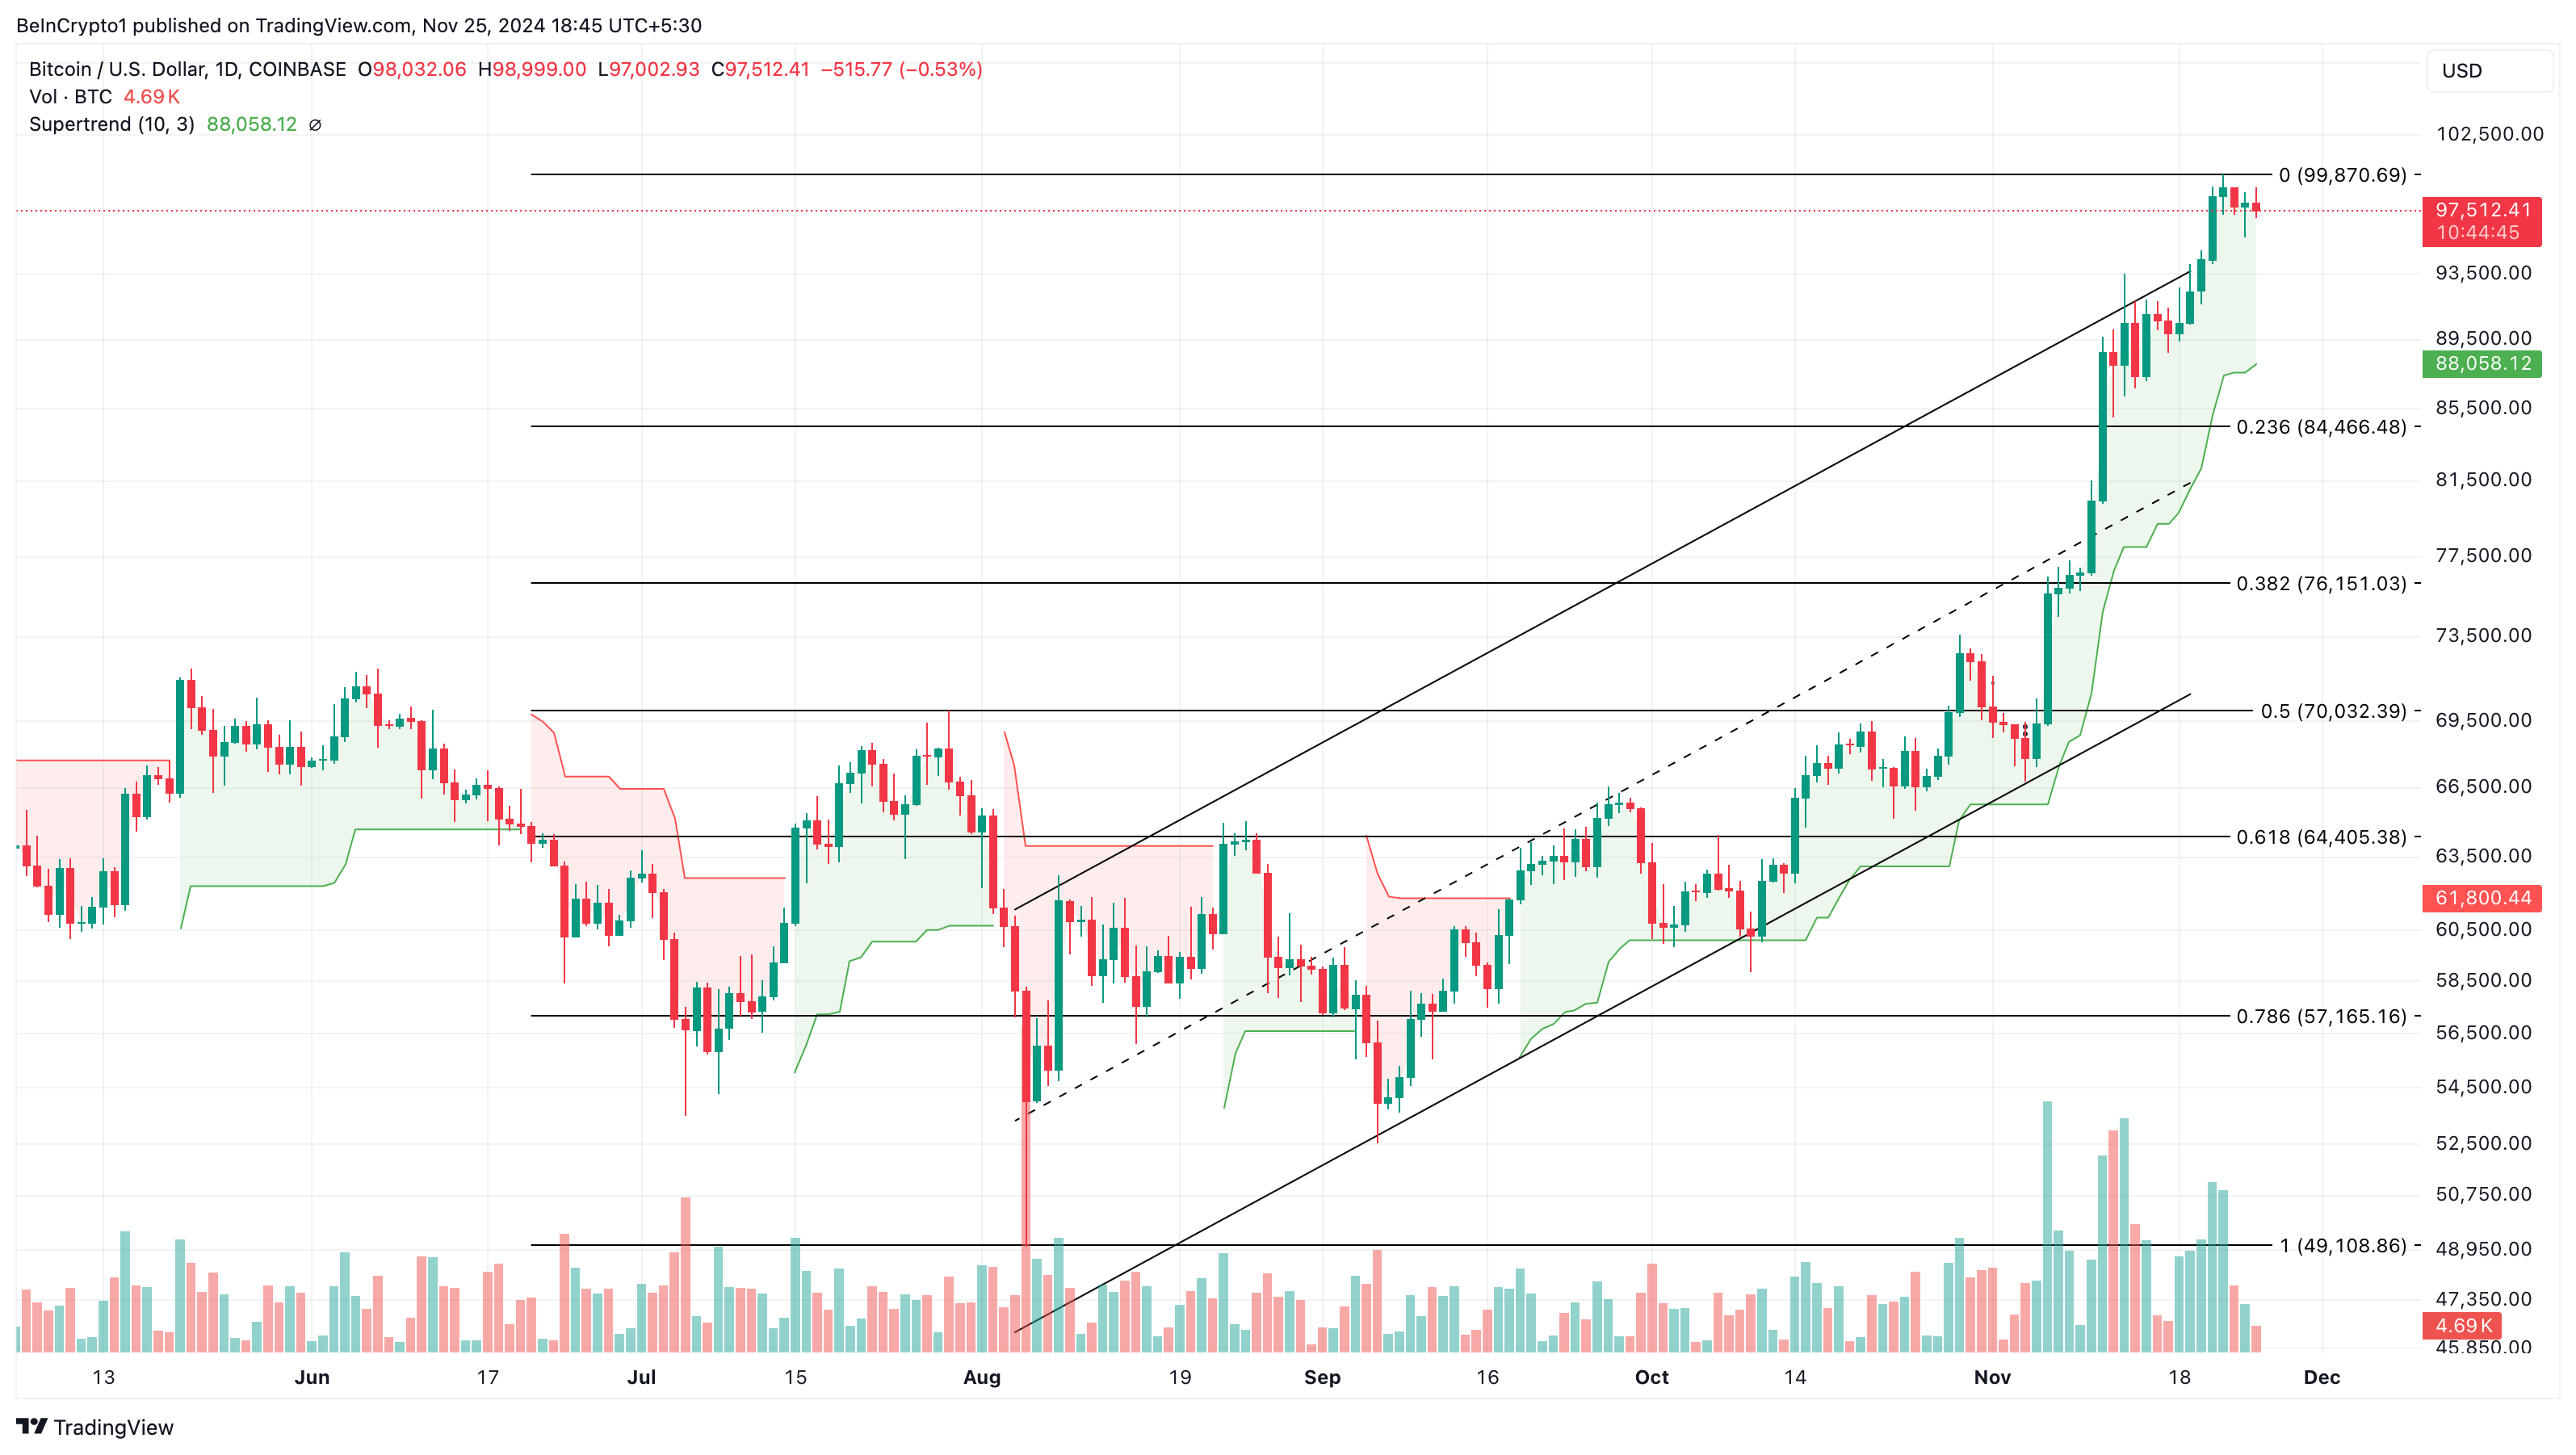
On the other hand, if Bitcoin realized profits surge again, this might not happen. Instead, the value could decline to $84,466.
Disclaimer
In line with the Trust Project guidelines, this price analysis article is for informational purposes only and should not be considered financial or investment advice. BeInCrypto is committed to accurate, unbiased reporting, but market conditions are subject to change without notice. Always conduct your own research and consult with a professional before making any financial decisions. Please note that our Terms and Conditions, Privacy Policy, and Disclaimers have been updated.


Welcome to the US Morning Crypto News Briefing—your essential rundown of the most important developments in crypto for the day ahead.
Grab a coffee to see what experts have to say about Bitcoin’s (BTC) price outlook. Key investment strategies are driving the next directional bias for the pioneer crypto.
Is a $90,000 Breakout Imminent for Bitcoin?
Crypto markets continue to reel from Trump-infused volatility, which weighs heavily on investor sentiment. Traders and investors are bracing for macroeconomic headwinds that continue to temper modest gains.
Among them is Trump’s tariff chaos, which provoked China’s retaliatory stance. Adding another layer of complexity to the US crypto news, Federal Reserve (Fed) chair Jerome Powell ruled out a near-term rate cut, citing economic uncertainty and risks from trade policy.
Reports also indicate that China is liquidating seized cryptocurrencies through private firms to support local government finances amid economic struggles.
The macro context also includes Jerome Powell’s hawkish Federal Reserve (Fed) stance, which ruled out a near-term rate cut.
Amidst this uncertainty, investors may delay allocating capital to high-volatility assets until the macroeconomic outlook stabilizes.
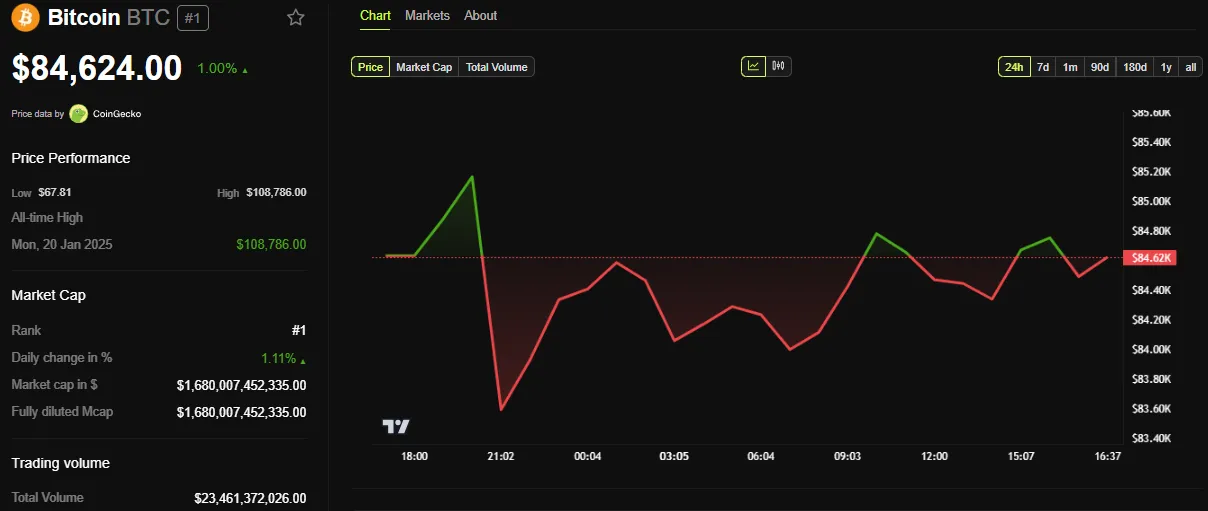
This likely explains Bitcoin’s stunted outlook, oscillating between the $80,000 and $90,000 psychological levels.
However, despite the concerns, analysts are still optimistic, citing key investment or trading strategies. BeInCrypto contacted Blockhead Research Network (BRN) analyst Valentin Fournier, who alluded to the Wyckoff price cycle.
“Our base case remains an accumulation phase, with occasional dips likely before Bitcoin can make a clean break above the $89,000–$90,000 resistance,” Fournier told BeInCrypto.
The Wyckoff Price Cycle, developed by Richard Wyckoff, is a technical analysis framework to identify market trends and trading opportunities. It consists of four phases:
- Accumulation: Where smart money buys at low prices, often marked by a “spring” (a false breakdown).
- Markup: A bullish phase with rising prices.
- Distribution: Where smart money sells at highs, also featuring a “spring” (false breakout).
- Markdown: A bearish phase with declining prices.
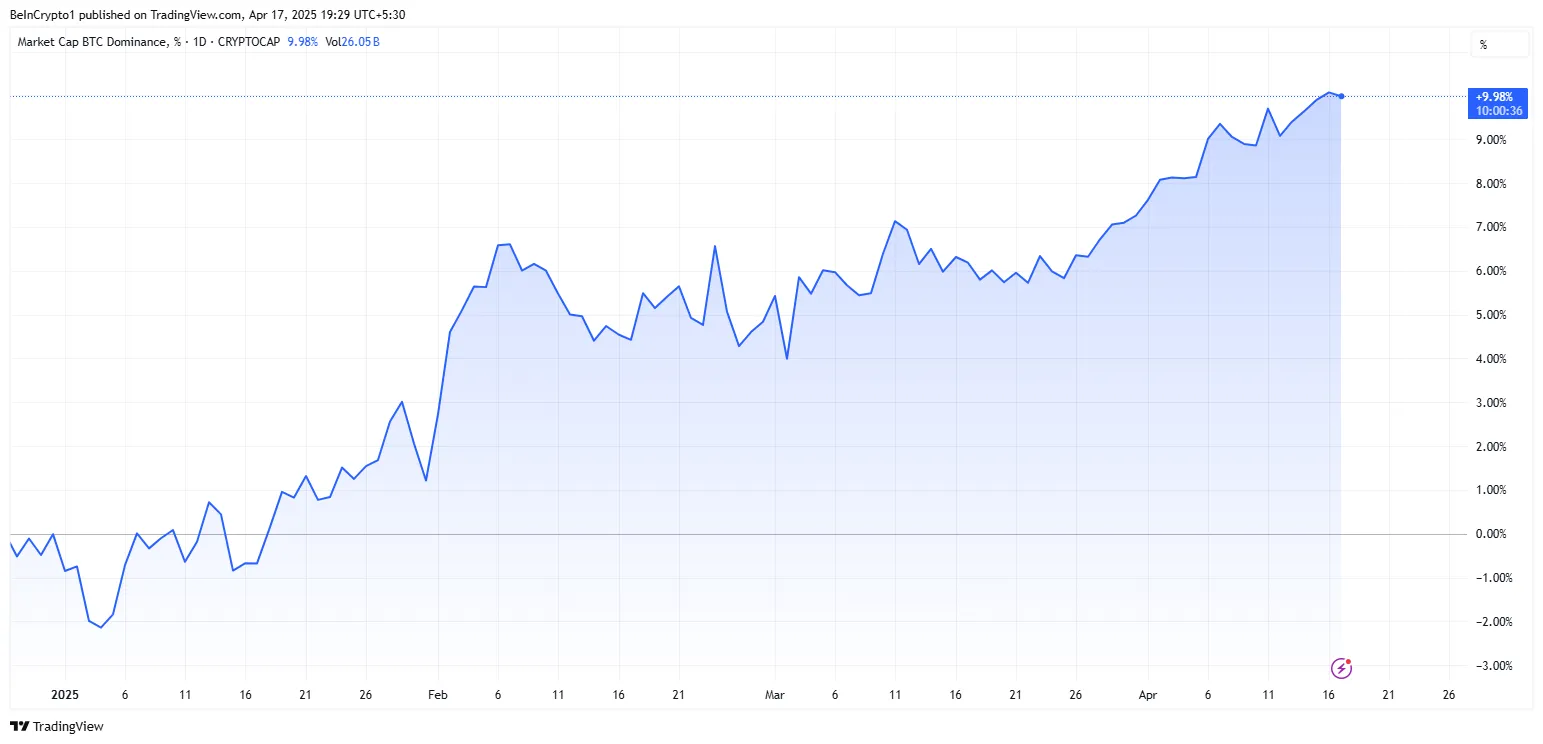
Fournier added that because Bitcoin dominance continues to rise, this suggests altcoins could continue underperforming in the short term.
He also noted that, in contrast to Bitcoin’s strength, trade tensions have affected traditional markets more.
“This is highlighted by Nvidia’s decline following new export restrictions on chips to China,” he said.
What Does Options Data Say?
If the accumulation phase thesis is true, it aligns with a recent analysis by Deribit’s Tony Stewart, highlighting trader sentiment favoring the upside.
The bullish cohort is buying $90,000 to $100,000 Calls, suggesting bets on a price rise for Bitcoin. However, others are bearish, buying $80,000 Puts and selling $100,000+ Calls, indicating they expect a decline or hedging.
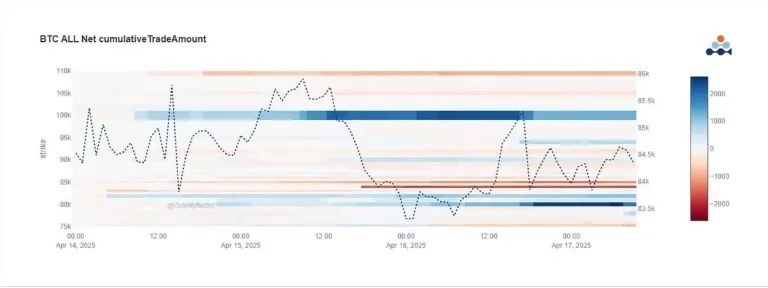
Likewise, funding strategies reveal bullish traders are rolling up positions from $84,000 to $90,000 Calls and selling lower Puts ($75,000) to finance their bets. This indicates confidence in a near-term rally.
Chart of the Day
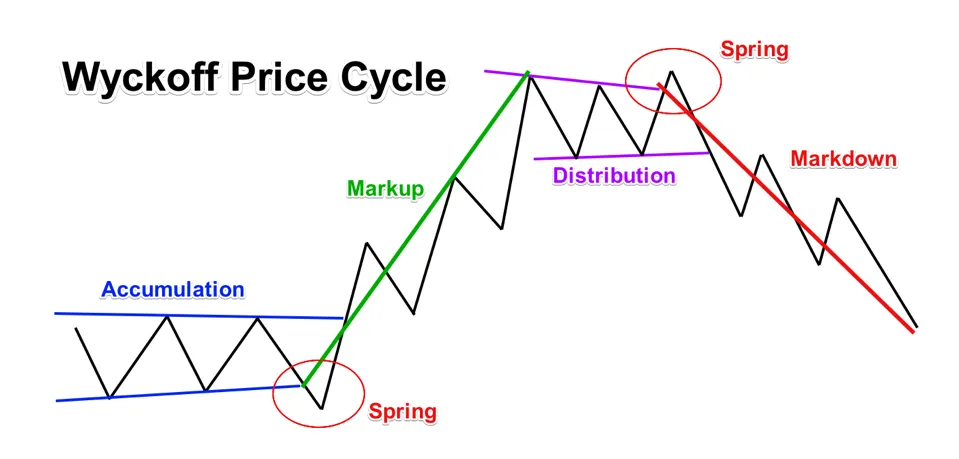
Traders analyze these repeating phases’ price action, volume, and market structure. Based on that, they can spot reversals and time entries or exits while understanding institutional behavior.
Byte-Sized Alpha
- Bitcoin whales withdrew over $280 million from exchanges in one day, signaling a bullish move toward cold storage amid market volatility.
- Gary Gensler warns that many altcoins lack solid fundamentals, and their value is driven more by sentiment, making them unsustainable.
- CEO Richard Teng confirms that Binance advises global governments on crypto policy and helps countries establish crypto reserves.
- Coinbase forecasts short-term crypto volatility through mid-May 2025, citing economic pressures and trade policy uncertainties.
- Ethereum’s dominance has dropped to 7.3%, hitting a 5-year low, which analysts view as a rare long-term buying opportunity.
- A16z urges the SEC to modernize crypto custody rules, advocating for RIAs to self-custody digital assets under clear safeguards.
- Bitcoin struggles below $85,000, and open interest remains stagnant below $36 billion, indicating indecision among traders. Positive funding rates hint at renewed optimism.
- Base reveals ambitious Q2 roadmap only hours after a meme coin, allegedly promoted by insiders, triggered a trading frenzy and abrupt collapse.
Crypto Equities Pre-Market Overview
| Company | At Close April 16 | Pre-Market Overview |
| Strategy (MSTR) | $311.66 | $315.50 (+1.31%) |
| Coinbase Global (COIN) | $172.21 | $174.10 (+1.10%) |
| Galaxy Digital Holdings (GLXY.TO) | $15.58 | $15.15 (-2.69%) |
| MARA Holdings (MARA) | $12.32 | $12.40 (+0.65%) |
| Riot Platforms (RIOT) | $6.36 | $6.41 (+0.79%) |
| Core Scientific (CORZ) | $6.59 | $6.68 (+1.37) |
Disclaimer
In adherence to the Trust Project guidelines, BeInCrypto is committed to unbiased, transparent reporting. This news article aims to provide accurate, timely information. However, readers are advised to verify facts independently and consult with a professional before making any decisions based on this content. Please note that our Terms and Conditions, Privacy Policy, and Disclaimers have been updated.
Reason to trust
![]()
Strict editorial policy that focuses on accuracy, relevance, and impartiality
Created by industry experts and meticulously reviewed
The highest standards in reporting and publishing
Strict editorial policy that focuses on accuracy, relevance, and impartiality
Morbi pretium leo et nisl aliquam mollis. Quisque arcu lorem, ultricies quis pellentesque nec, ullamcorper eu odio.
XRP remains one of the most popular coins in the market, with a cult-like community that has supported it for years. With the bullish sentiment surrounding it, the altcoin has performed quite well and continues to inspire support. The most recent developments for XRP have been the ETF filings that suggest it might be the next altcoin to get an SEC nod after Ethereum. The number of filings also puts it well ahead of investor favorites such as Solana and Dogecoin in the running for the next ETF approval.
XRP ETF Filings Climb To 10
XRP ETF filings have been coming out of the market over the past year, especially with the approvals of Ethereum Spot ETFs. These ETFs are expected to give institutional investors an official vehicle to get proper exposure to the market. As Bitcoin and Ethereum ETFs have been done and dusted, issuers have looked to other large cap altcoins to bring into the market.
Related Reading
The next favorites on the list have been XRP, in addition to heavy hitters such as Solana, Dogecoin, and Litecoin. However, in the race, XRP has clearly differentiated itself in terms of interest, boasting twice as many filings as any other altcoin.
According to data from Kaito Research, there are currently 10 XRP ETF filings pending approval or rejection from the SEC. In contrast, there are five Solana ETF filings, 3 Litecoin filing, and 3 Dogecoin filings. This shows clearly that interest in XRP as the next altcoin to gain ETF approval is the highest.
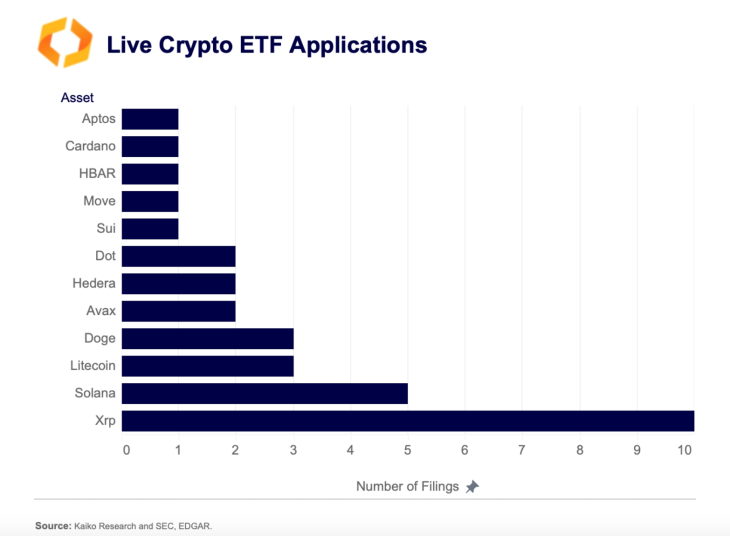
Additionally, the SEC has acknowledged the XRP ETF filings from industry leaders such as Grayscale. There are also filings from ProShares, Franklin Templeton, Bitwise, 21Shares, among others. However, BlackRock has not made a move to file for an XRP ETF despite leading the Bitcoin and Ethereum ETF campaigns.
Nevertheless, the filings for XRP ETFs remain a big deal for the altcoinm and their approval could trigger another wave of price hikes.
ETFs And The SEC Battle Conclusion
For many, the major hindrance to an SEC approval of an XRP ETF was the ongoing battle between the crypto firm and the regulator, which began in 2020. However, in March 2025, Ripple CEO Brad Garlinghouse announced that the case was officially over.
Related Reading
With this development, expectations that the regulator will look favorably upon an XRP ETF are high. If the ETFs are approved, even with a fraction of the Bitcoin ETF volumes, the XRP price is expected to explode in response, with some analysts predicting that the altcoin’s price could rise to the double-digits.
Featured image from Dall.E, chart from TradingView.com

Ethereum Layer-2 (L2) network Base, incubated by Coinbase, has unveiled its product roadmap for the second quarter (Q2) 2025.
It indicates a bold slate of performance upgrades, enhanced privacy features, and broader support for developers.
Base Q2 Roadmap: Speed, Privacy, and Builder Adoption
In a detailed post on X (Twitter), Base’s development team outlined key objectives for the quarter. The roadmap reaffirms Base’s commitment to building in the open. It also lays the groundwork for scaling its role as a core pillar of the on-chain economy.
The plan to achieve 200ms effective block times on the mainnet is among the most eye-catching. The move could dramatically increase throughput and improve user experience.
Additionally, Base aims to scale blockspace from 30 to 50 Mgas/s and reach “Stage 1 decentralization.” Notably, they are key milestones in both performance and network security.
Privacy is also a central focus. Base is working to implement privacy-preserving on-chain account verification. This initiative reflects the growing importance of identity and privacy in a blockchain environment where transparency and pseudonymity often clash.
Beyond scaling and privacy, the roadmap details efforts to enhance its developer toolkit, notably expanding usage of the Base MCP (Modular Crypto Platform) tooling. This includes increasing weekly active apps built on OnchainKit and MiniKit and launching new Base Appchains on the mainnet.
The Base MCP tooling is part of a broader push to enable developers to go from “Idea to App, App to Business,” as described by the team. However, it is worth noting that MCP protocols have come under scrutiny recently due to a critical security flaw, raising concerns about their current implementations.
BeInCrypto recently reported on vulnerabilities that, if left unpatched, could expose user data or funds. This suggests that Base’s teams must prioritize security alongside growth.
“This risk comes from using a ‘poisoned’ MCP. Hackers could trick Base-MCP into sending your crypto to them instead of where you intended. If this happens, you might not notice,” Superoo7, head of Data and AI at Chromia, highlighted.
Base’s community-centric ethos is evident in its continued support for builder programs like Base Batches, Buildathons, and the Builder Rewards initiative. The team emphasized that these initiatives will support developers technically and economically, creating viable paths to earning a living by building on-chain.
Coinbase CEO Brian Armstrong also weighed in, endorsing the roadmap with a simple but affirming statement. This highlights Coinbase’s continued backing of the Layer-2 solution, which has become a standout in the ecosystem.
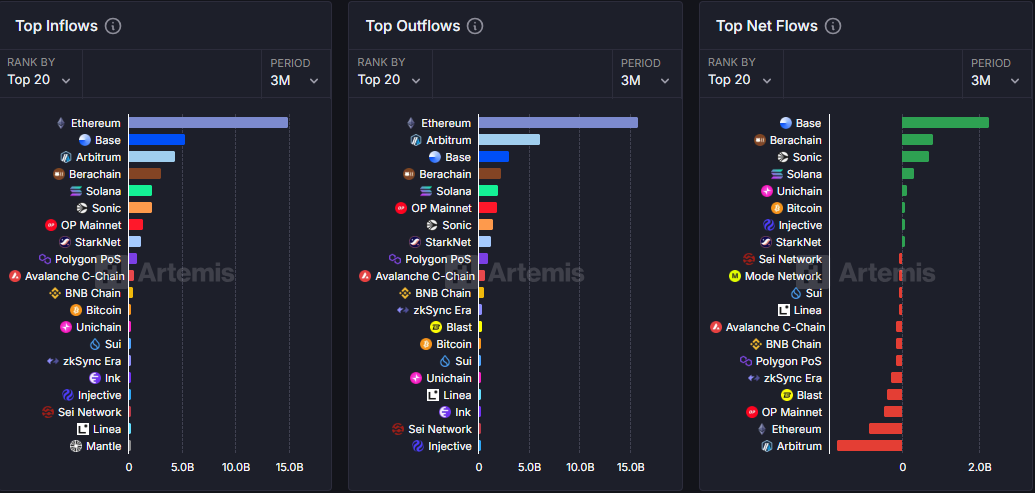
Base Blockchain Leads Net Flows Across DeFi Bridges
Base has emerged as a top performer in 2025, leading the market in net flow over the past three months. On total inflow metrics, data on Artemis Terminal shows it is second, after Ethereum (ETH). This traction reflects growing user confidence and adoption across DeFi, gaming, and NFT verticals.
Still, the network has not been immune to controversy. Only hours ago, Base faced backlash after a meme coin, allegedly promoted by insiders, triggered a trading frenzy and abrupt collapse. As BeInCrypto reported, this raised accusations of a pump-and-dump scheme.
While Base distanced itself from the coin in question, the incident raises concerns about transparency and ethical boundaries on the platform.
“This wasn’t a meme coin. This wasn’t a token launch. Base didn’t drop a coin to pump bags or flip the market. This was a content coin — and that distinction matters,” Base developer Charis posted on X.
As Base moves into Q2, it stands at a crossroads. On the one hand, it is armed with performance upgrades and developer momentum. On the other hand, it faces heightened scrutiny.
If successful, its roadmap could further cement Base’s place as a foundation of the next-generation internet. However, the pressure to balance innovation, security, and trust has never increased.
Disclaimer
In adherence to the Trust Project guidelines, BeInCrypto is committed to unbiased, transparent reporting. This news article aims to provide accurate, timely information. However, readers are advised to verify facts independently and consult with a professional before making any decisions based on this content. Please note that our Terms and Conditions, Privacy Policy, and Disclaimers have been updated.

XRP Continues To Outpace ETH For 5 Months; What Lies Ahead?
Bitcoin Price Poised for $90,000 Surge
Why XRP Could Beat Dogecoin, Solana In ETF Race And Trigger A Price Surge

Expanding Blockspace and Enhancing Privacy

Bitcoin Price Range-Bound—But a Move Higher May Be Brewing?

How Crypto Traders Made $666K from $4.5K in One Trade?

2.52 Million Altcoins Are Ruining Crypto’s Future

Animoca Brands Valuation Tanks 75% In Two Years, Here’s Why

Crypto exchange BingX hacked for $43 million

Are The Big Players Losing Interest?

Hong Kong’s Securities Association Tips Authorities On Crypto Self-Regulation

Coinbase cbBTC Set to go Live on Solana
2.52 Million Altcoins Are Ruining Crypto’s Future
Animoca Brands Valuation Tanks 75% In Two Years, Here’s Why
Crypto exchange BingX hacked for $43 million
Are The Big Players Losing Interest?
Hong Kong’s Securities Association Tips Authorities On Crypto Self-Regulation
Coinbase cbBTC Set to go Live on Solana
-

 Market22 hours ago
How It’s Impacting the Network
-
 Altcoin20 hours ago
DOGE Whale Moves 478M Coins As Analyst Predicts Dogecoin Price Breakout “Within Hours”
-

 Market18 hours ago
Bitcoin and Ethereum Now Accepted by Panama City Government
-

 Market15 hours ago
Crypto Market Lost $633 Billion in Q1 2025, CoinGecko Finds
-
 Altcoin22 hours ago
Analyst Reveals Why The Solana Price Can Still Drop To $65
-

 Market21 hours ago
Raydium’s New Token Launchpad Competes with Pump.fun
-

 Market20 hours ago
Pi Network Drops10% as Outflows Surge, Death Cross Looms
-
 Ethereum18 hours ago
Over 1.9M Ethereum Positioned Between $1,457 And $1,598 – Can Bulls Hold Support?
