
Market
HMSTR, CATI on Binance Launchpool and More

This week in the crypto sphere brings exciting updates: Binance Launchpool introduces HMSTR and CATI, Ripple’s RLUSD might be limited to institutional investors, and significant legal developments involving Ripple and the SEC.
Additionally, a notable debate among presidential candidates on crypto policies and updates from the gaming platform Snek.fun offer a broader perspective on the current market climate.
Binance Launchpool Welcomes HMSTR and CATI
Binance’s Launchpool platform welcomed Hamster Kombat (HMSTR) and Catizen (CATI), marking significant additions that offer users new staking opportunities. On September 12, Binance announced that Hamster Kombat would become the 58th project on its Launchpool.
Hamster Kombat is a tap-to-earn game built on the Telegram mini-app platform. It provides a unique gaming experience in which players simulate crypto exchange CEOs in competitive battles. Hamster Kombat has a total token supply of 100,000,000,000 HMSTR, with 3% allocated for Launchpool token rewards.
Read more: What Is Hamster Kombat?
Users can stake Binance Coin (BNB) and First Digital USD (FDUSD) to receive HMSTR airdrops over three days starting September 23, 2024, at 00:00 UTC. Binance plans to list HMSTR on September 26, 2024, at 12:00 UTC, opening trading with HMSTR/USDT, HMSTR/BNB, HMSTR/FDUSD, and HMSTR/TRY pairs.
Following the HMSTR announcement, Binance revealed on September 13 that Catizen would be the 59th project on its Launchpool. Catizen is a cat-themed gaming bot built on the Telegram mini-app platform.
Since its inception six months ago, Catizen has attracted 34 million players and boasts over two million active on-chain users. The project reports an 800,000-paying user base and an average revenue per paying user of $33.
Catizen has a total and maximum token supply of 1,000,000,000 CATI, with 9% allocated for Launchpool token rewards. Users can stake BNB and FDUSD to receive CATI airdrops over four days starting September 16, 2024, at 00:00 UTC. Binance will list CATI on September 20, 2024, at 10:00 UTC, with trading pairs CATI/USDT, CATI/BNB, CATI/FDUSD, and CATI/TRY.
3 Much-Anticipated Upcoming Airdrops and TGE in TON Ecosystem
The Open Network (TON) has generated excitement with its airdrop initiatives. This September, TON is hosting several token generation events (TGE) and airdrops.
First, Catizen, one of TON’s key projects, is set to have its token, CATI, listed on major exchanges such as OKX, KuCoin, Bybit, and Gate.io starting September 20. Launched six months ago, Catizen has attracted 34 million players, with over two million active on-chain participants and 800,000 paying users, averaging $33 in revenue per paying user.
Next on the list is Hamster Kombat, another notable project that will hold its TGE and airdrop on September 26. Exchanges like Bitfinex, Bybit, and OKX will list the HMSTR token. However, the community has expressed concerns about the lack of clarity regarding airdrop criteria.
“The community is eager to participate, but the constant introduction of new games and features has caused confusion and overwhelm,” an X user said.
The CATS project also plans a TGE and airdrop this month, though the exact date remains unspecified. With more than 20 million users, CATS aims to reward Telegram users based on account age and activity level, with all Telegram users eligible to participate. A dedicated bot will assess user statistics to determine token allocation, and additional tokens can be earned through a referral system and minor tasks.
RLUSD Stablecoin and Ripple Legal Developments
Ripple’s Chief Technology Officer, David Schwartz, confirmed on September 8 that the upcoming RLUSD stablecoin would likely be available exclusively to institutional investors. In a social media exchange, Schwartz responded to an XRP user who suggested that RLUSD should be limited to large financial institutions to prevent misuse in illegal activities such as money laundering. He compared RLUSD to existing stablecoins like USDC and USDT, noting that individual investors typically cannot purchase these stablecoins directly from their issuers.
“Probably only ever be available directly to institutions. Can you get USDC from Circle or USDT from Tether, because I can’t.” Schwartz stated.
In a separate but related development, the US Securities and Exchange Commission (SEC) dropped its claims against Ripple executives Brad Garlinghouse and Chris Larsen. This action has sparked rumors of an appeal, especially since Ripple proposed to deposit 111% of the financial judgment into a bank account, presumably to ensure a pause in the case.
A former SEC regional director, Marc Fagel, provided insights into the potential appeal. He emphasized Ripple’s systematic sales rather than debating XRP’s classification as a security.
“If [the SEC chooses to] appeal, it will likely be over whether the programmatic sales constituted securities sales,” Fagel explained.
Furthermore, he clarified that the Court of Appeals could address this issue without deciding whether XRP is a security, as it remains a peripheral matter. Legal expert Bill Morgan also commented on the case, assuring XRP holders that the core judgment—that XRP is not a security—should stand firm despite potential legal maneuvering.
Cardano’s Network Activity Surges with Meme Coin Launchpad Snek.fun
Charles Hoskinson, the founder of Cardano, praised Snek.fun, a meme coin launchpad, for significantly increasing the network’s activity. On September 6, Snek.fun announced a record daily transaction volume for Cardano. This marked the highest 24-hour decentralized exchange (DEX) trading activity in the blockchain’s history.
Launched on September 5, Snek.fun is a meme coin launchpad created by SNEK and Splash, a DEX on Cardano. The platform allows users to create tokens for a fee of 25 ADA.
Once 75% of a token’s supply is purchased, and the market cap reaches 42,069 ADA, a bonding curve is triggered, adding 25% of the supply to a liquidity pool on Splash DEX. Liquidity provider (LP) tokens are then burned to prevent the team from withdrawing liquidity.
Snek.fun initially faced challenges due to high user demand and network congestion. However, it was able to optimize its platform quickly. Within the first 24 hours, over 2,000 tokens were created, and trading volume exceeded 5 million ADA.
Regardless of the achievement, some analysts express concerns about the platform’s long-term viability. They stress the need for additional features, such as creator royalties and messaging systems, to ensure sustained success.
Presidential Debate Omits Crypto Discussion, Impacting PolitiFi Coins
This week also witnessed the first presidential debate between Vice President Kamala Harris and former President Donald Trump. Despite the mounting anticipation, the debate apparently ended without any mention of cryptocurrencies, leaving many crypto enthusiasts disappointed. Instead, the debate focused on topics such as the economy, immigration, and foreign policy.
However, the absence of discussions on crypto had immediate repercussions on the market. Following the debate, the crypto market reacted sharply, particularly affecting meme coins associated with politics—known as PolitiFi.
BeInCrypto reported that the total market capitalization of PolitiFi meme coins fell by 8.7% post-debate. Moreover, some Trump-linked meme coins suffered significant declines. For instance, MAGA (TRUMP) dropped by 10%, while MAGA Hat (MAGA) plummeted by 22.5%.
Read more: 7 Hot Meme Coins and Altcoins that are Trending in 2024
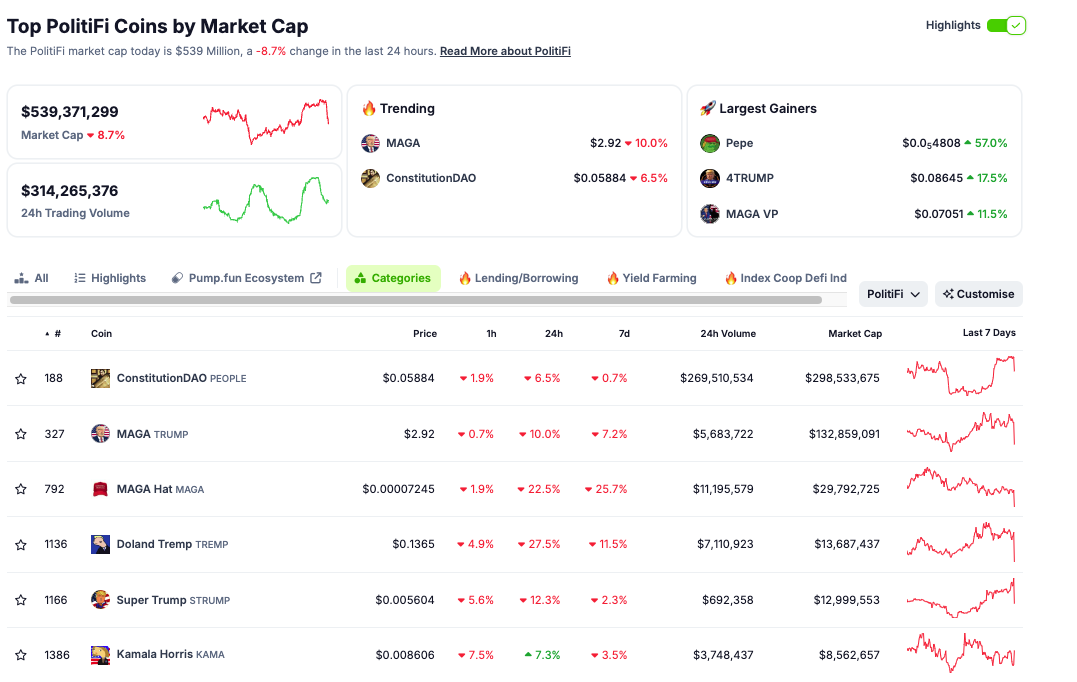
Conversely, the Kamala Horris (KAMA), a meme coin related to Kamala Harris, surged by 7.3%.
Disclaimer
In adherence to the Trust Project guidelines, BeInCrypto is committed to unbiased, transparent reporting. This news article aims to provide accurate, timely information. However, readers are advised to verify facts independently and consult with a professional before making any decisions based on this content. Please note that our Terms and Conditions, Privacy Policy, and Disclaimers have been updated.


Reason to trust
![]()
Strict editorial policy that focuses on accuracy, relevance, and impartiality
Created by industry experts and meticulously reviewed
The highest standards in reporting and publishing
Strict editorial policy that focuses on accuracy, relevance, and impartiality
Morbi pretium leo et nisl aliquam mollis. Quisque arcu lorem, ultricies quis pellentesque nec, ullamcorper eu odio.
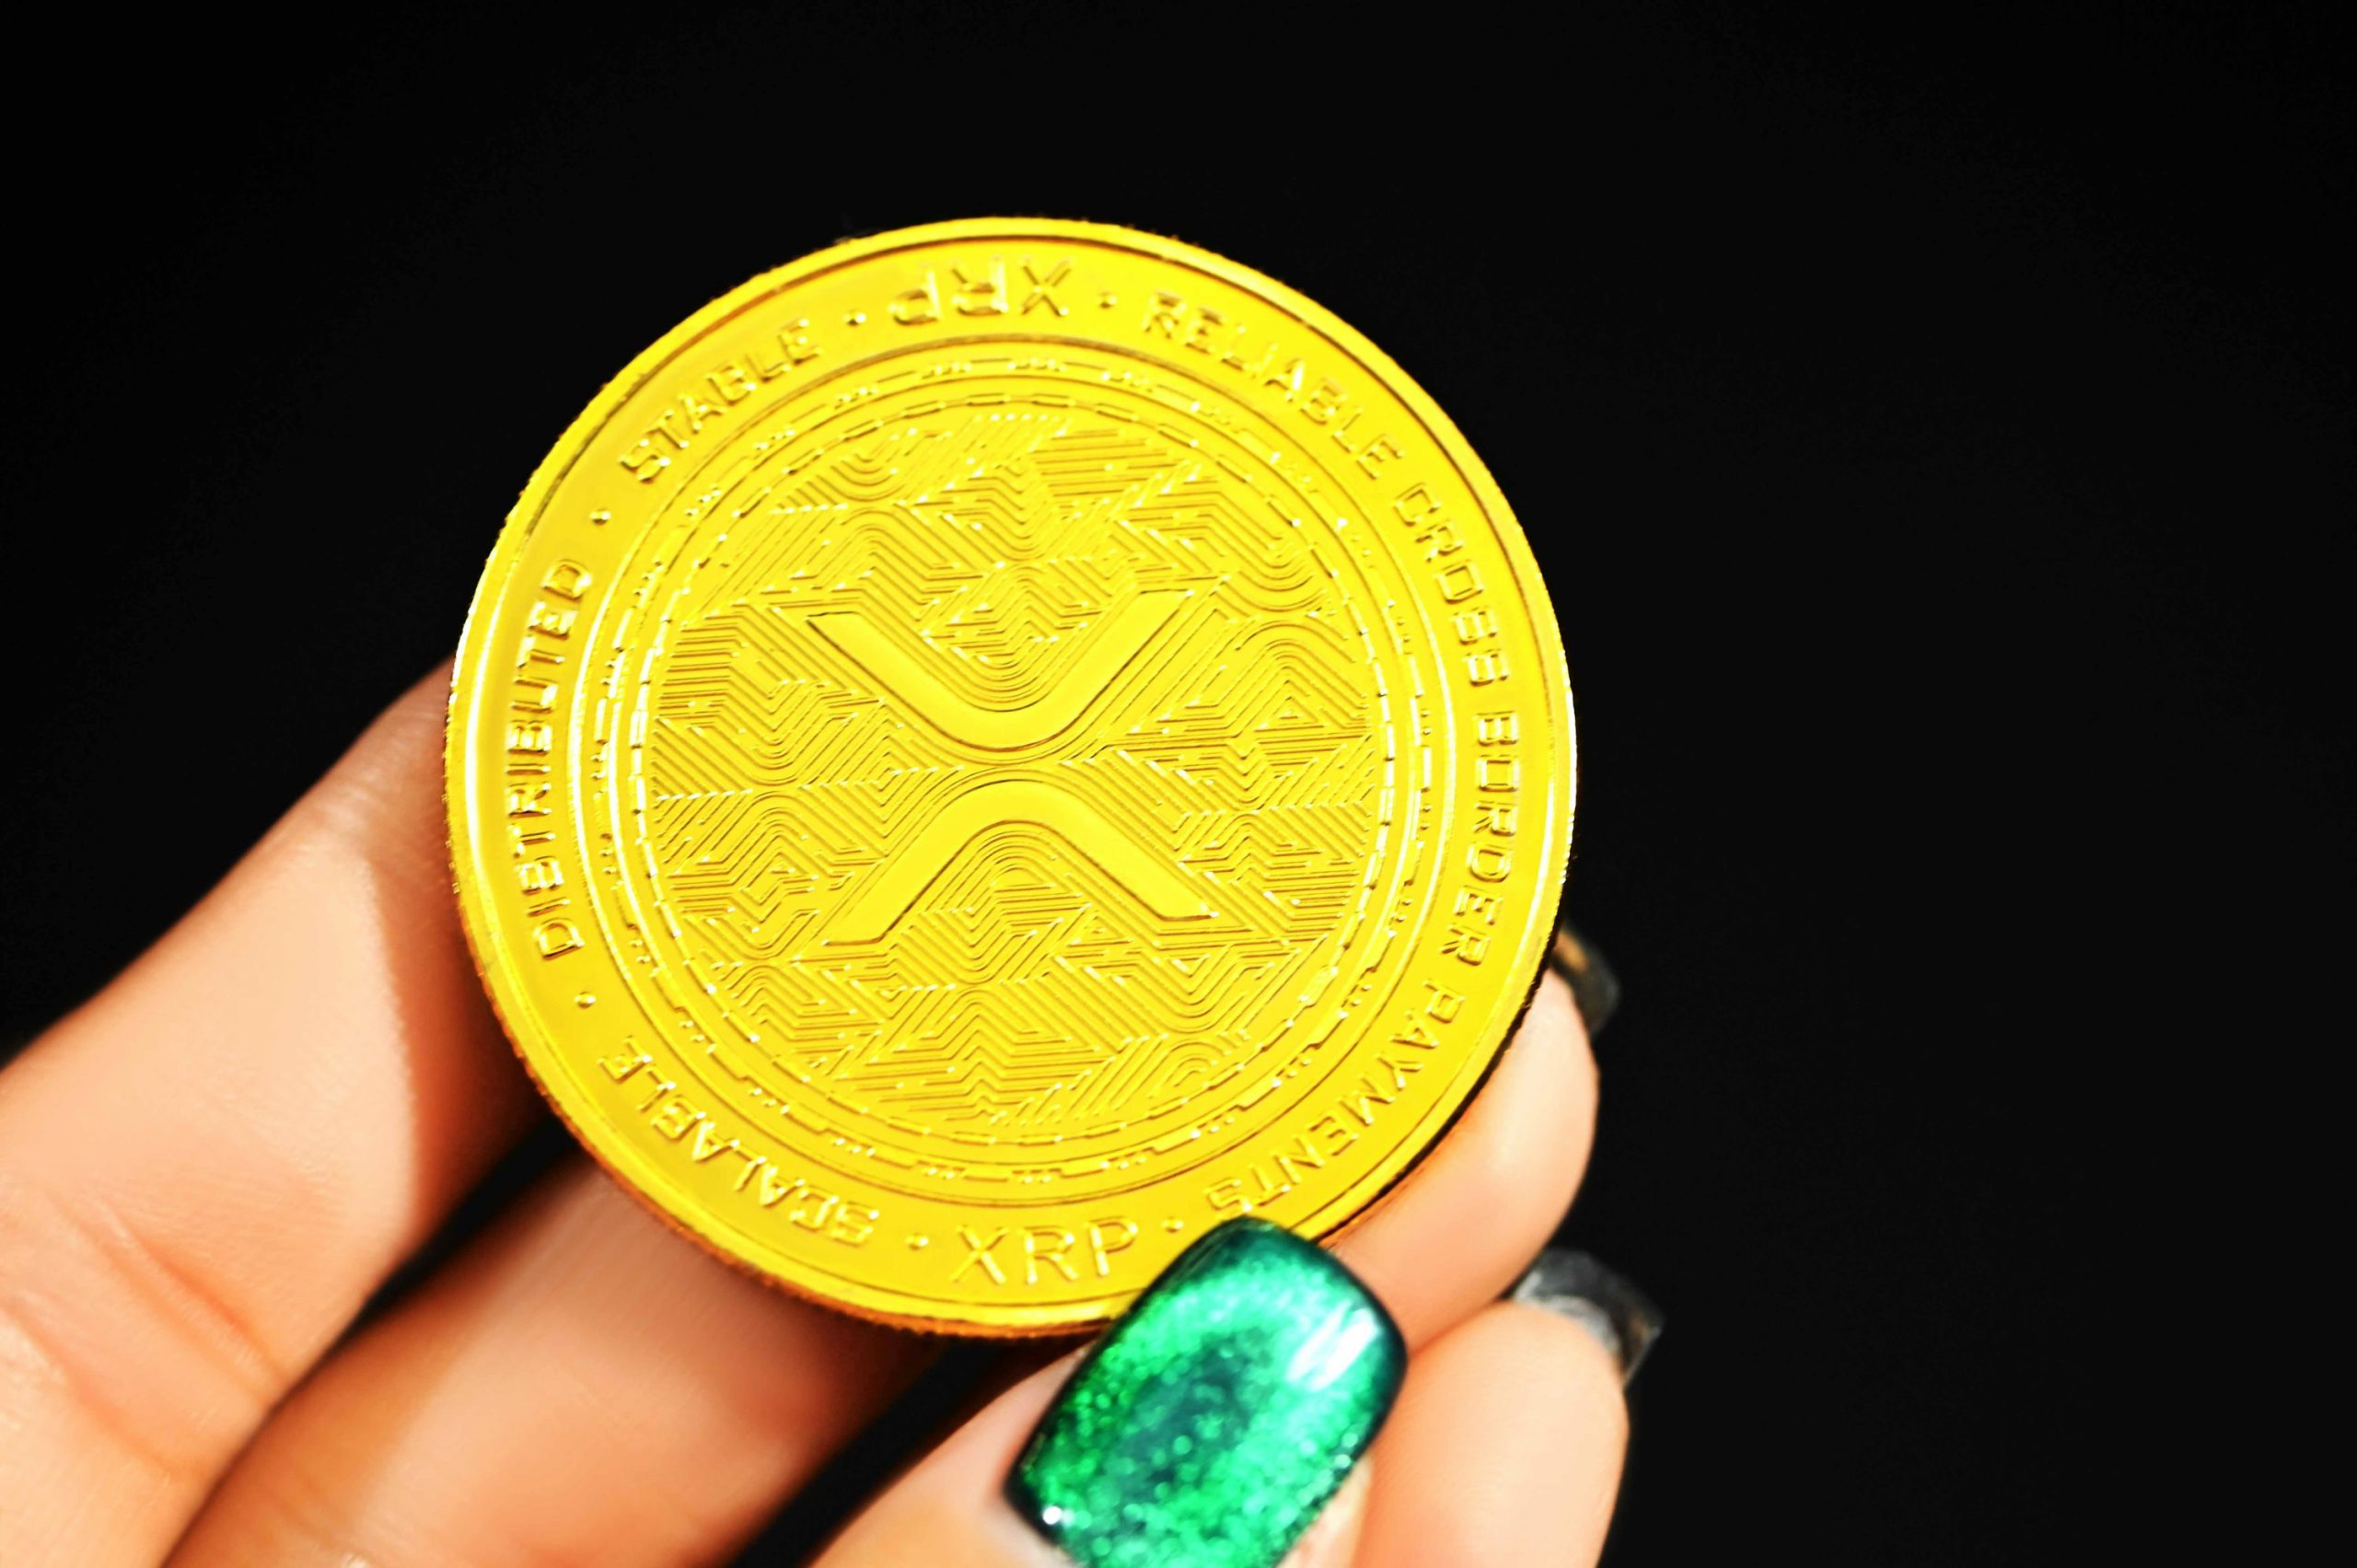
In a surprising move within the crypto market, XRP has surpassed Ethereum (ETH) in a key valuation metric: Fully Diluted Market Capitalization (FDMC). While Ethereum has been in a downtrend this bull cycle, XRP’s performance over the last six months has been nothing short of impressive, leading to it quietly overtaking the world’s second-largest cryptocurrency by market capitalization.
XRP Flips Ethereum In FDMC
Edward Farina, a crypto analyst and outspoken XRP supporter, took to X (formerly Twitter) on April 18 to announce that XRP has officially overtaken Ethereum in terms of Fully Diluted Market Capitalization. The FDMC represents the total potential value of a cryptocurrency if all of its tokens were in circulation.
Related Reading
This metric is usually calculated by multiplying a cryptocurrency’s current price by its maximum token supply. This contrasts with the more commonly referenced market capitalization metric, which only factors in circulating supply.
At the time of his post, Farina reported that XRP’s FDMC had reached $208.4 billion, surpassing Ethereum’s $192.5 billion by approximately $15.9 billion. This marks over six consecutive months of XRP outperforming Ethereum in terms of projected value, signaling a potential shift in altcoin dominance between the two leading cryptocurrencies.
Despite XRP’s FDMC milestone, it’s worth noting that Ethereum’s current market capitalization remains significantly higher. As of writing, ETH’s market cap is estimated at $199.14 billion, compared to XRP’s $124.3 billion, reflecting a difference of around $74.84 billion.
The key reason for this discrepancy between XRP’s market capitalization and FDMC lies in its unique token structure. A significant portion of XRP’s supply is held in escrow, meaning those tokens are not yet available in the open market. While they do not count toward the circulating supply, they are included in its Fully Diluted Market Capitalization.
The implication behind this distinction remains clear: if all of XRP’s tokens in escrow were unlocked and circulated today, its market value could exceed that of Ethereum. As the altcoin steadily gains momentum in valuation metrics and investor interest, it could pose a significant challenge to Ethereum’s position as the number one altcoin and second-largest cryptocurrency.
Bollinger Bands Signal Major Move In The Altcoin Price
The XRP price could be gearing up for a significant move upward as technical chart indicators point toward rising volatility. A recent analysis of the 4-hour chart by crypto analyst Ali Martínez shows Bollinger Bands tightening — a classic signal that often precedes a breakout.
Related Reading
Currently trading near the midline of the bands after a bounce from the lower support zone, XRP is now consolidating within a narrow range. The “squeeze” pattern reflects reduced volatility. While the target of the proposed price move remains uncertain, Martinez is confident that its next breakout is just around the corner.
Featured image from Unsplash, chart from Tradingview.com

Cardano (ADA) is up 4% on Monday, trying to hit $0.65, showing signs of renewed bullish momentum. Technical indicators are beginning to align in favor of buyers, with the BBTrend turning positive for the first time in days and the DMI signaling strengthening upward pressure.
ADA is also nearing a potential golden cross formation on its EMA lines, which could further support a breakout if resistance levels are cleared. With momentum building and key levels in sight, Cardano is entering a critical zone that could define its short-term direction.
Cardano Shows Early Signs of Recovery as BBTrend Turns Positive
Cardano BBTrend has just flipped back into positive territory at 0.11, following four straight days in the negative zone. This shift, though subtle, may be the first sign of momentum stabilizing after recent weakness.
BBTrend, or Bollinger Band Trend, is a technical indicator that gauges the strength and direction of a trend based on how wide or narrow the Bollinger Bands are.
When the bands begin to expand and BBTrend moves into positive values, it often suggests growing volatility in favor of an emerging bullish trend. On the other hand, prolonged negative readings typically signal fading momentum and a lack of directional strength.
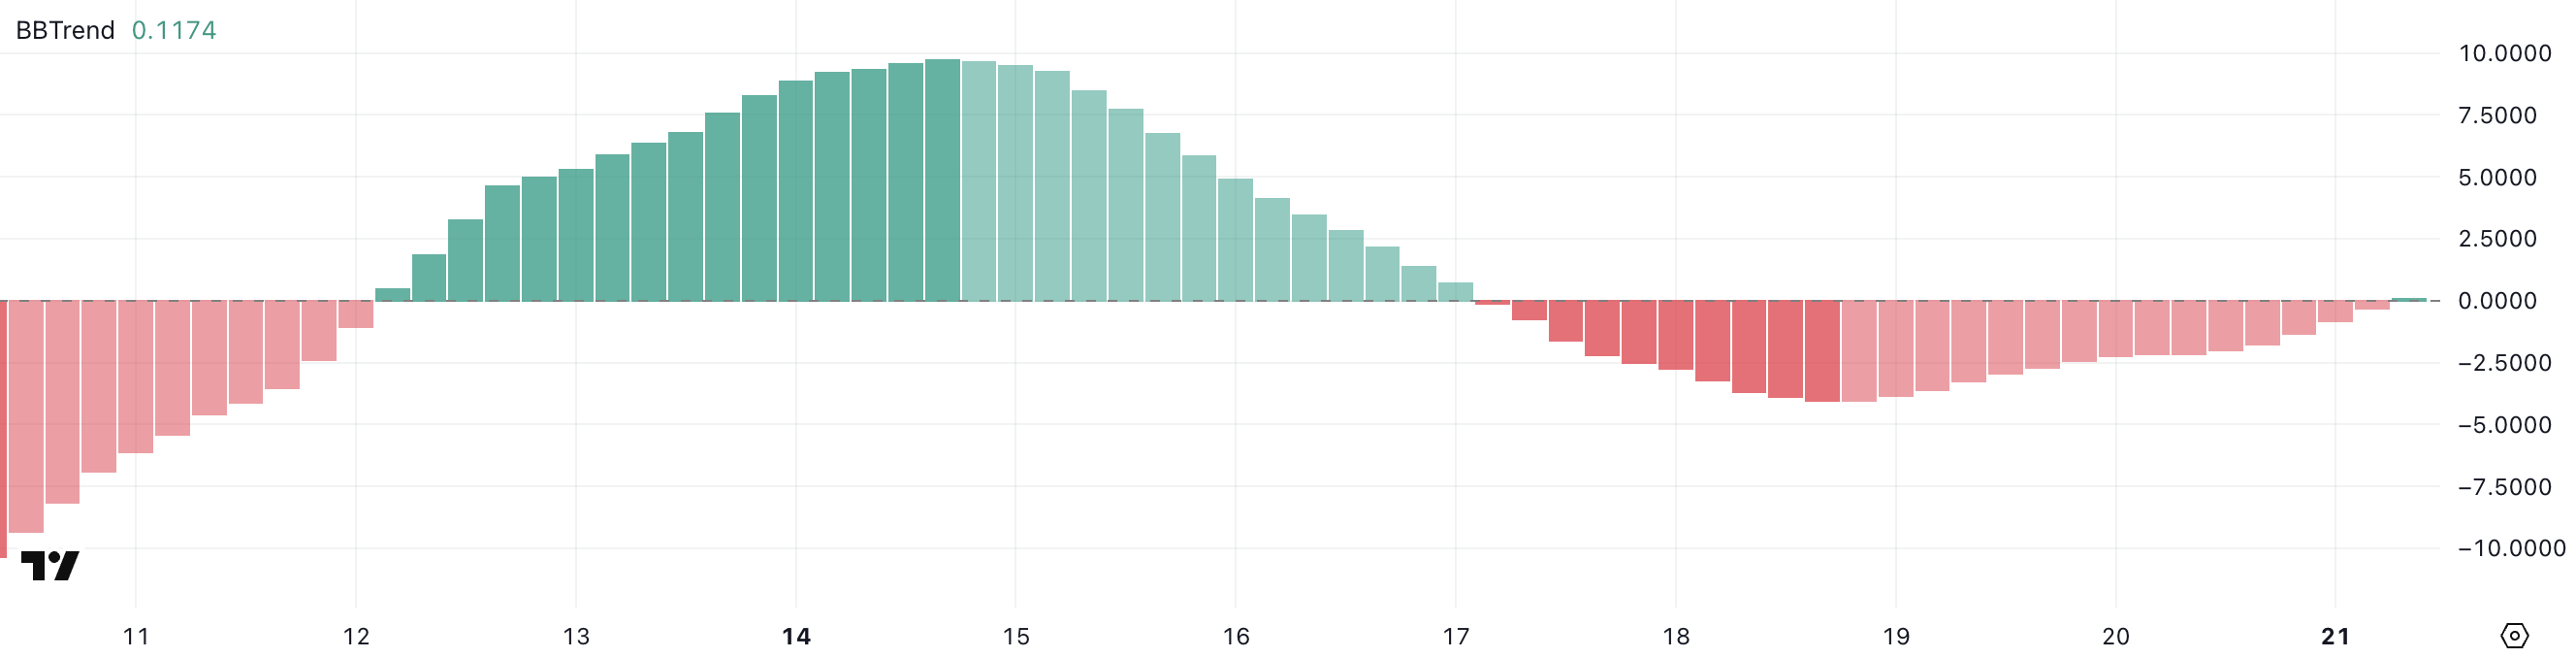
While a BBTrend of 0.11 is still low and not yet signaling a strong uptrend, the fact that it turned positive marks a potential inflection point.
It suggests that selling pressure may be fading and the price could be entering a recovery phase if buying activity increases. This early uptick in BBTrend often precedes a broader move.
Traders will likely be watching closely to see if this positive shift is sustained in the coming sessions, as continued gains in BBTrend could indicate the beginning of a more defined upward move for ADA.
Cardano Buyers Regain Control as Uptrend Shows Early Strength
Cardano Directional Movement Index (DMI) is showing a notable shift in momentum, with its Average Directional Index (ADX) climbing to 17.79, up from 13.77 yesterday.
The ADX measures the strength of a trend, regardless of its direction, on a scale from 0 to 100. Values below 20 suggest a weak or non-existent trend, while readings above 25 typically confirm that a trend is gaining strength.
ADA’s ADX is still below the 20 threshold but rising steadily—indicating that momentum is building and a stronger directional move could soon take shape.

Looking deeper, the +DI (positive directional indicator) has jumped to 26.38 from 16.30 just a day ago, signaling increased buying pressure. Although it has slightly pulled back from an earlier peak at 29.57, it remains firmly above the -DI (negative directional indicator), which has dropped significantly from 22.72 to 13.73.
This widening gap between the +DI and -DI suggests a clear shift in favor of bulls, with buyers regaining control after a brief period of selling pressure.
If the ADX continues to rise alongside a dominant +DI, it could confirm a strengthening uptrend for Cardano.
Cardano Nears Golden Cross as Bulls Eye Breakout—but Key Support Still in Play
Cardano price is approaching a potentially bullish technical development, as its EMA lines suggest a golden cross may form in the coming sessions.
A golden cross occurs when the short-term moving average crosses above the long-term moving average, often signaling the start of a stronger uptrend.
If this crossover is confirmed and ADA manages to break above the resistance at $0.668, the next upside targets sit at $0.709 and $0.77—levels not seen since late March.
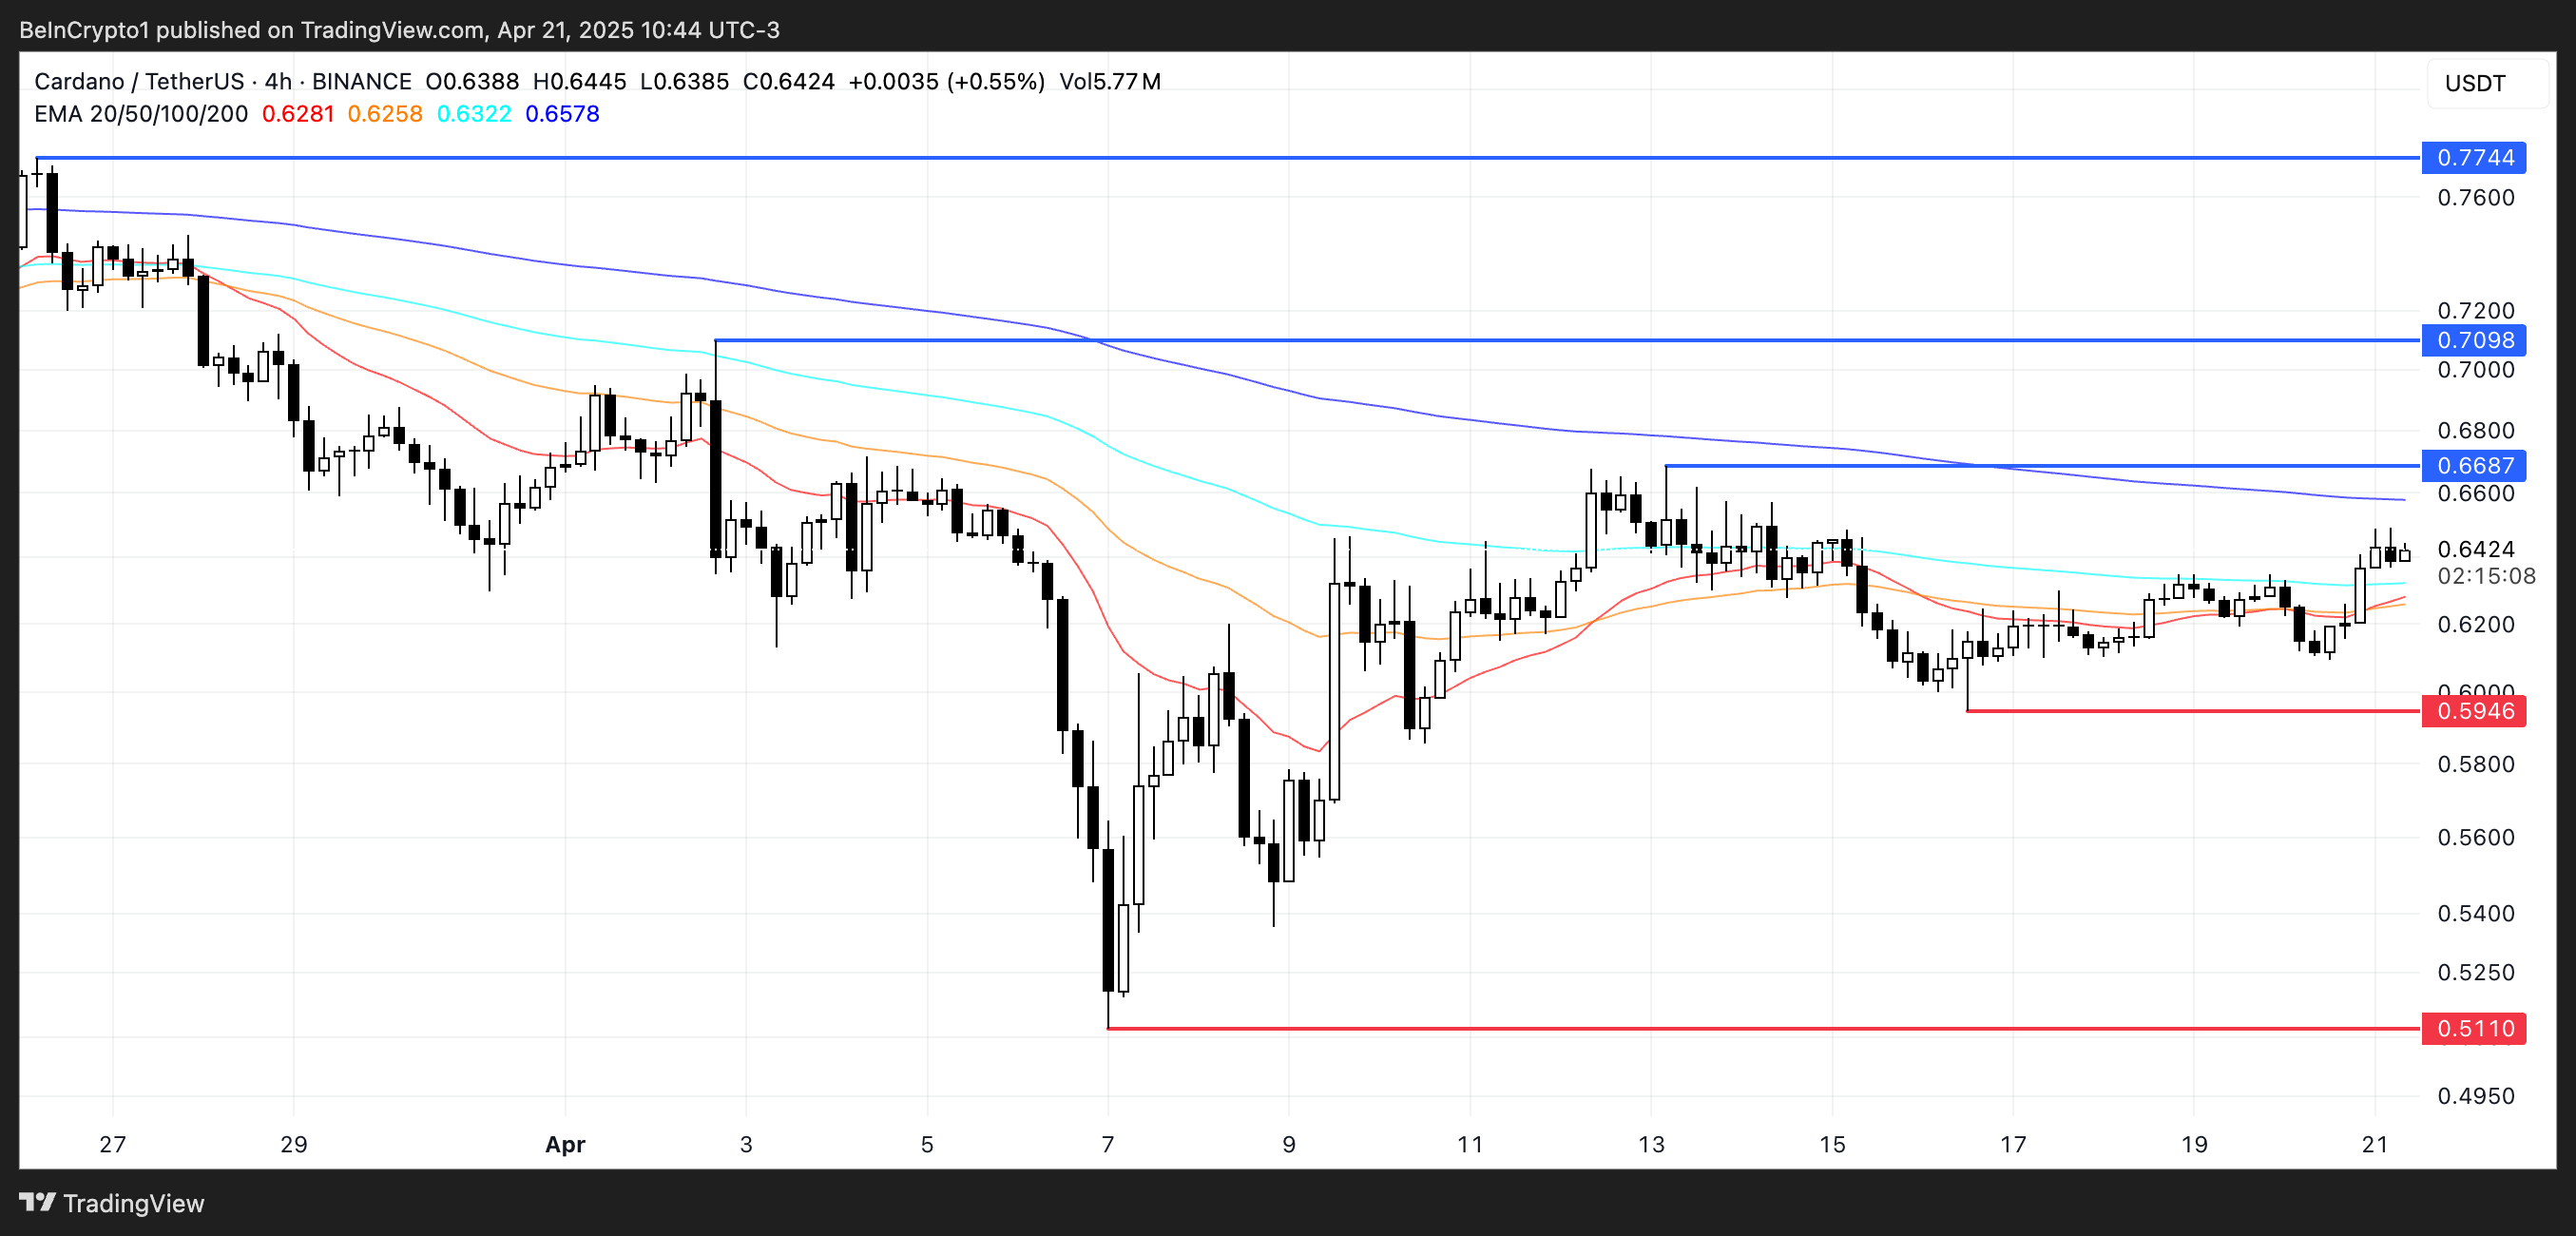
However, if ADA fails to maintain its upward trajectory and the momentum fades, downside risks remain in play.
A drop back toward the $0.594 support would be the first sign of weakness, and a breakdown below that level could expose the asset to deeper losses, with $0.511 as the next key support zone.
Price action around the $0.668 resistance will likely be the deciding factor.
Disclaimer
In line with the Trust Project guidelines, this price analysis article is for informational purposes only and should not be considered financial or investment advice. BeInCrypto is committed to accurate, unbiased reporting, but market conditions are subject to change without notice. Always conduct your own research and consult with a professional before making any financial decisions. Please note that our Terms and Conditions, Privacy Policy, and Disclaimers have been updated.
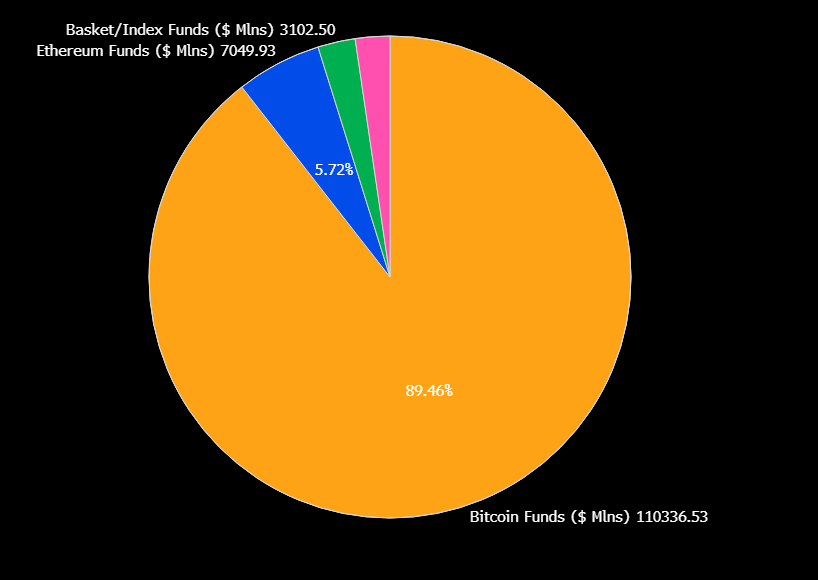
As the SEC is signaling its willingness to approve new altcoin ETFs, 72 active proposals are awaiting a nod. Despite the growing interest from asset managers to launch more altcoin-based products in the institutional market, Bitcoin ETFs currently command 90% of crypto fund assets worldwide.
New listings can attract inflows and liquidity in these tokens, as demonstrated by Ethereum’s approval of ETF options. Still, given the current market interest, it’s highly unlikely that any crypto found will replicate Bitcoin’s runaway success in the ETF market
Bitcoin Dominates the ETF Market
Bitcoin ETFs dramatically changed the global digital assets market over the past month, and they are performing quite well at the moment. In the US, total net assets have reached $94.5 billion, despite continuous outflows in the past few months.
Their impressive early success opened a new market for crypto-related assets, and issuers have been flooding the SEC with new applications since.
This flood has been so intense that there are currently 72 active proposals for the SEC’s consideration:
“There are now 72 crypto-related ETFs sitting with the SEC awaiting approval to list or list options. Everything from XRP, Litecoin and Solana to Penguins, Doge and 2x MELANIA and everything in between. Gonna be a wild year,” claimed ETF analyst Eric Balchunas.
The US regulatory environment has become much friendlier toward crypto, and the SEC is signaling its willingness to approve new products. Many ETF issuers are attempting to seize the opportunity to create a product as successful as Bitcoin.
However, Bitcoin has a sizable head start, and it’s difficult to imagine any newcomer disrupting its 90% market share.
To put that into perspective, BlackRock’s Bitcoin ETF was declared “the greatest launch in ETF history.” Any new altcoin product would need a significant value-add to encroach upon Bitcoin’s position.
Recent products like Ethereum ETF options have attracted fresh liquidity. Yet, Bitcoin’s dominance in the institutional market remains unchanged.
Of these 72 proposals, only 23 refer to altcoins other than Solana, XRP, or Litecoin, and many more concern new derivatives on existing ETFs.
Some analysts claim that these products, taken together, couldn’t displace more than 5-10% of Bitcoin’s ETF market dominance. If an event significantly disrupted Bitcoin, it would also impact the rest of crypto.
Still, that doesn’t mean that the altcoins ETFs are a futile endeavor. These products have continually created new inflows and interest in their underlying assets, especially with issuers acquiring token stockpiles.
However, it’s important to be realistic. While XRP and Solana ETF approvals could drive new bullish cycles for the altcoin market, Bitcoin will likely dominate the ETF market by a large margin — given its widespread recognition as a ‘store of value’.
Disclaimer
In adherence to the Trust Project guidelines, BeInCrypto is committed to unbiased, transparent reporting. This news article aims to provide accurate, timely information. However, readers are advised to verify facts independently and consult with a professional before making any decisions based on this content. Please note that our Terms and Conditions, Privacy Policy, and Disclaimers have been updated.

Ethereum to Emphasize Layer-1 Efficiency and UX in Upcoming Protocol Upgrades

XRP Surpasses Ethereum In This Major Metric After Outperforming For 6 Months

PumpFun Moves $13M SOL To Kraken as Solana Price Consolidates, What Next?

Cardano (ADA) Jumps 4% as Bullish Signals Emerge

Ark Invest Gains First Exposure to Solana With 3iQ ETF Bet

Bitcoin ETFs Dominate Market Despite 72 Altcoin Proposals

2.52 Million Altcoins Are Ruining Crypto’s Future

Animoca Brands Valuation Tanks 75% In Two Years, Here’s Why

Crypto exchange BingX hacked for $43 million

Are The Big Players Losing Interest?

Hong Kong’s Securities Association Tips Authorities On Crypto Self-Regulation

Coinbase cbBTC Set to go Live on Solana
2.52 Million Altcoins Are Ruining Crypto’s Future
Animoca Brands Valuation Tanks 75% In Two Years, Here’s Why
Crypto exchange BingX hacked for $43 million
Are The Big Players Losing Interest?
Hong Kong’s Securities Association Tips Authorities On Crypto Self-Regulation
Coinbase cbBTC Set to go Live on Solana
-
 Bitcoin19 hours ago
US Economic Indicators to Watch & Potential Impact on Bitcoin
-

 Market21 hours ago
Bitcoin Price Breakout In Progress—Momentum Builds Above Resistance
-
 Altcoin16 hours ago
Expert Reveals Why BlackRock Hasn’t Pushed for an XRP ETF
-

 Altcoin21 hours ago
Expert Says Solana Price To $2,000 Is Within Reach, Here’s How
-

 Market19 hours ago
Solana Rallies Past Bitcoin—Momentum Tilts In Favor of SOL
-

 Market18 hours ago
Vitalik Buterin Proposes to Replace EVM with RISC-V
-

 Market15 hours ago
Ethereum Price Clings to Support—Upside Break Could Trigger Rally
-

 Ethereum8 hours ago
Ethereum Analyst Sets $3,000 Target As Price Action Signals Momentum – Details