
Market
Hedera (HBAR) Surges 30%, Faces Key Resistance Level

Hedera (HBAR) has surged more than 6% in the last 24 hours, bringing its market cap to $10.6 billion. With its price up nearly 30% over the past week, HBAR stands out as one of the top-performing altcoins among the largest in the market.
This strong rally has pushed key technical indicators into bullish territory, with BBTrend reaching its highest level in over a month and the Ichimoku Cloud structure showing sustained upward momentum. If HBAR maintains this strength, it could soon test critical resistance levels, with the potential to surpass $0.35 in March.
Hedera BBTrend Is On Its Highest Levels In More Than a Month
Hedera BBTrend is currently at 18.15, maintaining a positive stance for over a day. Earlier today, it reached a peak of 21.3, marking its highest level since late January.
While it has pulled back slightly from that peak, the indicator remains elevated, suggesting that the recent uptrend is still intact.
This sustained positivity in BBTrend indicates strong directional momentum in HBAR’s price action, aligning with broader market trends.
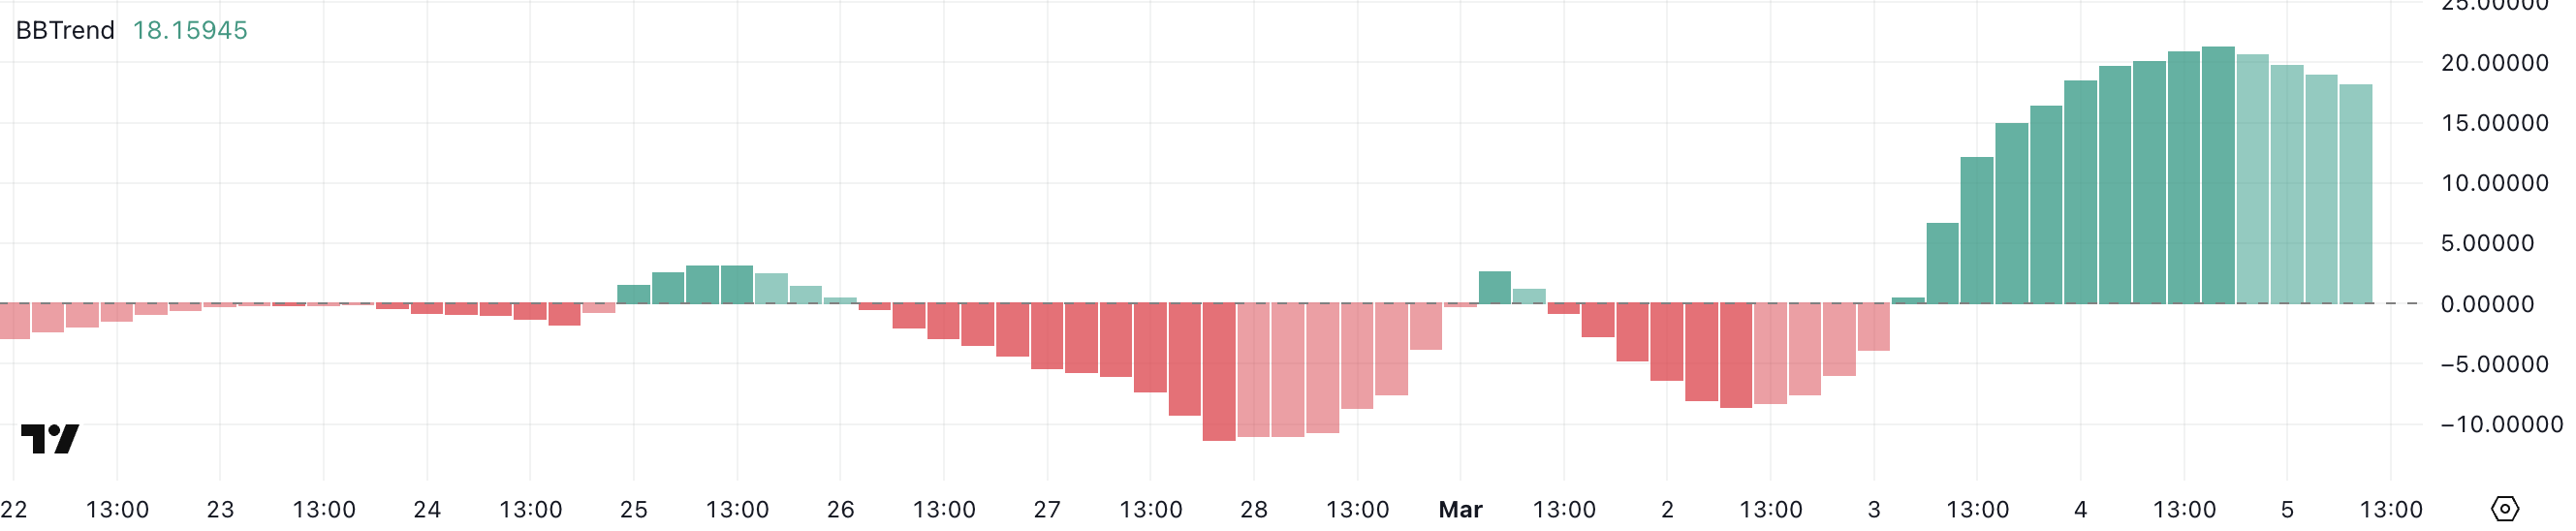
BBTrend, or Bollinger Band Trend, is a technical indicator that measures trend strength based on the relationship between price and Bollinger Bands. When BBTrend is positive, it suggests that the price is trading in the upper portion of the Bollinger Bands, often signaling an ongoing bullish trend.
In HBAR’s case, the current level of 18.15 – while lower than its earlier peak of 21.3 – still reflects a strong upward bias. If this trend remains elevated, it could indicate continued bullish momentum for HBAR, but the slight pullback from 21.3 suggests some moderation in buying pressure.
Whether this leads to consolidation or further upside will depend on market follow-through and broader sentiment shifts.
HBAR Ichimoku Cloud Shows a Bullish Setup
According to the Ichimoku Cloud, Hedera is currently positioned in a bullish structure. The price is trending above the blue conversion line and the red baseline, indicating short-term bullish momentum.
The green leading span A is sloping upward, while the orange leading span B remains relatively steady, forming an ascending cloud that suggests growing support. Additionally, the lagging span (green line) is above the price from 26 periods ago, reinforcing the strength of the ongoing trend.
However, the price is consolidating just above the red baseline, signaling a potential decision point between continuation or a short-term pullback.
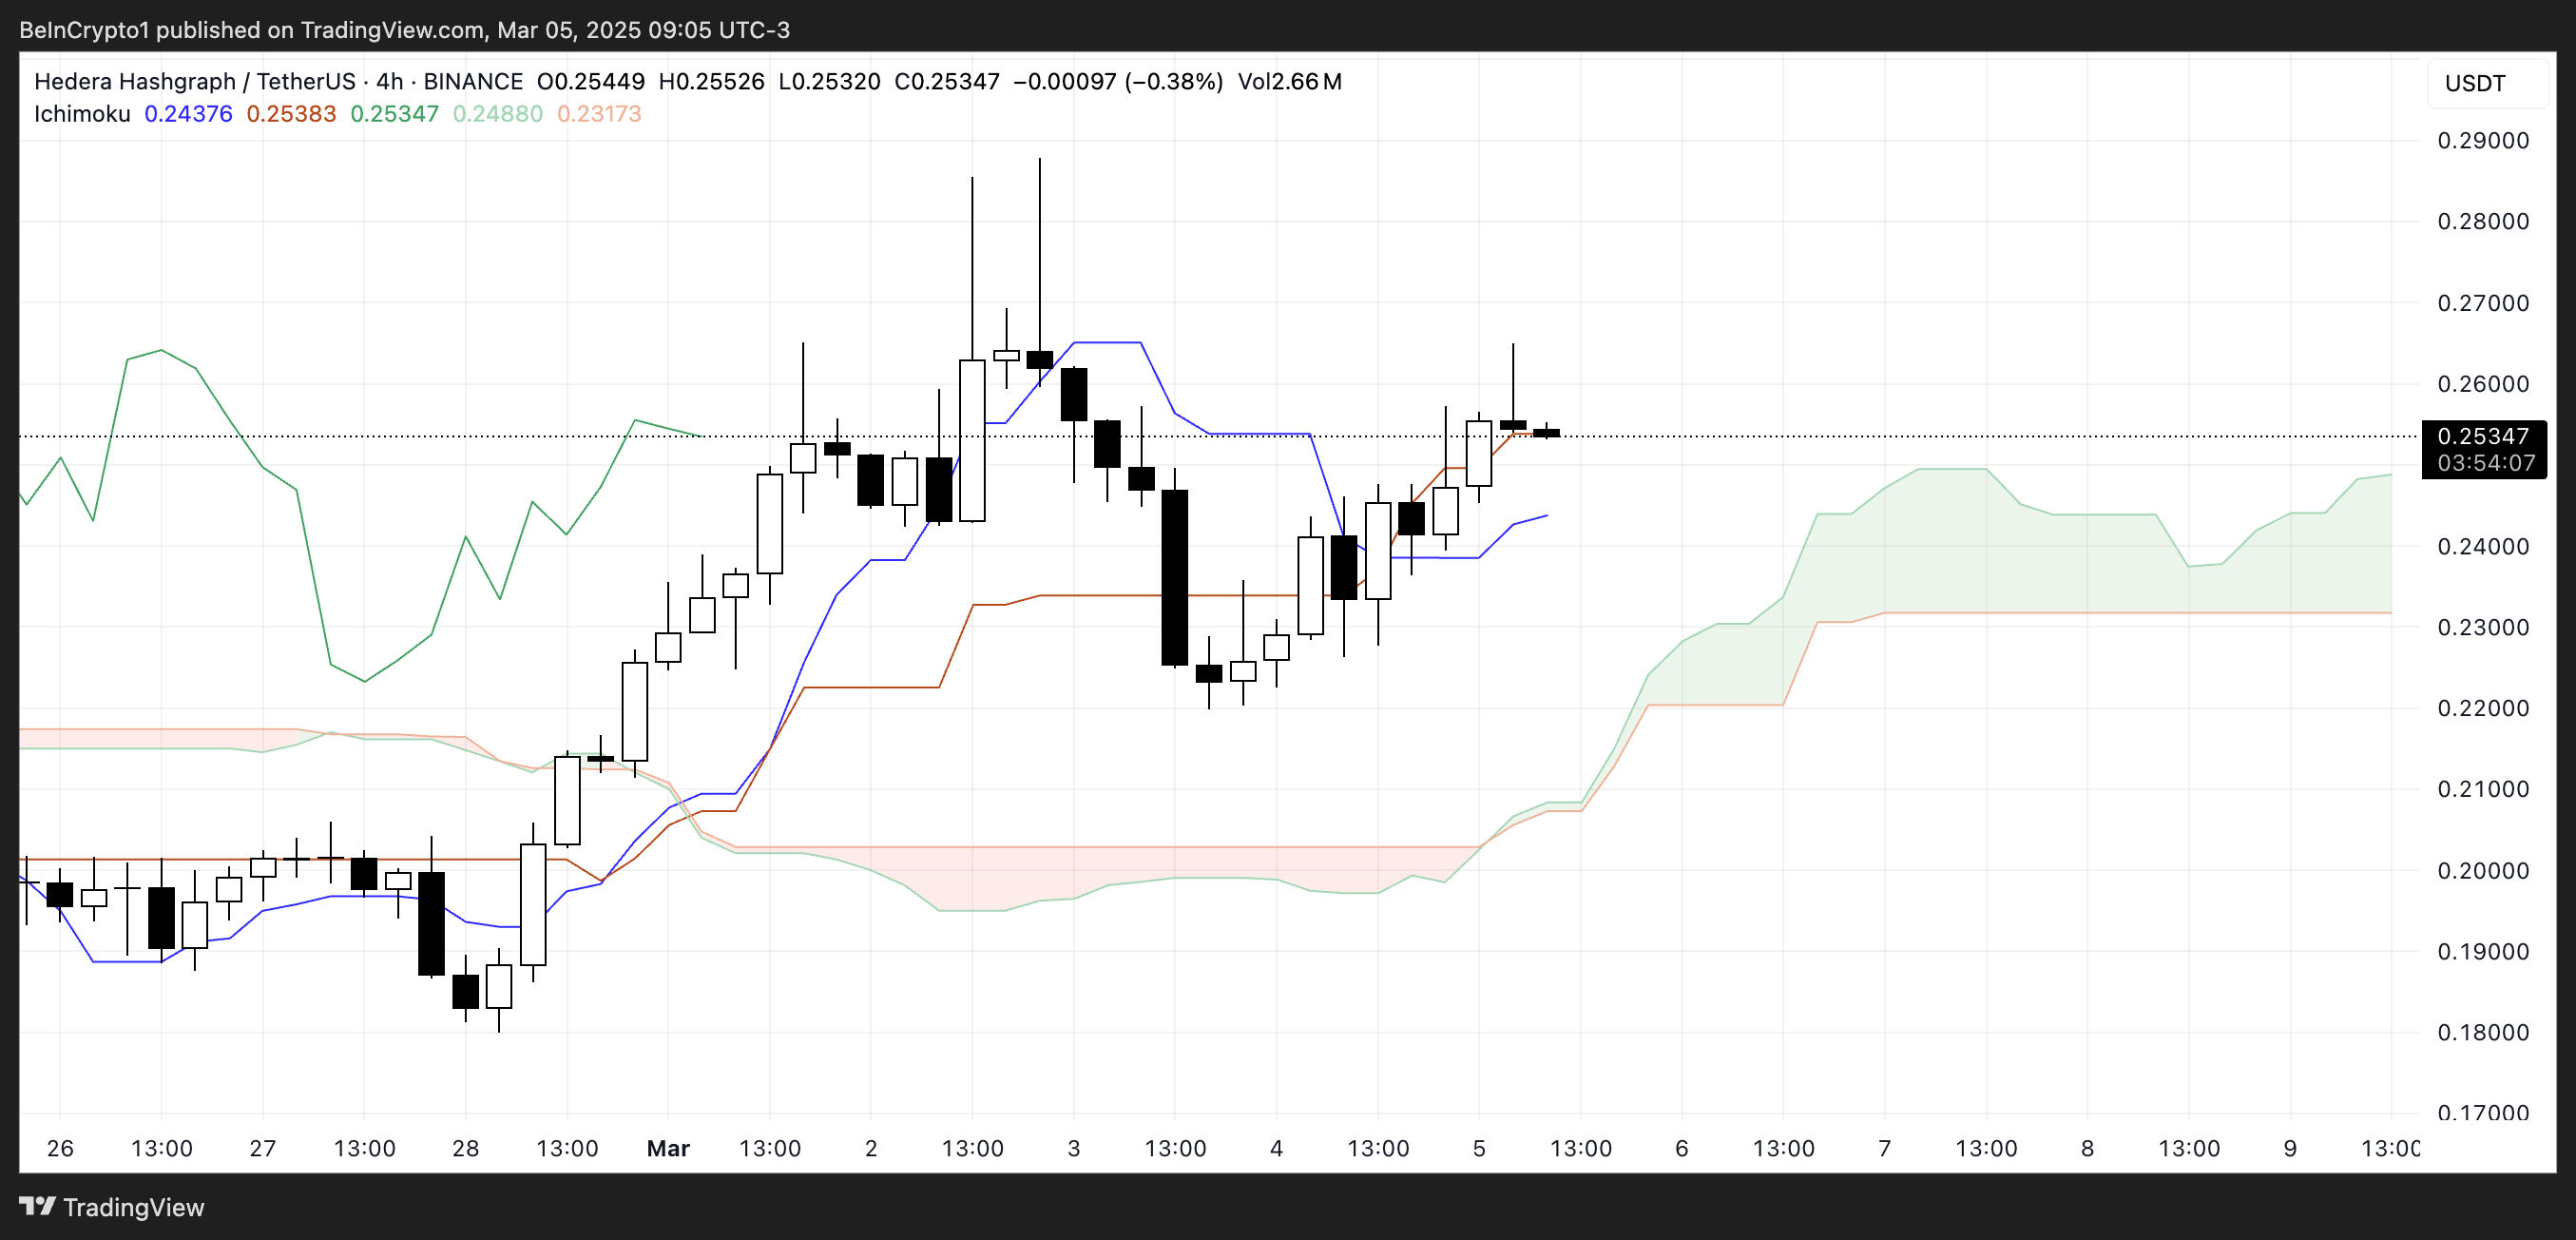
The Ichimoku Cloud provides a multi-faceted view of trend direction and key support-resistance zones. When the price is above the cloud, it signals a dominant bullish trend, while movement below would indicate a shift in sentiment.
The current positioning above both the blue conversion line and red baseline suggests that bullish momentum is intact. If the price maintains this structure, further upside could be expected, especially as the green leading span A continues to rise.
However, a drop below the red baseline would indicate weakening momentum, potentially leading to a test of the cloud’s support region. The thickness of the cloud ahead suggests a moderate support zone, meaning any pullback would face resistance before shifting the overall trend.
Hedera (HBAR) Could Surpass $0.35 In March
Hedera EMA lines indicate a bullish trend, with a golden cross forming yesterday and the possibility of another one soon. A golden cross occurs when a shorter-term EMA crosses above a longer-term EMA, signaling strong upward momentum.
If this setup continues, HBAR could test the next resistance at $0.28. A breakout above this level could open the path for a move toward $0.322.
If buying pressure intensifies and Hedera price regains the strong uptrend seen in previous months, it could push further to test $0.35 and $0.37. In an extended rally, HBAR might even rise above $0.40 for the first time since November 2021, marking a significant recovery.
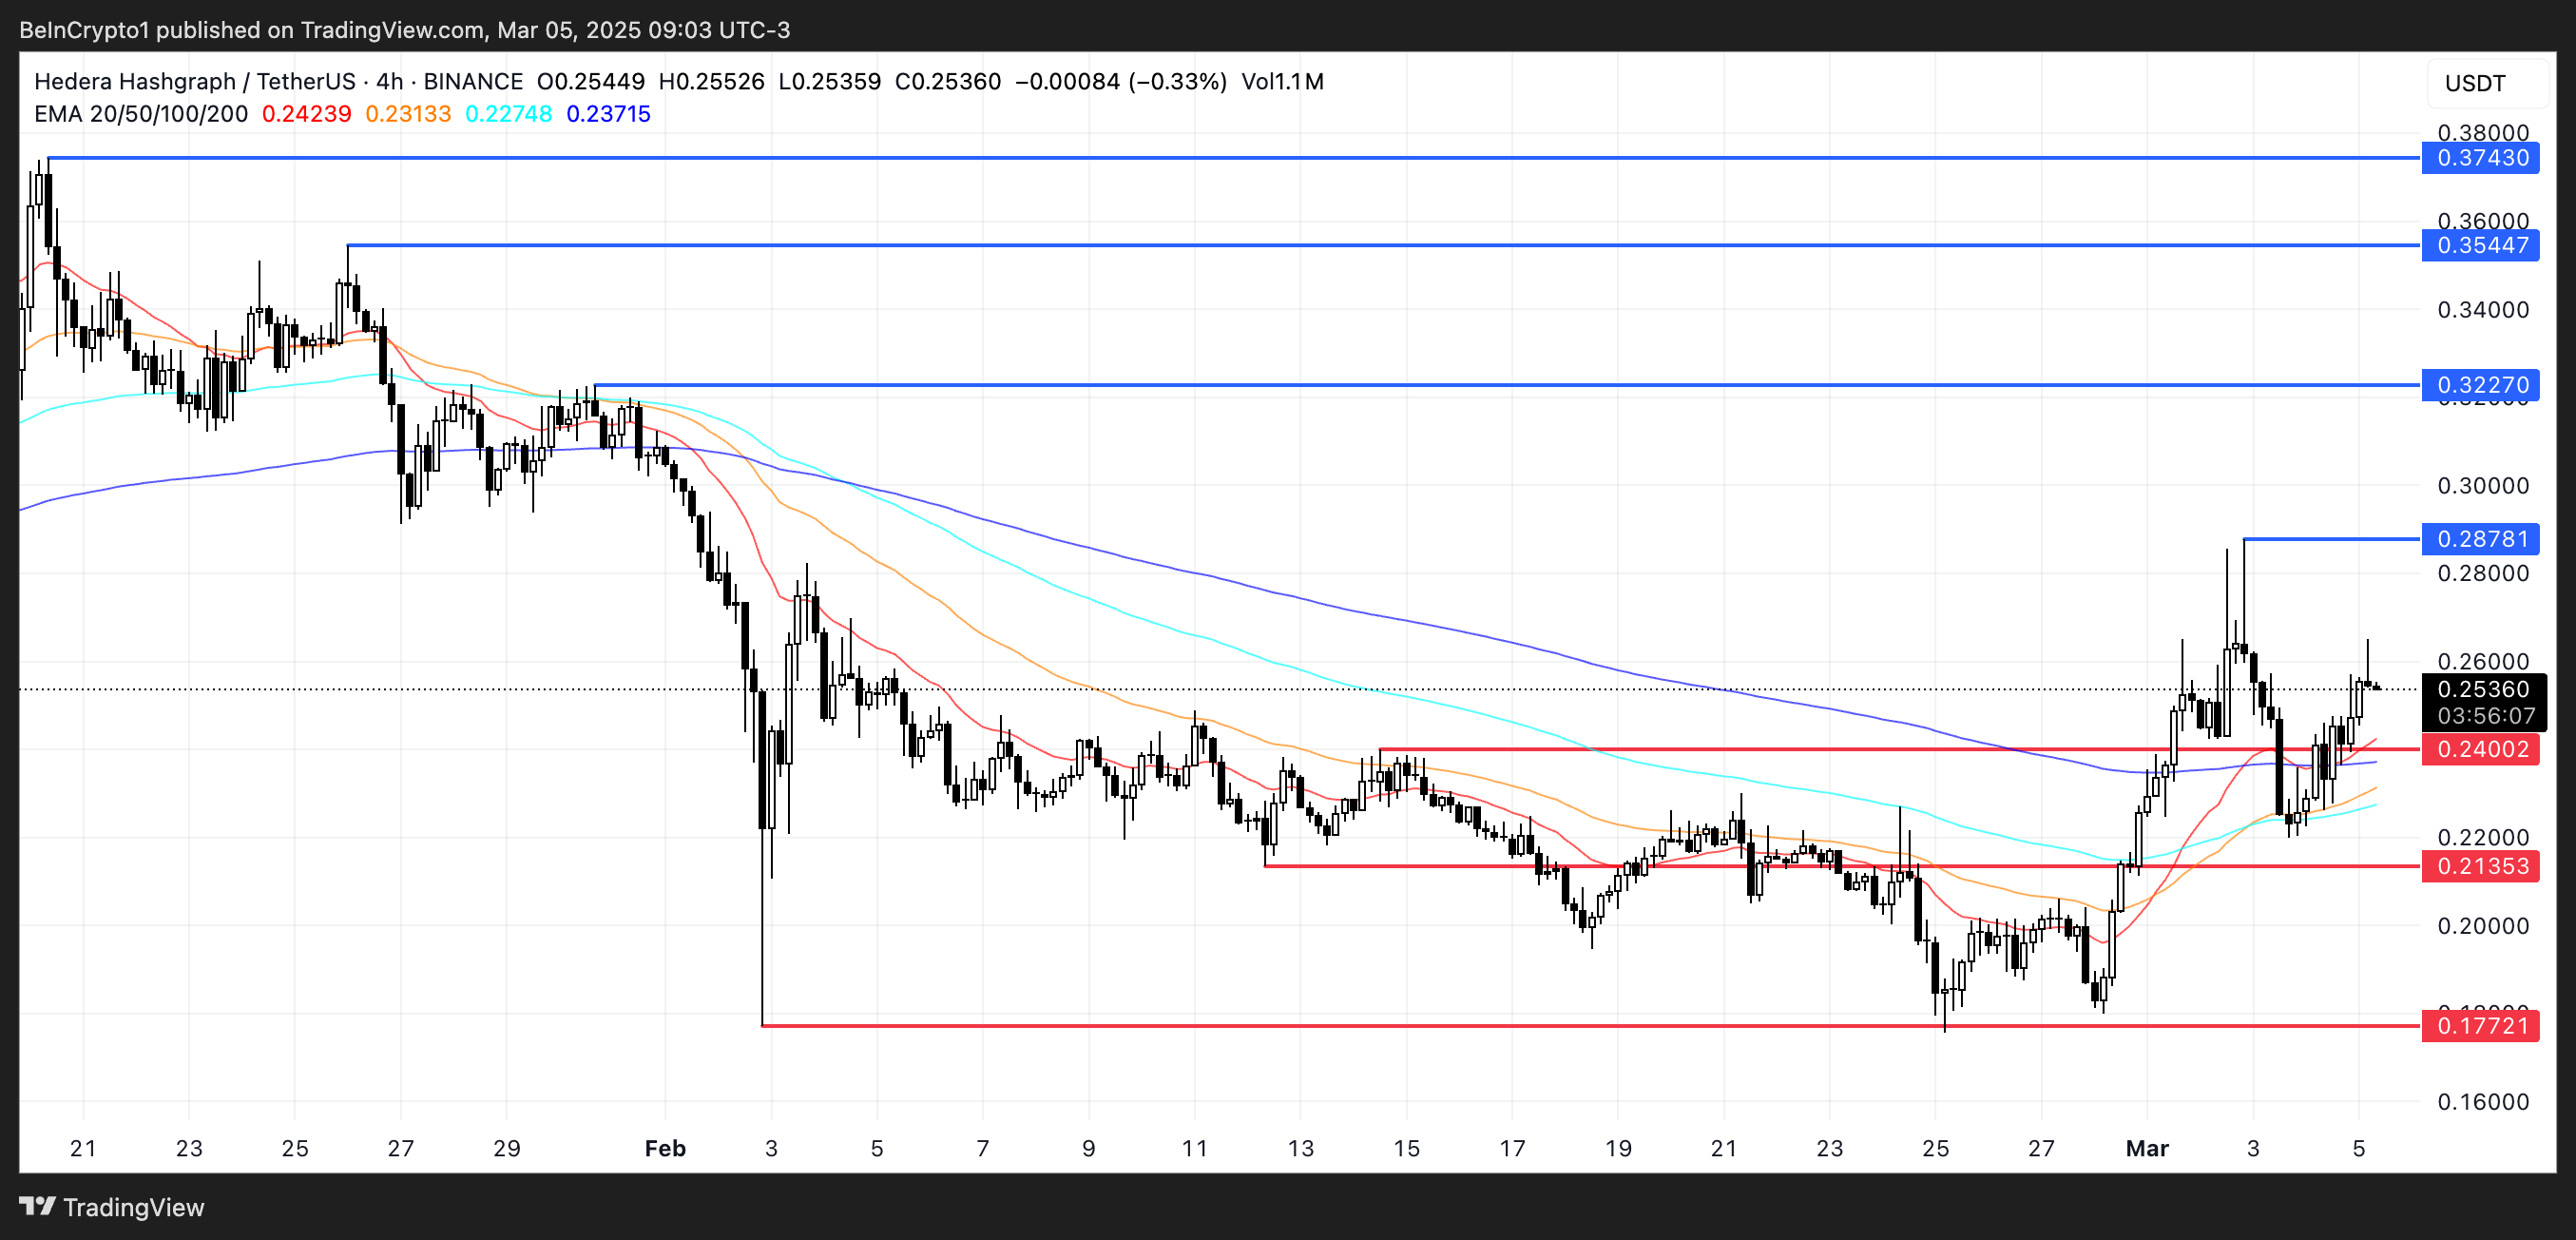
On the other hand, if the uptrend fails to materialize, HBAR could face a retest of the $0.24 support level.
Losing this support would indicate a weakening structure, potentially leading to a decline toward $0.213.
If bearish momentum intensifies and buying interest does not return, Hedera could drop further to $0.177, testing deeper support zones.
Disclaimer
In line with the Trust Project guidelines, this price analysis article is for informational purposes only and should not be considered financial or investment advice. BeInCrypto is committed to accurate, unbiased reporting, but market conditions are subject to change without notice. Always conduct your own research and consult with a professional before making any financial decisions. Please note that our Terms and Conditions, Privacy Policy, and Disclaimers have been updated.


At this week’s series of Web3 events in Hong Kong, industry leaders are highlighting real world asset (RWA) tokenization as a pivotal evolution in blockchain’s journey toward mainstream adoption.
“This is the perfect time for our whole industry,” said Shukyee Ma, Chief Strategy Officer of Plume, during an exclusive interview. “After last year’s disappointment with DeFi yields, users are looking for something new, and we have the tokenized assets ready.”
Read more: The Impact of Real World Asset (RWA) Tokenization
Purpose-Built Blockchains Leading the Way
A key trend emerging from the discussions is the development of purpose-built blockchains specifically designed for RWAs, rather than using existing general-purpose chains.
“All those public chains are not built for RWA protocols,” explained Ma. “That’s why we build this RWA chain and put DeFi composability on top of it to make it easier for crypto users to adopt.”
“Over the next 10 years we’re going to see a lot of existing fungible assets coming on chain—US treasuries, sovereign bonds, equities,” predicted Jayant Ramanand, Co-founder of MANTRA. “As these assets come on chain, you’ll have fungible, movable value that can be transferred across the world instantly.”
Regulatory Challenges and Opportunities
Industry professionals identified regulatory certainty as vital for widespread adoption.
“In order to further unlock the potential of this technology and encourage traditional finance to adopt it, we issued circulars to provide guidance,” said Elizabeth Wong, Director of Fintech at Hong Kong’s Securities and Futures Commission. “We maintained it to be agnostic to the technology used, as each blockchain has their benefits and limitations.”
Vivian Mei, a lawyer specializing in RWA compliance, observed that global regulatory frameworks are becoming increasingly aligned: “The overall regulatory landscape is moving toward high convergence in terms of virtual asset definitions, KYC requirements, and compliance standards.”

George Chou, Chief Fintech Officer at Hong Kong Monetary Authority, highlighted their Project Ensemble initiative: “We want to explore an innovative market infrastructure with the industry to facilitate settlement using tokenized money, and identify impactful domestic and cross-border use cases with leading experts and industry pioneers.”
Bridging Traditional Finance with Crypto
“It’s not just simply bringing offline assets on-chain. It’s providing a structural change in how the real world and virtual world connect,” said JJ from The PAC, whose platform recently tokenized a quantitative fund with approximately $100 million in assets.
While financial assets will lead early adoption, Rachel Keum, CEO of VaultX, offers a different approach with her platform tokenizing art assets using NFC technology: “Our mission is to revolutionize RWA ownership by empowering digital-illiterate creators and collectors to unlock new value in the digital economy.” She explained that VaultX had already launched partnerships with galleries across Asia and Europe, creating a decentralized marketplace for artists to receive ongoing royalties from secondary sales.
Consumer-focused applications are also emerging. “The real distribution is never for institutional investors—it’s for the people,” said EudemoniaCC from Morph, whose Black Card quickly gained popularity. “We’re trying to put payment and consumption at the center, letting people spend their crypto assets in the real world while bringing new audiences into the ecosystem.”
Disclaimer
In adherence to the Trust Project guidelines, BeInCrypto is committed to unbiased, transparent reporting. This news article aims to provide accurate, timely information. However, readers are advised to verify facts independently and consult with a professional before making any decisions based on this content. Please note that our Terms and Conditions, Privacy Policy, and Disclaimers have been updated.

Binance Research published its report on Trump’s tariffs and how they might impact the crypto market. It noted that the riskiest investments suffered the most, while RWAs and exchanges suffered the least.
Additionally, the perceived risk associated with Bitcoin increased, thanks to its new correlation with stock markets. Only 3% of its polled investors considered it their preferred asset class in the event of a trade war.
Binance Research Analyzes Tariffs
Binance Research, a subsidiary of the world’s largest crypto exchange, has been heavily exploring industry trends in 2025. Most recently, it reported significant gaps in latest crypto airdrops and distribution models.
Today, Binance Research produced its newest report, which concerns US tariffs.
President Trump’s proposed tariffs are particularly relevant to Binance, as they’ve had an outsized impact on the crypto market. The report notes that these will be the US’ most stringent tariffs since the 1930s, driving fears of stagflation and a global trade war.
Binance Research analyzed different crypto-related assets to determine their risks:

The claims are backed up by today’s market moves. For example, Ethereum fell to March 2023 levels, while MANTRA’s OM token rose after it announced a major RWA fund.
Apparently, RWAs are the crypto market sector that faces the lowest risks from tariffs. The report notes that the most vulnerable sectors are those perceived as the riskiest, such as meme coins and AI.
Both the AI tokens and meme coins sectors have dropped more than 50% since the tariff announcements, while RWA tokens have lost only 16%. Exchange-based tokens only dipped by 18%.
Binance Research further claims that only 3% of FMS investors view Bitcoin as their preferred asset class in the event of a trade war. Although one of the most popular narratives about Bitcoin is that it can hedge against inflation, this new correlation may impact that characteristic.
“Macroeconomic factors — particularly trade policy and rate expectations — are increasingly driving crypto market behavior, temporarily eclipsing underlying demand dynamics. Whether this correlation structure persists will be key to understanding Bitcoin’s longer-term positioning and diversification value,” Binance Research claimed.
Ultimately, the report identified a lot of factors that could seriously influence the crypto market. A few of the other factors include trade war escalation, rising inflation, Federal Reserve policy, and crypto-specific developments.
“The risk-off response to the reciprocal tariff announcement has seen the S&P 500 lose over $5 trillion in two trading days. Over the past 44 trading sessions, the US stock market has lost over $11 trillion, a figure that accounts for about 38% of the entire country’s GDP. Trump’s tariff policies have intensified recession fears, with JP Morgan raising the odds to 60%,” Fakhul Miah, the Managing Director GoMining Institutional told BeInCrypto.
Overall, the key takeaway is that many variables are in play right now, but it’s still very possible to pick a safe option despite this chaos. Blockchain projects driven by utility and long-term development seem to be the safest option in the current volatile ecosystem.
Disclaimer
In adherence to the Trust Project guidelines, BeInCrypto is committed to unbiased, transparent reporting. This news article aims to provide accurate, timely information. However, readers are advised to verify facts independently and consult with a professional before making any decisions based on this content. Please note that our Terms and Conditions, Privacy Policy, and Disclaimers have been updated.
Reason to trust
![]()
Strict editorial policy that focuses on accuracy, relevance, and impartiality
Created by industry experts and meticulously reviewed
The highest standards in reporting and publishing
Strict editorial policy that focuses on accuracy, relevance, and impartiality
Morbi pretium leo et nisl aliquam mollis. Quisque arcu lorem, ultricies quis pellentesque nec, ullamcorper eu odio.
Amidst ongoing market instability and volatility, the XRP price maintained support levels, even as many altcoins crashed this past week. A well-known crypto pundit has spotlighted a critical resistance level at $2.3, saying that XRP’s next move will largely depend on whether it can successfully break through this barrier.
XRP Price At $2.3: A Make Or Break Point
According to AMCrypto, an analyst on X (formerly Twitter), XRP had been maintaining strong support at $2. Compared to other altcoins that experienced severe price crashes earlier this year, XRP was one of the few that didn’t fall below the February capitulation price.
Related Reading
The $2 price level was a key support zone that acted as a barrier for XRP, as buyers stepped in to prevent further price decline. Notably, XRP had been consolidating just above this point for the past few months, showing immense resilience amid broader market volatility driven by news of the United States (US) tariff plans. However, recently XRP has dropped below $2 and is now trading at $1.68.
AMCrypto has shared a price chart, highlighting that XRP recently broke out of a Descending Triangle pattern — a formation usually associated with strong price moves. However, for this breakout to have real momentum, the altcoin must push past the critical resistance level at $2.3.

If XRP manages to clear this resistance level, the analyst predicts that its price could experience a rapid push toward the $3.00 – $3.20 region, marking new highs. Looking at the analyst’s price chart, historically, the token has experienced two strong breakouts from similar Descending Triangles. The most recent triangle saw XRP break above the $2.3 resistance zone with strong bullish candles.
AMCrypto has warned that without a decisive breakout above the $2.3 resistance, XRP’s price action will likely remain confined in a wider consolidation range. This does not bode well for a short-term momentum, as it would limit further upward movement for the cryptocurrency until stronger bullish confirmation emerges.
Analyst Predicts Price Crash To $0.6
The XRP price appears to be mirroring the broader market’s bearish trend, plunging by approximately 20% in the last 24 hours, according to CoinMarketCap. The cryptocurrency has also declined by 30% over the past month, highlighting sustained downward pressure and waning investor confidence.
Related Reading
In a recent post on X, crypto analyst Jesse Colombo pointed out XRP’s recent breakdown below key support zones, warning that the cryptocurrency is likely headed for an even deeper price crash to $0.6. The analyst highlighted the formation of a Head and Shoulder pattern on the price chart, a classic bearish reversal signal that often precedes a significant downward move.
With XRP’s price currently trading at $1.68, a decline to $0.6 would represent a significant 64% decrease. Notably, AMCrypto has identified new support levels between $2 and $2.2, indicating that a rebound to this range could act as a critical barrier against further downside for the altcoin.
Featured image from Adobe Stock, chart from Tradingview.com

RWA Tokenization Takes Center Stage in Hong Kong

Solana’s Fartcoin Jumps 20% Despite Market Selloff

RWA Tokens Outperform Bitcoin During Tariffs
Programmer Reveals Reason To Be Bullish On Pi Network Despite Pi Coin Price Crash

Crypto Pundit Reveals What Will Happen If XRP Price Does Not Break $2.3
Ripple Whale Moves $355 Million To Binance, XRP Price To Dip Further?

2.52 Million Altcoins Are Ruining Crypto’s Future

Animoca Brands Valuation Tanks 75% In Two Years, Here’s Why

Crypto exchange BingX hacked for $43 million

Are The Big Players Losing Interest?

Hong Kong’s Securities Association Tips Authorities On Crypto Self-Regulation

Coinbase cbBTC Set to go Live on Solana
2.52 Million Altcoins Are Ruining Crypto’s Future
Animoca Brands Valuation Tanks 75% In Two Years, Here’s Why
Crypto exchange BingX hacked for $43 million
Are The Big Players Losing Interest?
Hong Kong’s Securities Association Tips Authorities On Crypto Self-Regulation
Coinbase cbBTC Set to go Live on Solana
-

 Market18 hours ago
Ethereum Price Tanks Hard—Can It Survive the $1,500 Test?
-

 Market22 hours ago
Solana (SOL) Freefall—Can It Hold Above The $100 Danger Zone?
-
 Bitcoin19 hours ago
$1 Billion in Liquidations Over the Weekend
-
 Market19 hours ago
Solana (SOL) Price Falls Below $100, Crashes To 14-Month Low
-
 Bitcoin17 hours ago
Will 2025’s Crypto Market Mirror 2020’s Rebound? Analysts Predict
-

 Market16 hours ago
Bitcoin Price Crashes Hard—Is The Selloff Just Getting Started?
-

 Market11 hours ago
Is $0.415 the Key to Further Gains?
-

 Bitcoin15 hours ago
5 US Economic Events With Crypto Market Implications This Week