Market
Hedera Hashgraph, Catizen prices soar as traders eye Vantard


Cryptocurrencies were fairly mixed on Monday as Bitcoin remained stubbornly above the important support level at $90,000. Hedera Hashgraph (HBAR) token surged to a high of $0.1490, its highest level since April 24 and 256% above its lowest point this month.
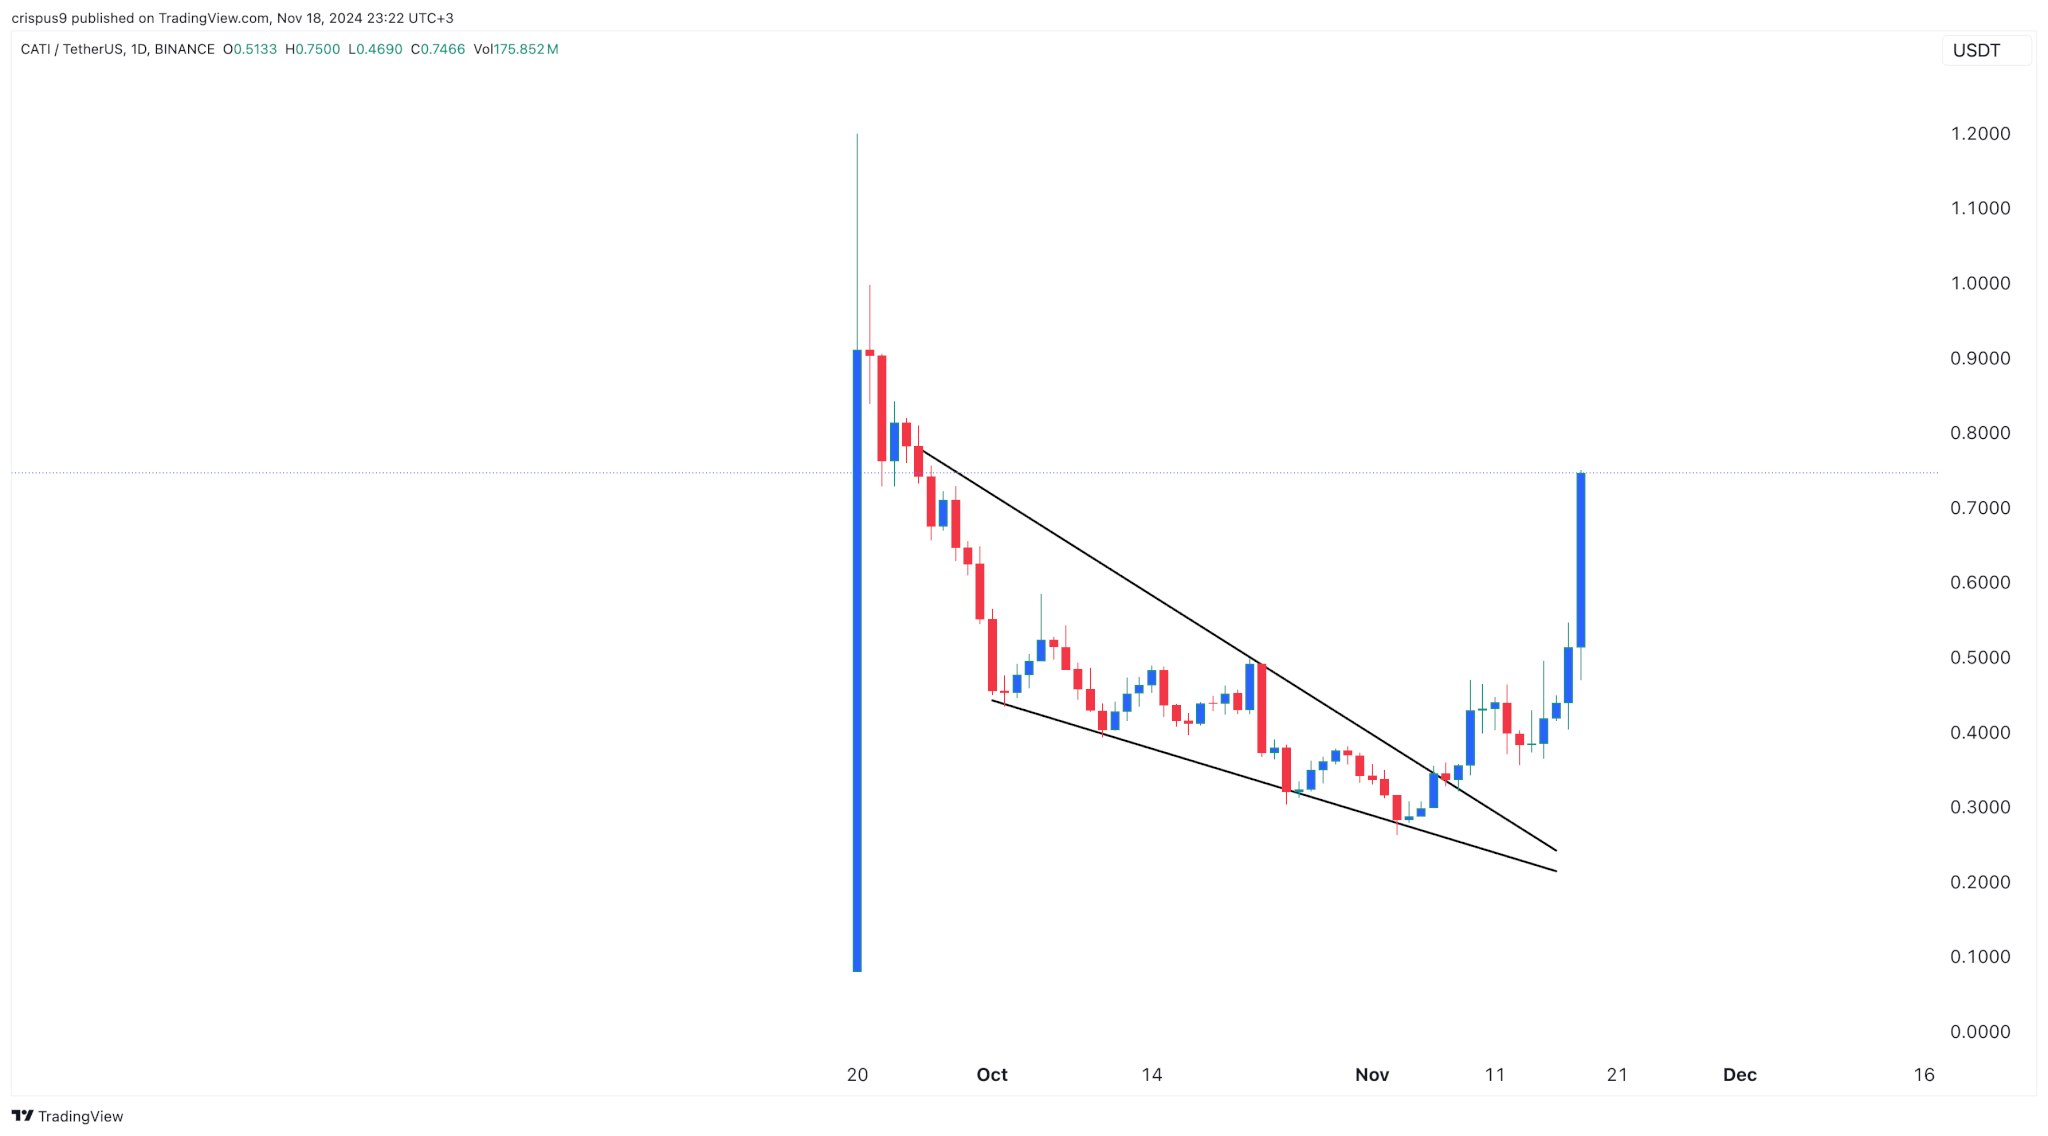
Similarly, Citizen (CATI), the popular Telegram game, jumped for four consecutive days, reaching a high of $0.70, its highest point since September. Notably, investors continued to eye Vantard, an upcoming cryptocurrency that seeks to create a meme coin index fund.
Why Hedera Hashgraph and Catizen soared
Hedera Hashgraph token surged after a leading company applied for a spot HBAR ETF in the United States. This application is taking advantage of the recent Donald Trump election, which will likely usher in a new era in the crypto industry.
Unlike Joe Biden, Trump has comeout in support of the crypto industry since he has a skin the game. As such, there is a likelihood that the SEC will approve new crypto ETFs at a faster pace in the coming year.
Hedera Hashgraph is seen as an ideal candidate for an ETF because of its use case and the fact that it counts influential companies like Google, Mondelez, and IBM as members of its governance council.
The main issue with Hedera is that it often has low volume and it has not attracted many developers in its ecosystem. As such, even if the ETF is approved, it is unclear whether it will gain popularity among institutional investors.
Citizen, on the other hand, is a top player in the tap-to-earn ecosystem that has grown rapidly in the past few months. As shown below, its rebound was mostly because of technicals since it had formed a falling wedge pattern before its comeback. There is a likelihood that the token will surge to a record high of $1.2, which is about 60% above the current level.

Vantard token sale is accelerating
Meanwhile, investors have shifted their focus to Vantard, a popular crypto project that is in its token sale. Vantard has raised over $844,000 from investors, a trend that could continue as meme coins jump.
Vantard is based on the idea that meme coins do well over time. Recent data show that meme tokens like Dogecoin, Floki, and Dogwifhat have outperformed major cryptocurrencies like Bitcoin and Ethereum.
Vantard’s strategy is to create a meme coin index fund that will track the biggest and most promising tokens in the industry. As such, instead of investing in all these coins, one can buy the VTARD token and gain exposure to some of the best coins.
The developers hope that their tokens will thrive as Trump is set to simplify cryptocurrency laws while the Federal Reserve is expected to continue cutting interest rates through 2025. You cann learn more about Vantard here.
Market
Report Alleges Massive Meme Coin Sniping on Pump.fun

According to a new report from Pine Analytics, token deployers on Pump.fun systematically funded sniper wallets to buy their own meme coins. This impacted over 15,000 token launches on the platform.
These sniper wallets operated primarily during US trading hours, executing standardized, profitable strategies. Unrelated bot activity obscures their behavior, making it extremely difficult to isolate these wallets—and they can readily adapt to new countermeasures.
Snipers Roam Free on Pump.fun Meme Coins
Pump.fun has remained one of the most popular meme coin launchpads on Solana despite persistent controversies and other criticism.
However, Pine Analytics’ new report has uncovered a new controversy, discovering systematic market manipulation on the platform. These snipes include as much as 1.75% of all launch activity on Pump.fun.
“Our analysis reveals that this tactic is not rare or fringe — over the past month alone, more than 15,000 SOL in realized profit was extracted through this method, across 15,000+ launches involving 4,600+ sniper wallets and 10,400+ deployers. These wallets demonstrate unusually high success rates (87% of snipes were profitable), clean exits, and structured operational patterns,” it claimed.
Solana meme coin deployers on Pump.fun follow a consistent pattern. They fund one or more sniper wallets and grant them advance notice of upcoming token launches.
Those wallets purchase tokens in the very first block and then liquidate almost immediately—85% within five minutes and 90% in just one or two swap events.

Pump.fun meme coin developers exploit this tactic to create the appearance of immediate demand for their tokens. Retail investors, unaware of the prior sell‑off, often purchase these tokens after the snipe, giving developers an unfair advantage. This constitutes market manipulation and erodes trust in the platform.
Pine Analytics had to carefully calibrate its methods to identify genuine snipers. Apparently, 50% of meme coin launches on Pump.fun involve sniping, but most of this is probably bots using the “spray and pray” method.
However, by filtering out snipers with no direct links to developer wallets, the firm missed projects that covered their tracks through proxies and burners.
In other words, the meme coin community does not have adequate defenses against systematic abuse on Pump.fun. There are a few possible ways that the platform could flag repeat offenders and sketchy projects, but adaptive countermeasures could defeat them. This problem demands persistent and proactive action.
Unfortunately, it may be difficult to enact such policies. Meme coin sniping is so systematic that Pump.fun could only fight it with real commitment.
Analysts think that building an on-chain culture that rewards transparency over extraction is the best long-term solution. A shift like that would be truly seismic, and the meme coin sector might not survive it.
Disclaimer
In adherence to the Trust Project guidelines, BeInCrypto is committed to unbiased, transparent reporting. This news article aims to provide accurate, timely information. However, readers are advised to verify facts independently and consult with a professional before making any decisions based on this content. Please note that our Terms and Conditions, Privacy Policy, and Disclaimers have been updated.
Market
Solana Leads Blockchain Metrics as SOL Momentum Builds

Solana (SOL) continues to show strength across multiple fronts, maintaining a bullish structure on its Ichimoku Cloud chart while gaining momentum in key market metrics. The BBTrend indicator has turned higher again, signaling renewed buying pressure after a brief cooldown.
On-chain activity remains strong, with Solana leading all blockchains in DEX volume and dominating fee generation thanks to the explosive growth of meme coins and launchpad activity. With SOL now trading above a key resistance level, the path is open for further upside—though a loss of momentum could still trigger a retest of lower supports.
Solana Maintains Bullish Structure, but Momentum Faces Key Test
On Solana’s Ichimoku Cloud chart, the price is currently above the Kijun-sen (red base line) but has dipped below the Tenkan-sen (blue conversion line), signaling weakening short-term momentum.
The flattening Tenkan-sen and price behavior suggest possible consolidation or the early stages of a pullback. Still, with the price holding above the Kijun-sen, medium-term support remains intact.

The overall Ichimoku structure remains bullish, with a thick, rising cloud and leading span A well above span B—indicating strong underlying support.
If Solana finds support at the Kijun-sen and climbs back above the Tenkan-sen, the uptrend could regain strength; otherwise, a test of the cloud’s upper boundary may follow.

Meanwhile, Solana’s BBTrend is currently at 6, extending nearly ten days in positive territory after peaking at 17.5 on April 14. The recent increase from 4.26 to 6 suggests renewed bullish momentum following a brief cooldown.
BBTrend, or Bollinger Band Trend, tracks the strength of price movement based on Bollinger Band expansion.
Positive values like the current one point to an active uptrend, and if the BBTrend continues to rise, it could signal stronger momentum and potential for another upward move.
Solana Dominates DEX Volume and Fee Generation as Meme Coins Drive Ecosystem Growth
Solana has once again claimed the top spot among all chains in DEX volume, recording $15.15 billion over the past seven days. The combined total of Ethereum, BNB, Base, and Arbitrum reached $22.7 billion.

In the last 24 hours alone, Solana saw $1.67 billion in volume, largely fueled by its booming meme coin ecosystem and the ongoing launchpad battle between PumpFun and Raydium. Adding to this good momentum, Solana recently surpassed Ethereum in Staking Market Cap.

When it comes to application fees, Solana’s momentum is just as clear. Four of the top ten fee-generating apps over the past week—PumpFun, Jupiter, Jito, and Meteora—are Solana-focused.
Pump leads the pack with nearly $18 million in fees alone.
Solana Breaks Key Resistance as Uptrend Targets Higher Levels, but Risks Remain
Solana has finally broken above its key resistance at $136, flipping it into a new support level that was successfully tested just yesterday.
Its EMA lines remain aligned in a bullish setup, suggesting the uptrend is still intact.
If this momentum continues, SOL price could aim for the next resistance zones at $147 and $152—levels that, if breached, open the door to a potential move toward $179.

The current structure favors buyers, with higher lows and strong support reinforcing the trend.
However, if momentum fades, a retest of the $136 support is likely.
A breakdown below that level could shift sentiment, exposing Solana to deeper pullbacks toward $124 and even $112.
Disclaimer
In line with the Trust Project guidelines, this price analysis article is for informational purposes only and should not be considered financial or investment advice. BeInCrypto is committed to accurate, unbiased reporting, but market conditions are subject to change without notice. Always conduct your own research and consult with a professional before making any financial decisions. Please note that our Terms and Conditions, Privacy Policy, and Disclaimers have been updated.
Market
Crypto Firms Donated $85 million in Trump’s Inauguration

According to a new report, 15 firms and individuals from the crypto industry donated more than $100,000 to President Trump’s Inauguration, totaling over $85 million.
Almost all of these companies apparently received direct or indirect benefits from Trump’s administration. This includes dropped legal proceedings, lucrative business partnerships, participation in Trump’s Crypto Summit, and more.
Crypto Industry Went All-In on Trump’s Inauguration
Since promising to bring friendlier regulations on the campaign trail, Donald Trump attracted a reputation as the Crypto President.
Trump’s Inauguration festivities included a “Crypto Ball,” and several prominent firms made donations for these events. Today, a report has compiled all crypto-related contributions of over $100,000, revealing some interesting facts.

Since taking office, President Trump and his family have been allegedly involved in prominent crypto controversies, and these donations may be linked to several of them.
For example, eight of the donors, Coinbase, Crypto.com, Uniswap, Yuga Labs, Kraken, Ripple, Robinhood, and Consensys, had SEC investigations or lawsuits against them closed since Trump’s term began.
The commission might have dropped its probe against these companies anyway due to its changing stance on crypto enforcement. However, being in the President’s good books likely helped the process.
Further Alleged Benefits for Donors
In other words, nearly half the firms that made donations to Trump’s Inauguration have seen their legal problems cleared up quickly. This isn’t the only regulation-related benefit they allegedly received.
Circle, for example, recently made an IPO after openly stating that Trump’s Presidency made it possible. Galaxy Digital received SEC approval for a major reorganization, a key step for a NASDAQ listing.
Other donors, such as Crypto.com and ONDO, got more direct financial partnerships with businesses associated with the Trump family.
Previously, Ripple’s CEO, Brad Garlinghouse, anticipated a crypto bull market under Trump. Also, XRP, Solana, and Cardano were all unexpectedly included in the US Crypto Reserve announcement.
All three of these companies made major donations to Trump’s Inauguration.
It seems that most of the firms involved got at least some sort of noticeable benefit from these donations. Donors like Multicoin and Paradigm received invitations to Trump’s Crypto Summit, while much more prominent groups like the Ethereum Foundation got snubbed.
Meanwhile, various industry KOLs and community members have already alleged major corruption in Trump’s crypto connections.
While some allegations might lack substantial proof, the crypto space has changed dramatically under the new administration, for both good and bad.
Disclaimer
In adherence to the Trust Project guidelines, BeInCrypto is committed to unbiased, transparent reporting. This news article aims to provide accurate, timely information. However, readers are advised to verify facts independently and consult with a professional before making any decisions based on this content. Please note that our Terms and Conditions, Privacy Policy, and Disclaimers have been updated.


