
Market
Hedera CryptoAutos Integration: Redefining Luxury Car Purchases

CryptoAutos, the world’s first crypto-powered luxury car marketplace, integrated with Hedera Hashgraph (HBAR), marking a landmark development in the automotive marketplace.
With this integration, CryptoAutos is redefining the way users purchase high-end vehicles using cryptocurrencies.
Hedera’s Integration with CryptoAutos
The integration into CryptoAutos marks a significant upgrade to the platform’s capabilities. Hedera’s advanced blockchain technology offers near-zero transaction fees, secure settlements, and unmatched reliability, making it a perfect match for CryptoAutos. This integration enhances the platform’s user experience while providing a gateway to Hedera’s strong community, expanding CryptoAutos’ reach globally.
Hedera’s near-zero transaction fees and instant finality enable CryptoAutos to offer a seamless and secure payment experience for its users. The network’s reliability ensures smooth transaction execution, fostering trust and confidence among buyers and dealers.
“CryptoAutos, the world’s first crypto automotive marketplace, has officially integrated with Hedera. This unlocks new possibilities for secure, fast, and efficient transactions in the automotive world,” Hedera shared.
CryptoAutos provides a platform where users can explore and purchase luxury vehicles ranging from Ferraris and Porsches to Ford GTs. With over 20,000 cars available across 600 dealerships worldwide, the marketplace caters to a global audience.
Prospective buyers can easily find dealers near them or search for specific niche models, ensuring inclusivity and accessibility for customers in any location.
The platform allows users to purchase cars using Bitcoin (BTC), Ethereum (ETH), Binance Coin (BNB), and other cryptocurrencies. This streamlines the transaction process and bypasses traditional banking barriers. Additionally, CryptoAutos offers comprehensive guides to help users navigate the process of purchasing vehicles with digital currencies.
“This integration expands our ecosystem reach while providing the Hedera community direct access to our luxury automotive marketplace,” CryptoAutos stated.
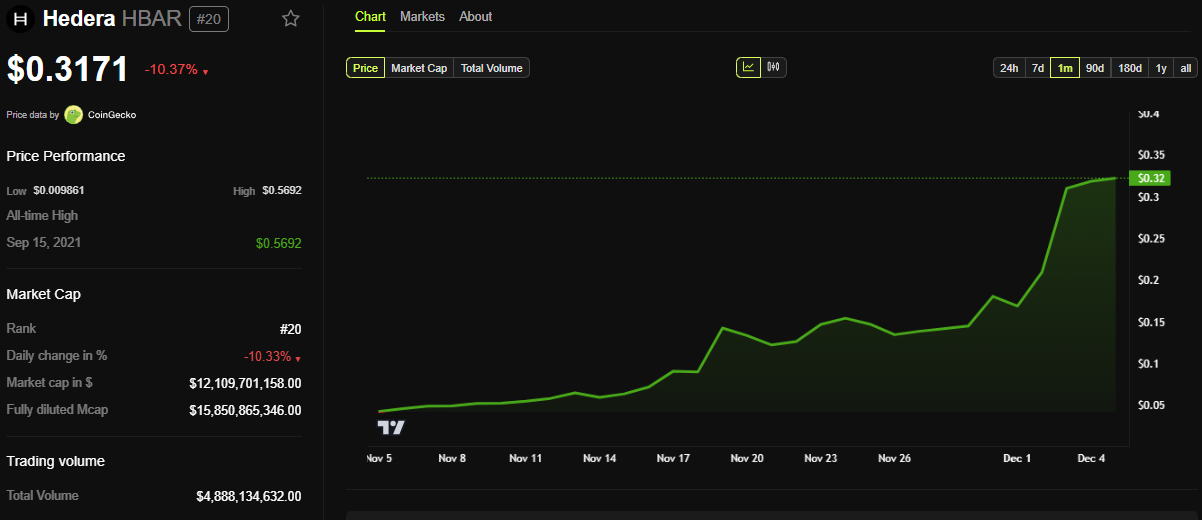
Despite this news, Hedera Hashgraph’s HBAR token is down by a stark 10%. According to BeInCrypto data, HBAR was trading for $0.3171 as of this writing.
CryptoAutos Launches Native AUTOS Token
Meanwhile, this development follows the launch of AUTOS, which debuted through a Token Generation Event (TGE) on December 3, 2024. Hosted on the Ethereum blockchain via the Fjord Foundry platform, the event saw the release of 110 million AUTOS tokens.
“The time has finally come — the AUTOS Community Launch is LIVE!!! $58 million revenue, Tier 1 partners & exchanges, fixed price sale, 100% unlock at TGE, and open to all. And your chance to win a Lamborghini Urus. What more could you possibly need,” CryptoAutos said.
The community-driven launch, focused on decentralization, raised an impressive $4.57 million within the first five hours, displaying strong interest in the token. Participants in the TGE were automatically entered into a contest to win a Lamborghini Urus, reflecting CryptoAutos’ blend of blockchain innovation and luxury.
Following the launch, AUTOS will initially be listed on decentralized exchanges before debuting on KuCoin, a prominent centralized exchange. The AUTOS token is designed to transform luxury car ownership by enabling seamless, transparent, and secure transactions. It also powers various features within the CryptoAutos ecosystem, including staking, governance, and user engagement.
Token holders gain access to exclusive rewards, discounts, and loyalty incentives, while dealers can leverage advertising solutions to reach their audience. Additionally, AUTOS supports CryptoAutos’ Gold membership service and its upcoming Real World Asset (RWA) platform, offering utility beyond transactions.
CryptoAutos’ achievements are already noteworthy, with over $58 million in sales revenue generated to date. The platform recently completed the first-ever car sale using Toncoin (TON), solidifying its position as a leader in the crypto-to-fiat marketplace.
The auto marketplace is setting a new standard for token launches with its transparent, community-first approach. By prioritizing decentralized distribution over venture capital funding, the platform ensures equal access for all participants. With $750,000 USDT secured for liquidity, the launch reflects a sustainable and inclusive vision for the future.
Disclaimer
In adherence to the Trust Project guidelines, BeInCrypto is committed to unbiased, transparent reporting. This news article aims to provide accurate, timely information. However, readers are advised to verify facts independently and consult with a professional before making any decisions based on this content. Please note that our Terms and Conditions, Privacy Policy, and Disclaimers have been updated.


Onyxcoin (XCN) is down nearly 10% over the past seven days, cooling off after a sharp 200% rally between April 9 and April 11. Momentum indicators suggest that the bullish trend may be losing strength, with both the RSI and ADX showing signs of fading conviction.
While XCN’s EMA lines remain in a bullish formation, early signs of a potential reversal are emerging as short-term averages begin to slope downward. The coming days will be key in determining whether Onyxcoin can stabilize and resume its climb—or if a deeper correction is on the horizon.
Onyxcoin Shows Early Signs of Stabilization, but Momentum Remains Uncertain
Onyxcoin’s Relative Strength Index (RSI) is currently sitting at 43. Readings above 70 typically indicate that an asset is overbought and could be due for a pullback, while readings below 30 suggest it may be oversold and poised for a potential rebound.
Levels between 30 and 70 are considered neutral, often reflecting consolidation or indecision in the market.

XCN’s RSI signals a neutral state but shows signs of gradual recovery. While not yet a clear bullish signal, yesterday’s upward move suggests that bearish momentum may be easing.
However, the fact that RSI failed to hit above 50 reflects lingering uncertainty and a lack of sustained buying pressure.
For now, XCN appears to be in a wait-and-see phase, where a continued climb in RSI could signal a shift toward renewed upside, but any further weakness might keep the price trapped in a consolidation range.
XCN Uptrend Weakens as ADX Signals Fading Momentum
Onyxcoin’s Average Directional Index (ADX) has declined to 11, down from 13.92 yesterday and 15.26 two days ago. This decline reflects a consistent weakening in trend strength.
The ADX is a key component of the Directional Movement Index (DMI) and is used to measure the strength—not the direction—of a trend on a scale from 0 to 100.
Values below 20 typically suggest that the market is trending weakly or not at all, while readings above 25 confirm a strong and established trend.

With the ADX now at 11, Onyxcoin’s trend is losing momentum, even though it technically remains in an uptrend. This low reading suggests the current bullish phase is fragile and may lack the conviction needed for sustained upward movement.
Combined with EMA lines that are beginning to flatten, the weakening ADX adds weight to the possibility that the trend could soon shift or stall.
If no surge in buying pressure emerges to reinforce the uptrend, XCN may enter a period of sideways movement or even a reversal in the short term.
Onyxcoin at a Crossroads as EMA Lines Hint at Possible Trend Reversal
XCN EMA lines remain bullish for now, with short-term averages still positioned above long-term ones.
However, the short-term EMAs have started to slope downward, raising the possibility of a looming death cross—a bearish crossover in which the short-term average falls below the long-term average.
If this crossover materializes, it would signal a shift in trend direction and could trigger a deeper pullback, after a 200% rally between April 9 and April 11, making it one of the best-performing altcoins of the previous weeks.
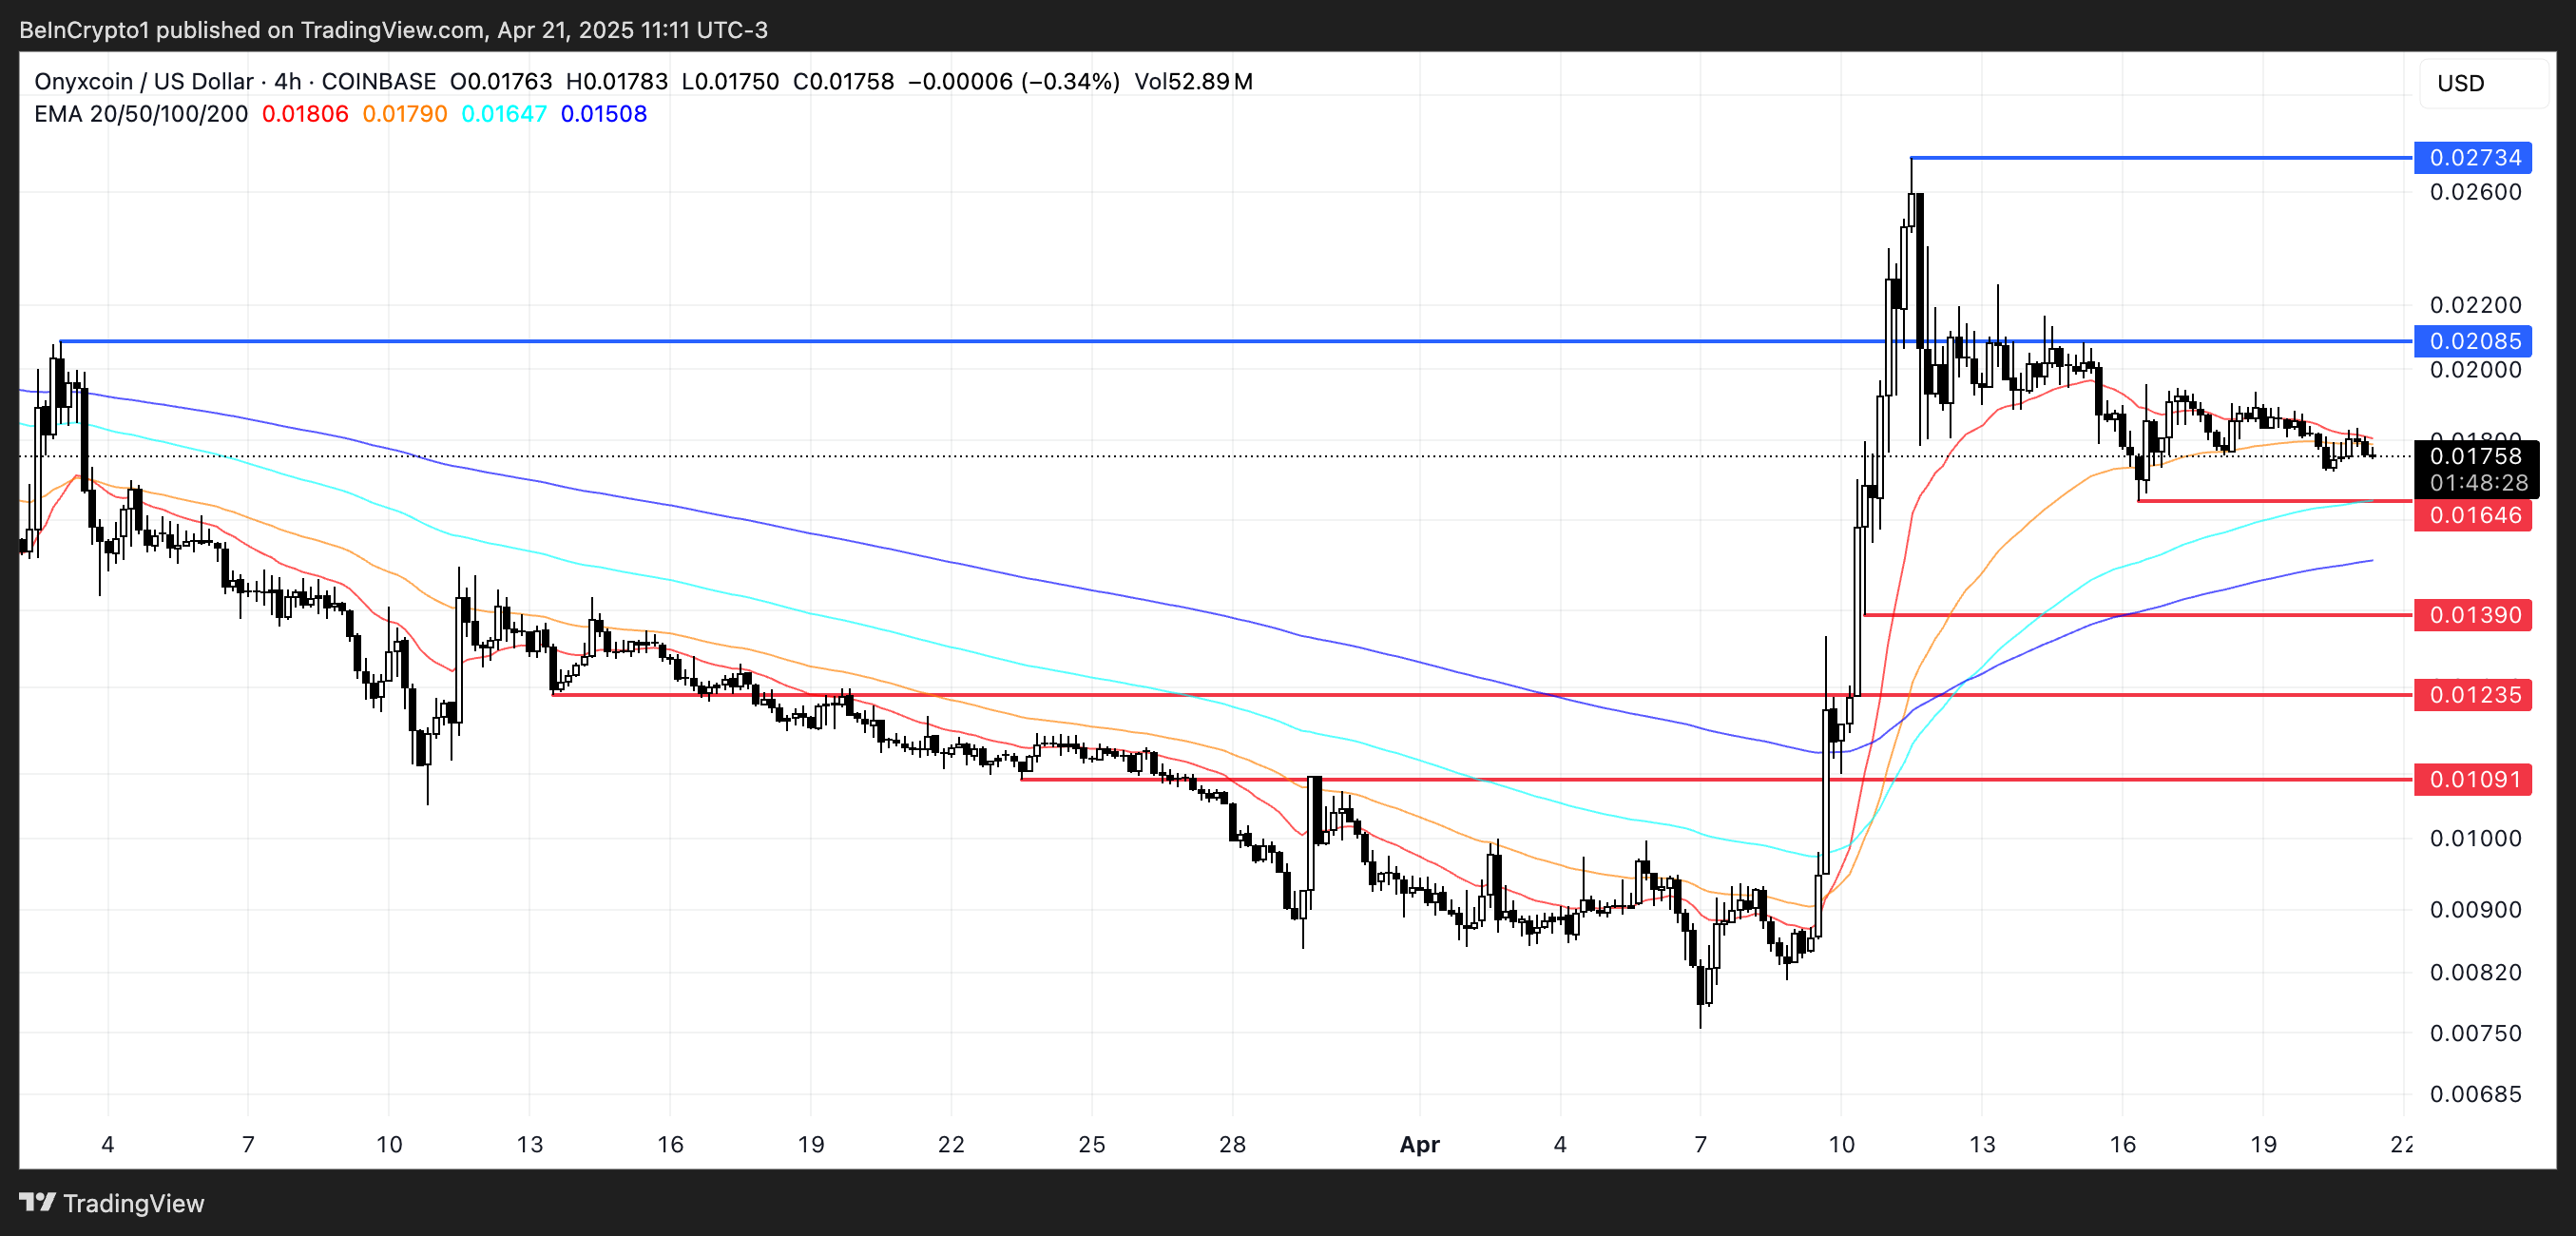
Key support levels to watch are $0.016, followed by $0.0139 and $0.0123. If bearish momentum accelerates, XCN could drop as low as $0.0109, marking a potential 38% correction from current levels.
On the flip side, if bulls manage to regain control and reinforce the existing uptrend, XCN could challenge the resistance at $0.020.
A breakout above that level would open the door for a potential rally toward $0.027, representing a 55% upside.
Disclaimer
In line with the Trust Project guidelines, this price analysis article is for informational purposes only and should not be considered financial or investment advice. BeInCrypto is committed to accurate, unbiased reporting, but market conditions are subject to change without notice. Always conduct your own research and consult with a professional before making any financial decisions. Please note that our Terms and Conditions, Privacy Policy, and Disclaimers have been updated.

The crypto market has shown consistent growth over the past few days, helping altcoins alongside Bitcoin to recover. However, relying solely on broader market cues or momentum will not sustain price growth.
BeInCrypto has analyzed three altcoins for investors to watch in April, as important developments are set to unfold this week.
Tutorial (TUT)
TUT price has remained stable throughout most of the month, currently hovering below the $0.027 resistance level. Successfully breaching this barrier is crucial for recovering the 53% losses incurred in March. A price rise above $0.027 could signal a positive trend and further upward movement in the coming weeks.
If this trend continues, TUT could push toward the next resistance level of $0.039, indicating strong momentum.
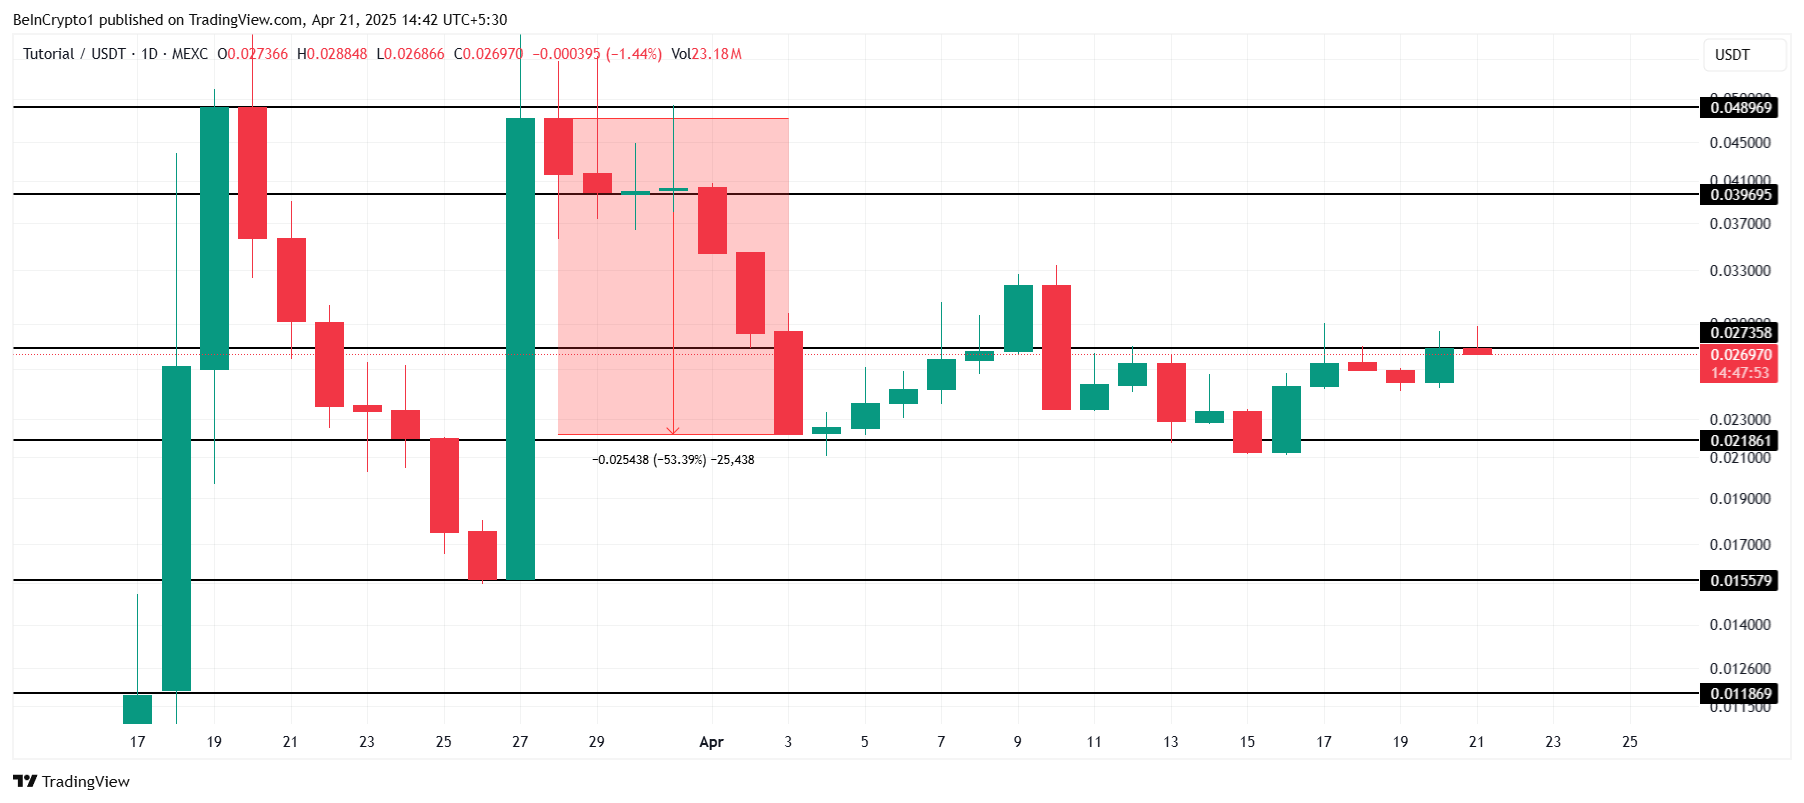
However, if TUT fails to break above the $0.027 resistance, the price could decline below $0.021. Such a drop would likely invalidate the bullish outlook and lead to further losses. In that scenario, the altcoin’s price might fall to $0.015, a significant setback for the token’s recovery.
Injective (INJ)
Injective’s price has surged by 17% in recent days, fueled by anticipation surrounding the upcoming Lyota Mainnet Upgrade. Set to go live on April 22, the upgrade is expected to enhance Injective’s infrastructure, performance, and transaction speeds. This has sparked optimism, driving the price higher in the short term.
Currently trading at $8.97, Injective is nearing the $9.11 resistance level. If it successfully breaches this barrier, the price could move beyond $10.00, potentially reaching $10.35. The positive sentiment surrounding the Lyota Mainnet Upgrade is likely to continue driving the token’s growth if it can surpass these levels.
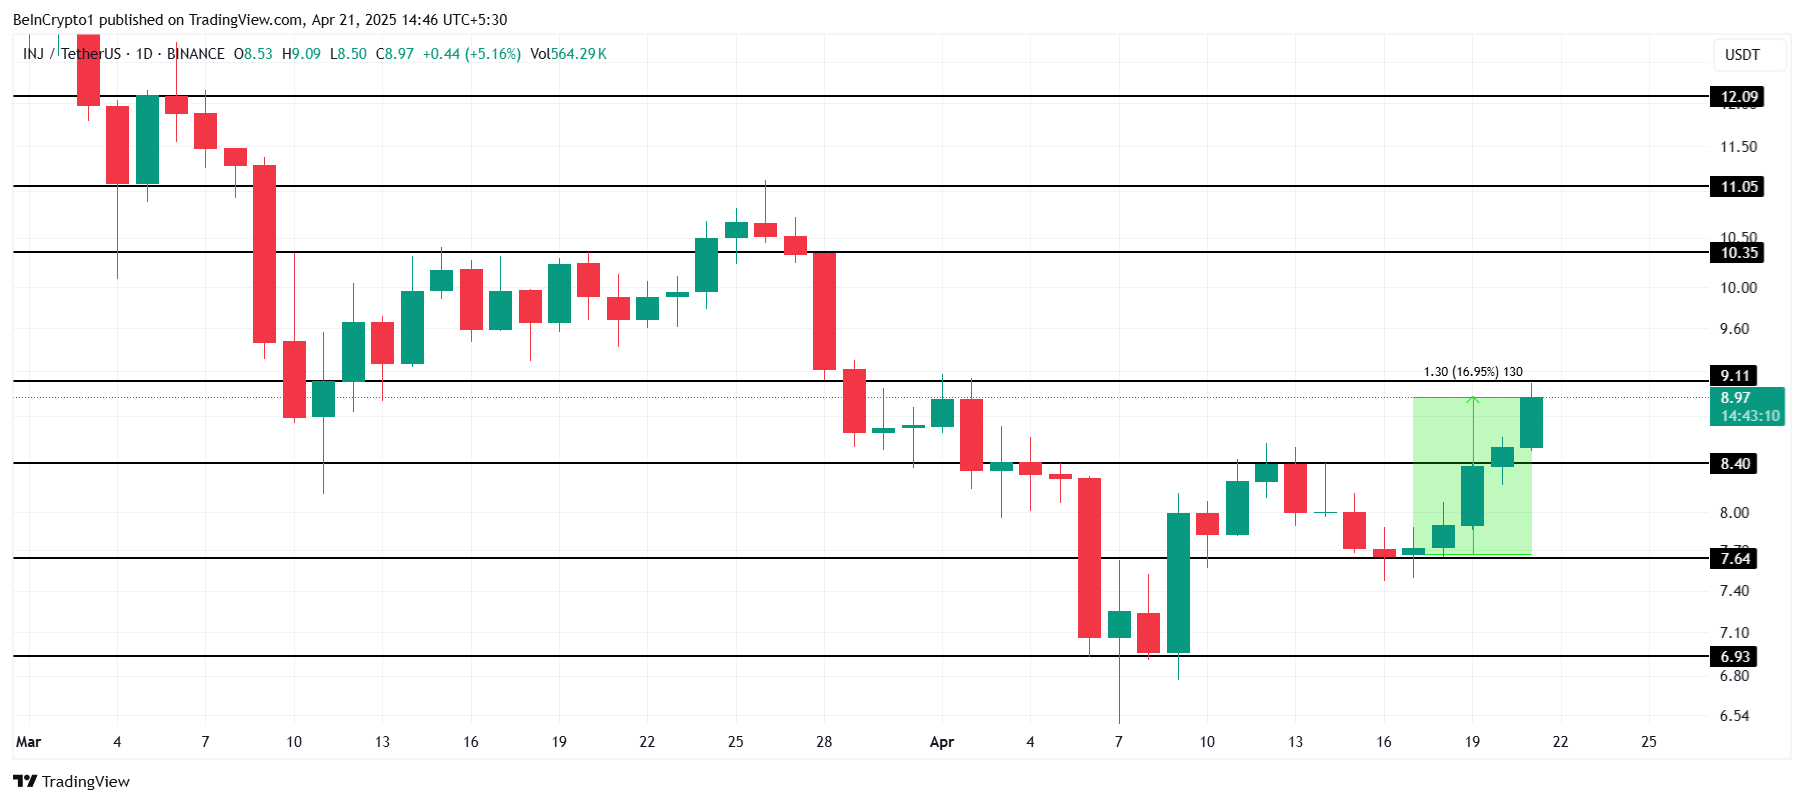
However, if Injective fails to break through the $9.11 resistance, as seen earlier in April, the price could fall below $8.40. This would signal a retreat and could see the token dip to $7.64, invalidating the bullish outlook and erasing recent gains.
BNB
BNB’s price currently stands at $604, experiencing a two-month downtrend. The altcoin is struggling to breach the resistance of $611. To push past this barrier, BNB needs strong support from the broader market or upcoming developments that could provide a catalyst for price movement and reversal.
One potential catalyst is the Lorentz opBNB mainnet hard fork, which is scheduled for today. The hard fork aims to enhance the chain’s speed and responsiveness. If successful, this could help BNB break the $611 resistance and push the price toward the next level of $647, spurring bullish sentiment.

However, if the hard fork’s impact fails to meet expectations, BNB could struggle to maintain upward momentum. In this case, the price may slip below the support of $576, potentially falling as low as $550. This would invalidate the current bullish outlook and likely continue the downtrend.
Disclaimer
In line with the Trust Project guidelines, this price analysis article is for informational purposes only and should not be considered financial or investment advice. BeInCrypto is committed to accurate, unbiased reporting, but market conditions are subject to change without notice. Always conduct your own research and consult with a professional before making any financial decisions. Please note that our Terms and Conditions, Privacy Policy, and Disclaimers have been updated.

MANTRA CEO, JP Mullin, is burning 150 million OM tokens from his own allocation and engaging other ecosystem partners to burn an additional 150 million tokens. This 300 million OM token burn aims to restore investor trust in the project and stabilize the altcoin’s price dynamics.
OM is attempting to recover from one of the most dramatic crashes in recent crypto history. On April 13, it lost over 90% of its value in a single hour. The collapse, which erased more than $5.5 billion in market cap, triggered widespread accusations of insider activity and manipulation within the Real-World Assets (RWA) sector.
Understanding MANTRA’s Token Burn
Mantra, once one of the biggest players in the Real-World Assets (RWA) sector, suffered a dramatic collapse on April 13, with its token crashing over 90% in less than an hour and wiping out more than $5.5 billion in market capitalization.
The plunge followed a rapid surge earlier this year, when OM rose from $0.013 to over $6, pushing its fully diluted valuation to $11 billion. The crash was reportedly triggered by a $40 million token deposit into OKX by a wallet allegedly linked to the team, sparking fears of insider selling.
Panic spread quickly as rumors of undisclosed OTC deals, delayed airdrops, and excessive token supply concentration fueled mass liquidations across exchanges.
Despite co-founder John Patrick Mullin denying any wrongdoing and blaming centralized exchanges for forced closures, investors and analysts raised concerns about potential manipulation by market makers and CEXs, drawing comparisons to past collapses like Terra LUNA.

In an effort to rebuild trust, Mullin has announced the permanent burn of his 150 million OM team allocation. The tokens, originally staked at mainnet launch in October 2024, are now being unbonded and will be fully burned by April 29, reducing OM’s total supply from 1.82 billion to 1.67 billion.
This move also lowers the network’s staked amount by 150 million tokens, which could impact on-chain staking APR.
Additionally, MANTRA is in talks with partners to implement a second 150 million OM burn, potentially cutting the total supply by 300 million tokens.
OM Price Faces Critical Test as Token Burn Battles Lingering Market Doubt
Despite MANTRA’s ongoing token burn efforts, it’s still uncertain whether the move will be enough to fully restore investor confidence in OM.
From a technical standpoint, if momentum begins to recover, OM could test the immediate resistance at $0.59. A successful breakout at that level may pave the way for further gains toward $0.71, with additional key hurdles at $0.89 and $0.997 standing between the token and a return to the psychologically important $1 mark.
However, reclaiming these levels will likely require sustained buying interest and broader sentiment recovery across the Real-World Assets (RWA) sector.

On the downside, if the token burn fails to shift sentiment or if selling pressure continues, OM risks resuming its decline.
The first key support lies at $0.51, and a breakdown below that level could send the price further down to $0.469.
Given the scale of the recent crash and the lingering distrust among investors, the path to recovery remains fragile—OM now sits at a critical crossroads between a potential rebound and further erosion of its market value.
Disclaimer
In line with the Trust Project guidelines, this price analysis article is for informational purposes only and should not be considered financial or investment advice. BeInCrypto is committed to accurate, unbiased reporting, but market conditions are subject to change without notice. Always conduct your own research and consult with a professional before making any financial decisions. Please note that our Terms and Conditions, Privacy Policy, and Disclaimers have been updated.

OM Price Reacts as MANTRA Announces Major 300M Token Burn Update

Onyxcoin (XCN) Shows Reversal Signs After 200% Rally

Ethereum Price Eyes $2,700 As Wyckoff Accumulation Nears Completion

Expert Reveals Pi Network’s Team Efforts To Stabilize Price Amid Token Unlocks

3 Altcoins to Watch in the Fourth Week of April 2025
Public Companies are Buying Bitcoin Again After a Brief Pause

2.52 Million Altcoins Are Ruining Crypto’s Future

Animoca Brands Valuation Tanks 75% In Two Years, Here’s Why

Crypto exchange BingX hacked for $43 million

Are The Big Players Losing Interest?

Hong Kong’s Securities Association Tips Authorities On Crypto Self-Regulation

Coinbase cbBTC Set to go Live on Solana
2.52 Million Altcoins Are Ruining Crypto’s Future
Animoca Brands Valuation Tanks 75% In Two Years, Here’s Why
Crypto exchange BingX hacked for $43 million
Are The Big Players Losing Interest?
Hong Kong’s Securities Association Tips Authorities On Crypto Self-Regulation
Coinbase cbBTC Set to go Live on Solana
-
 Bitcoin14 hours ago
US Economic Indicators to Watch & Potential Impact on Bitcoin
-

 Bitcoin20 hours ago
Here Are The Bitcoin Levels To Watch For The Short Term
-

 Market17 hours ago
Bitcoin Price Breakout In Progress—Momentum Builds Above Resistance
-

 Bitcoin23 hours ago
Bitcoin LTH Selling Pressure Hits Yearly Low — Bull Market Ready For Take Off?
-
 Altcoin12 hours ago
Expert Reveals Why BlackRock Hasn’t Pushed for an XRP ETF
-

 Altcoin17 hours ago
Expert Says Solana Price To $2,000 Is Within Reach, Here’s How
-

 Market15 hours ago
Solana Rallies Past Bitcoin—Momentum Tilts In Favor of SOL
-

 Market14 hours ago
Vitalik Buterin Proposes to Replace EVM with RISC-V