
Market
HBAR Price Primed For Massive Rally, But Open Interest Declines
Hedera’s native token, HBAR, has faced a sharp decline after failing to breach the $0.40 resistance level. The altcoin recently retraced to $0.25, a significant drop that has left traders uncertain.
While this correction may signal bearish sentiment in the short term, the broader macro outlook remains highly bullish. However, for HBAR to reclaim momentum, it must navigate the growing hesitation among market participants.
HBAR Traders Are Uncertain
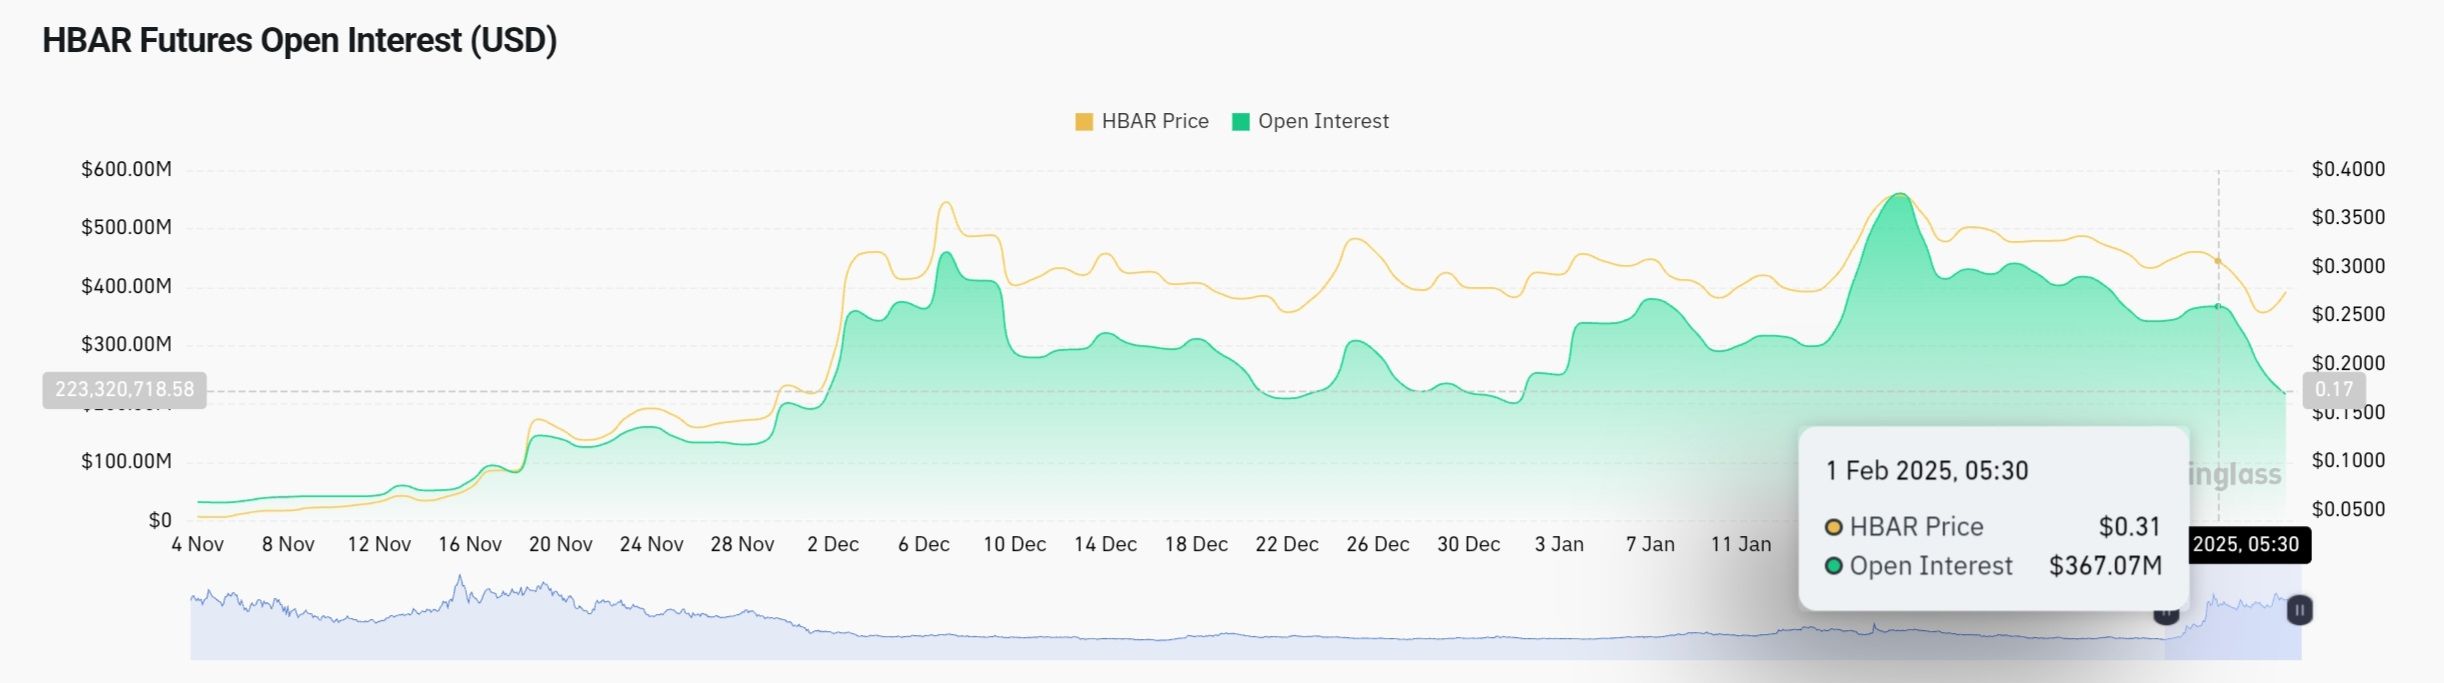
The market’s reaction to HBAR’s recent downturn is evident in the Futures market data. Open Interest currently stands at $216 million, a sharp decline from $367 million just three days ago. This $150 million drop highlights the hesitancy among traders, many of whom are liquidating positions.
The contraction in Open Interest suggests a shift toward bearish sentiment. Traders are moving out of leveraged positions, signaling decreased confidence in a near-term recovery. As a result, unless a resurgence in interest occurs, HBAR’s price action could remain subdued.
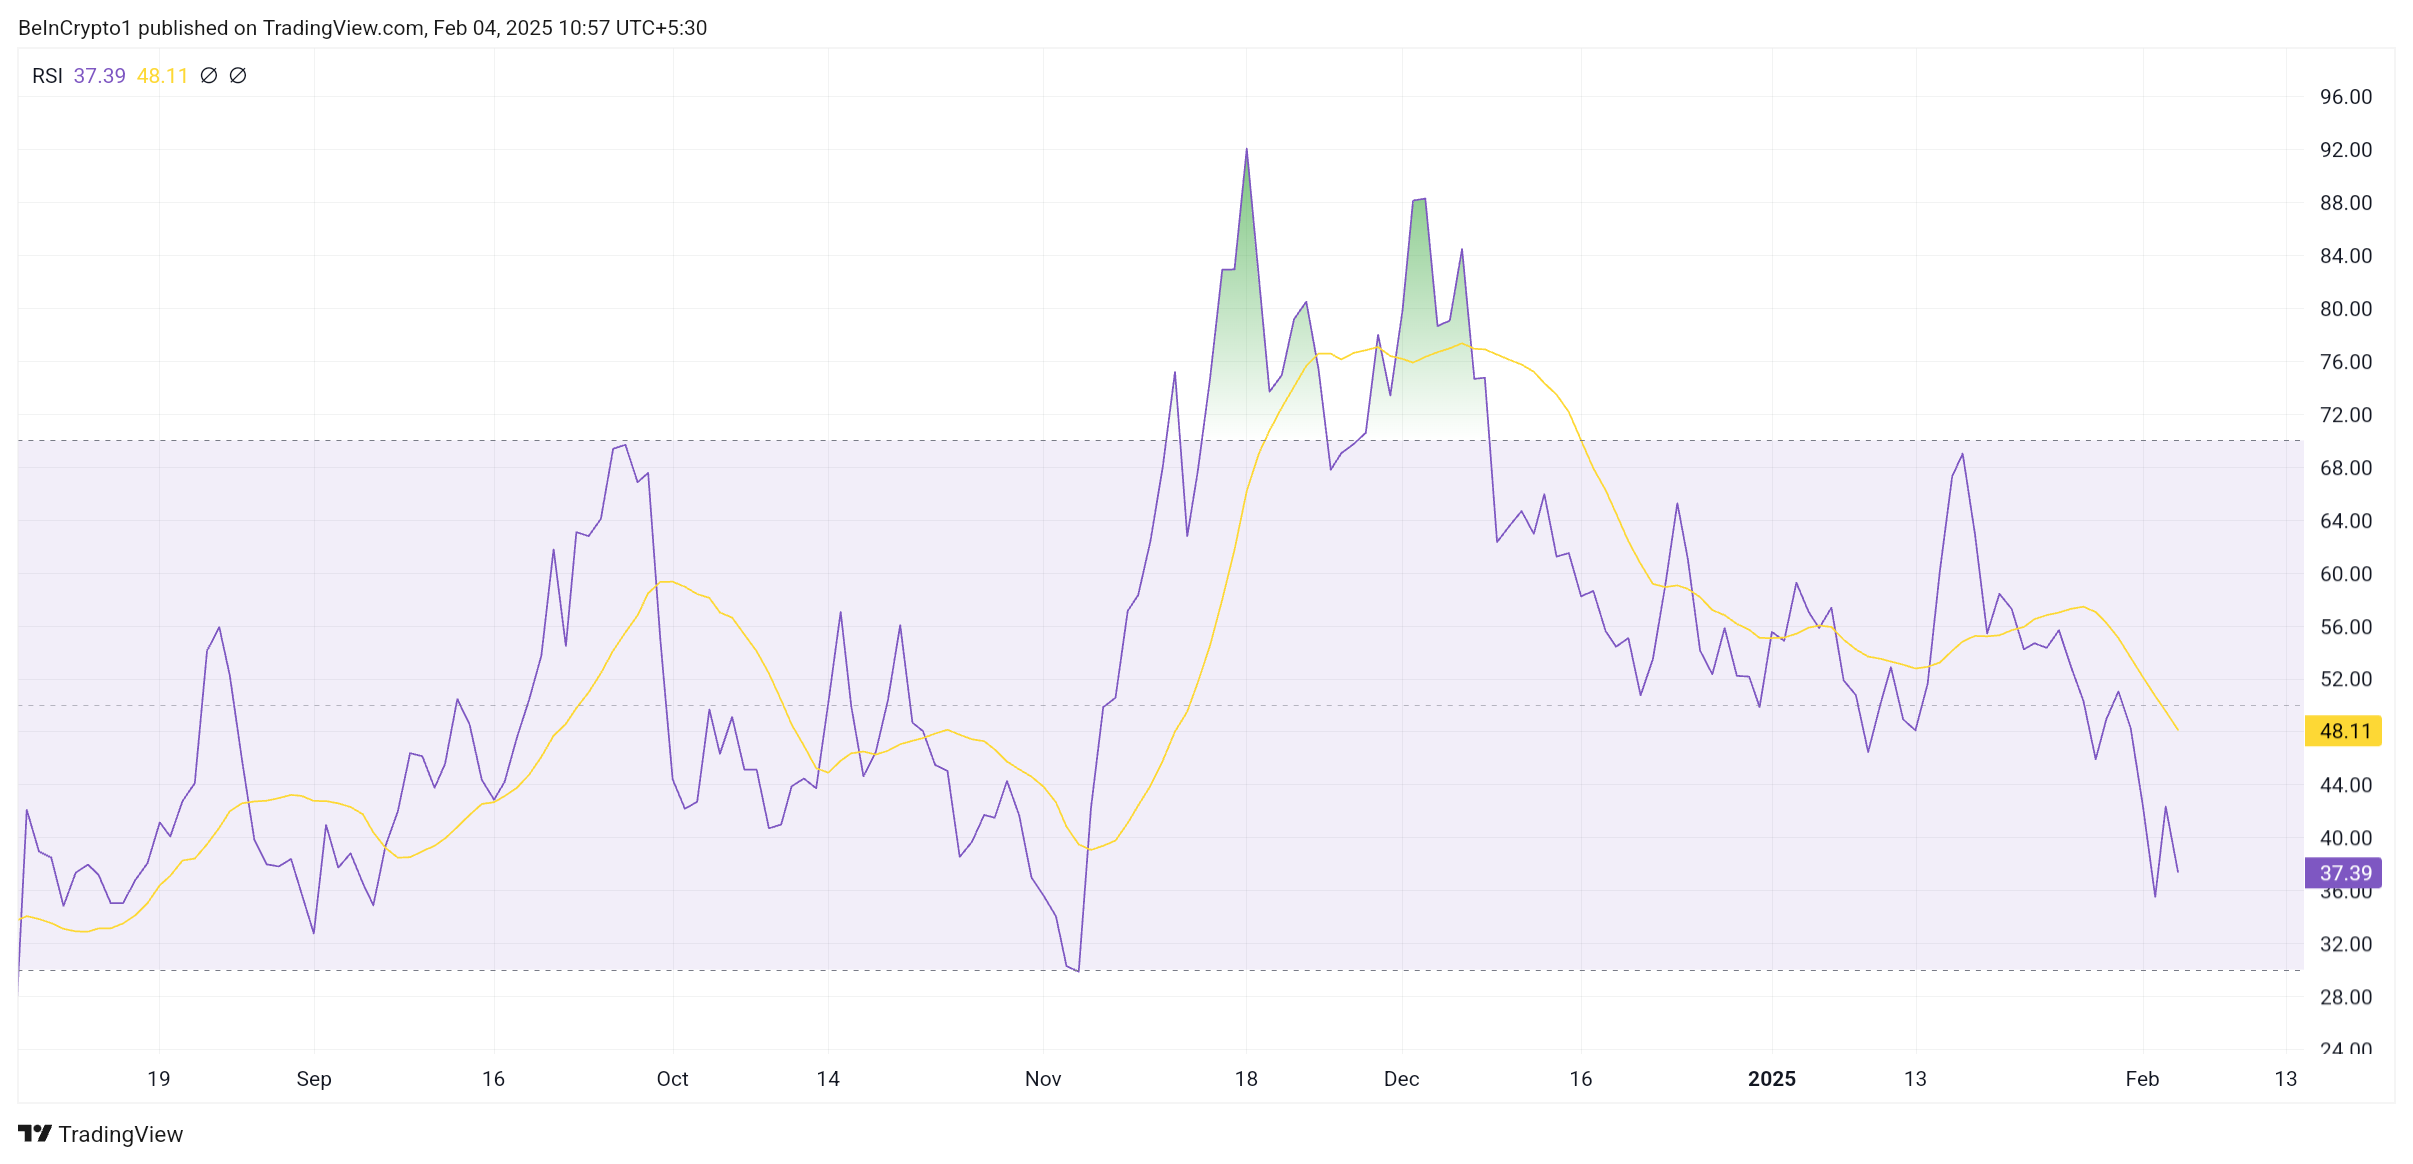
From a technical perspective, HBAR’s macro momentum reflects a strengthening bearish trend. The Relative Strength Index (RSI) has dropped to a three-month low, last seen in November 2024. Currently sitting below the neutral 50.0 level, the indicator highlights growing downside pressure.
The falling RSI suggests sellers are gaining control, making it more challenging for bulls to push prices higher. If this downward momentum continues, it could suppress any breakout attempts, keeping HBAR range-bound for an extended period.
HBAR Price Prediction: Finding A Breach
Despite the short-term bearish pressure, HBAR is forming a macro bull flag pattern, historically a precursor to substantial rallies. If this setup plays out, the altcoin could see a 684% surge, targeting $2.83. However, for this rally to materialize, HBAR must decisively break through the $0.40 resistance.
In the near term, the probability of an immediate breakout remains low. The price is likely to continue consolidating within the $0.25 to $0.40 range. If downward pressure intensifies, HBAR could lose support at $0.25, triggering a further decline toward $0.18.
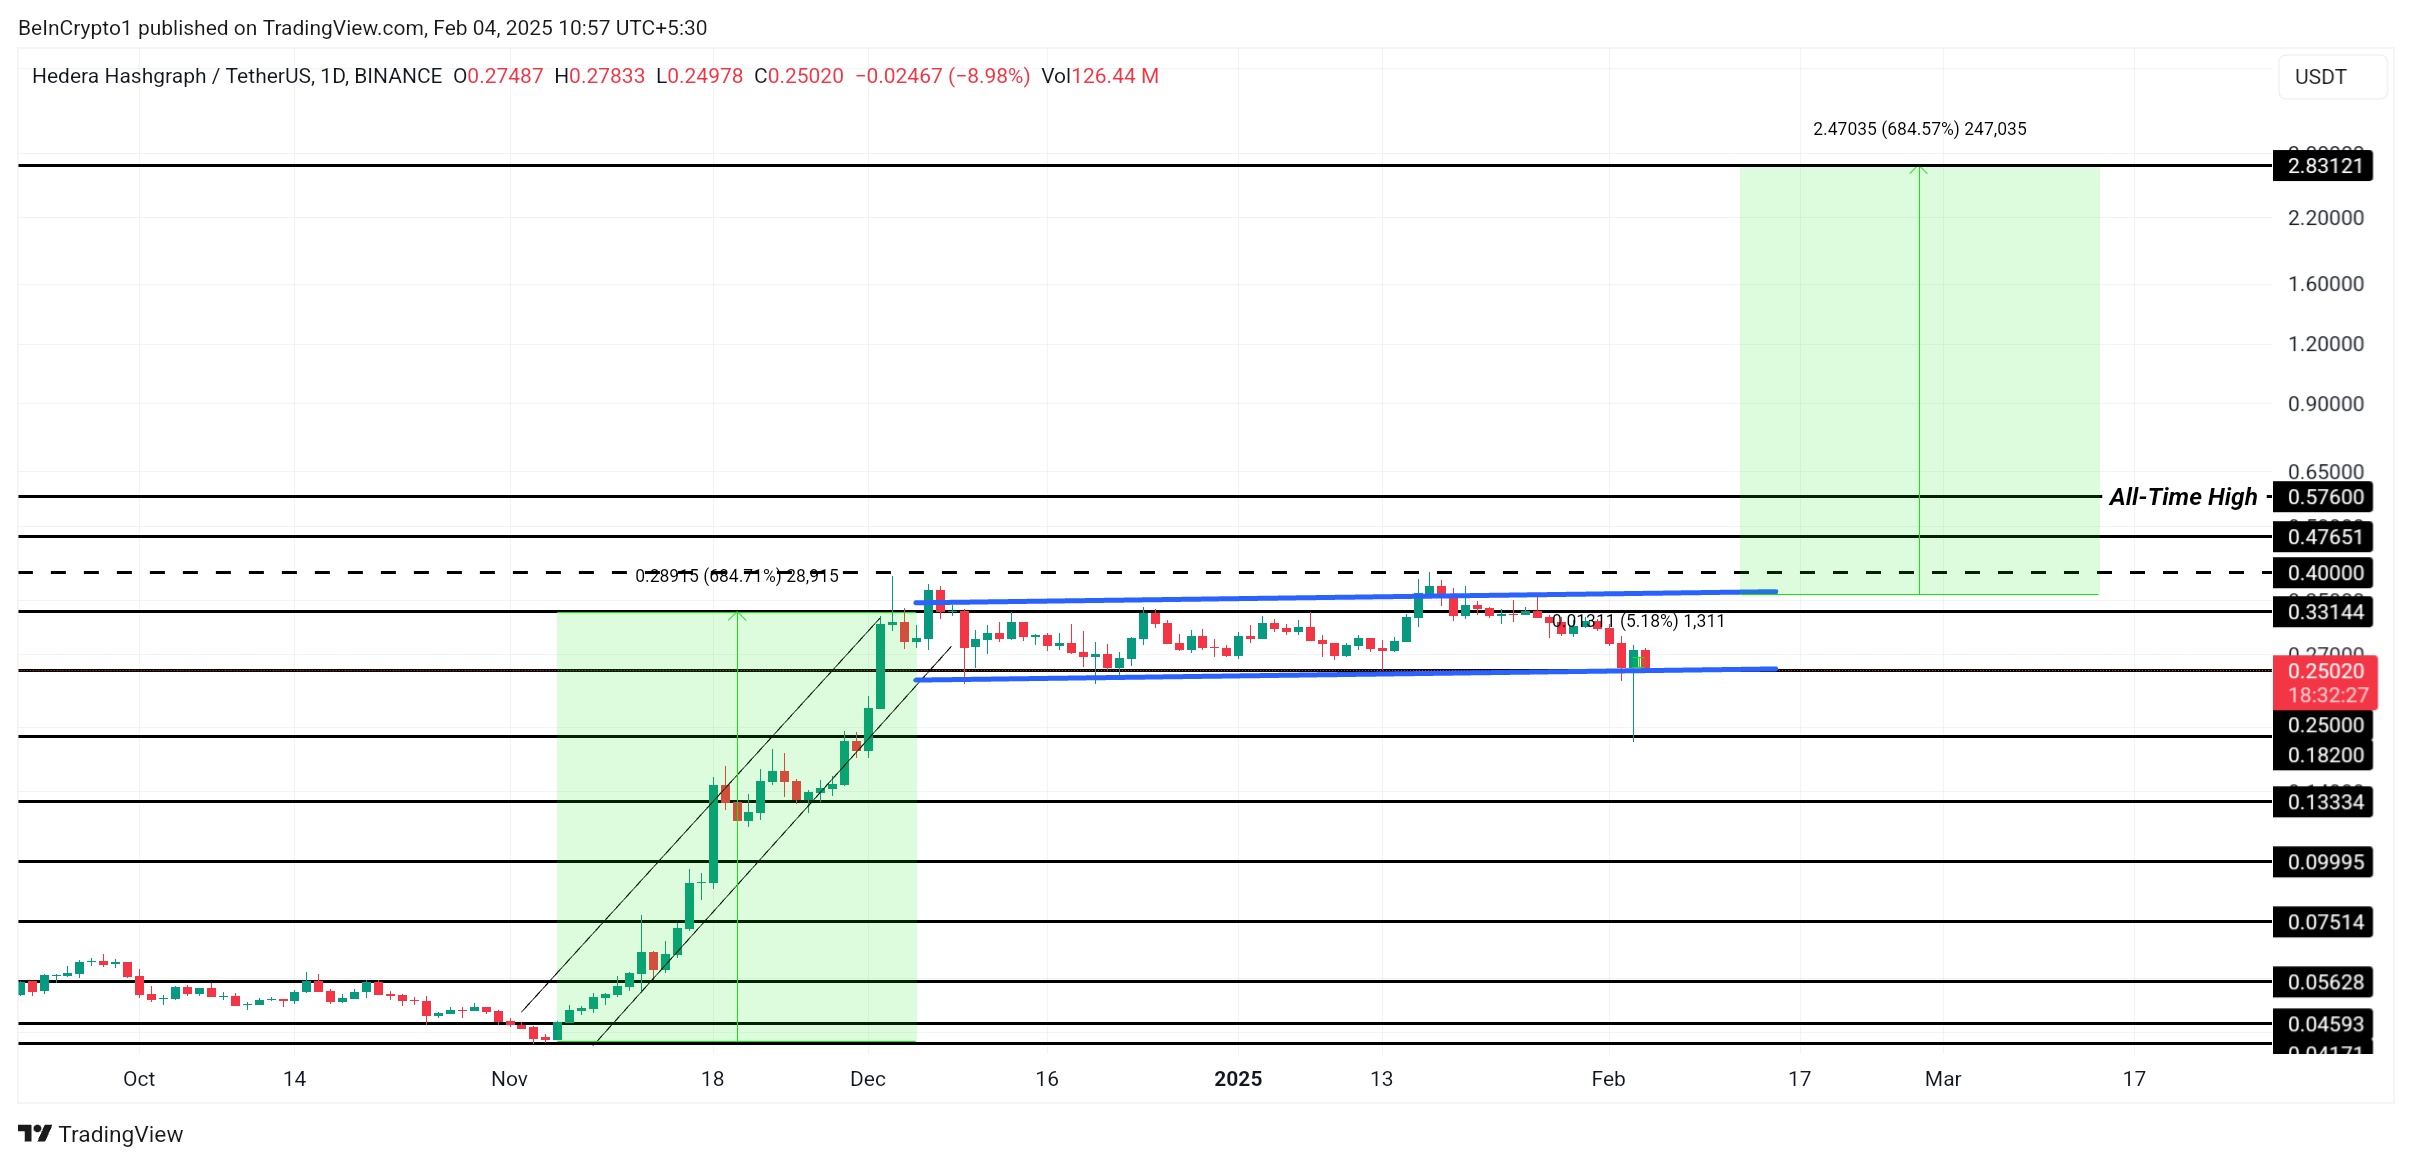
The only way to invalidate this bearish outlook is for HBAR to reclaim $0.40 as a support level. A successful breach of this resistance could fuel a rally toward $0.47, confirming a breakout from the bull flag pattern and paving the way for higher price targets.
Disclaimer
In line with the Trust Project guidelines, this price analysis article is for informational purposes only and should not be considered financial or investment advice. BeInCrypto is committed to accurate, unbiased reporting, but market conditions are subject to change without notice. Always conduct your own research and consult with a professional before making any financial decisions. Please note that our Terms and Conditions, Privacy Policy, and Disclaimers have been updated.


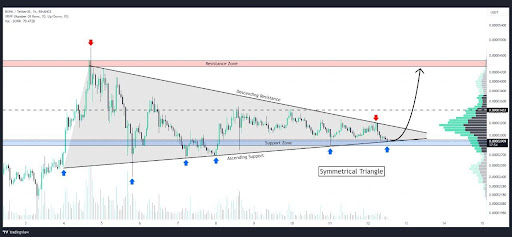
Bonk (BONK), one of the more energetic players in the meme coin space, is showing signs of a potentially explosive move as it coils tighter within a symmetrical triangle pattern. This classic chart formation, characterized by converging trendlines of lower highs and higher lows, often acts as a pressure booster for price action — the longer the squeeze, the more powerful the breakout tends to be.
The symmetrical triangle squeeze is a technical signal that often precedes sharp breakouts, and in BONK’s case, it couldn’t come at a more pivotal moment. With the broader meme coin market showing signs of strength and sentiment slowly shifting, a decisive move from this setup could define the next chapter for BONK. A breakout above the upper trendline might ignite fresh bullish momentum and open the door to new highs, while a break below support could trigger a sell-off toward lower key levels.
Bonk’s Recent Price Action: The Setup For A Big Move
According to a recent post by Whales_Crypto_Trading on X (formerly Twitter), Bonk is currently forming a symmetrical triangle pattern on the 1-hour chart. The price has just rebounded from the lower support trendline of the triangle, suggesting that buyers are stepping in to defend the structure and potentially build momentum for an upward breakout.
What makes this pattern particularly noteworthy is the potential upside. Whales_Crypto_Trading highlighted a profit target range of 70–80%, should BONK successfully break above the upper resistance trendline. With volatility tightening and volume starting to show signs of recovery, such a breakout could offer a substantial short-term trading opportunity.
However, traders are advised to keep a close eye on volume confirmation and key breakout levels to avoid possible fakeouts, as symmetrical triangles can break in either direction.
Will The Meme Coin Explode Or Fizzle Out?
Bonk’s symmetrical triangle pattern has reached a critical stage, raising speculations about whether the meme coin will break free with force or lose steam under pressure. The recent bounce off the support trendline suggests bullish interest is still alive, and if momentum continues to build, BONK could be gearing up for a powerful breakout, potentially delivering gains in the 70–80% range as projected by traders.
However, it’s important to remain cautious. Symmetrical triangles are neutral by nature, meaning a breakdown is still on the table if buyers fail to push through resistance. The next few candles on the 1-hour chart could provide key confirmation of BONK’s direction.
In the end, BONK is approaching a defining moment. Whether it explodes into a bullish run or fizzles out into another rejection will largely depend on volume, sentiment, and the strength of the breakout. Traders should stay alert, as a big move may be closer than it seems.

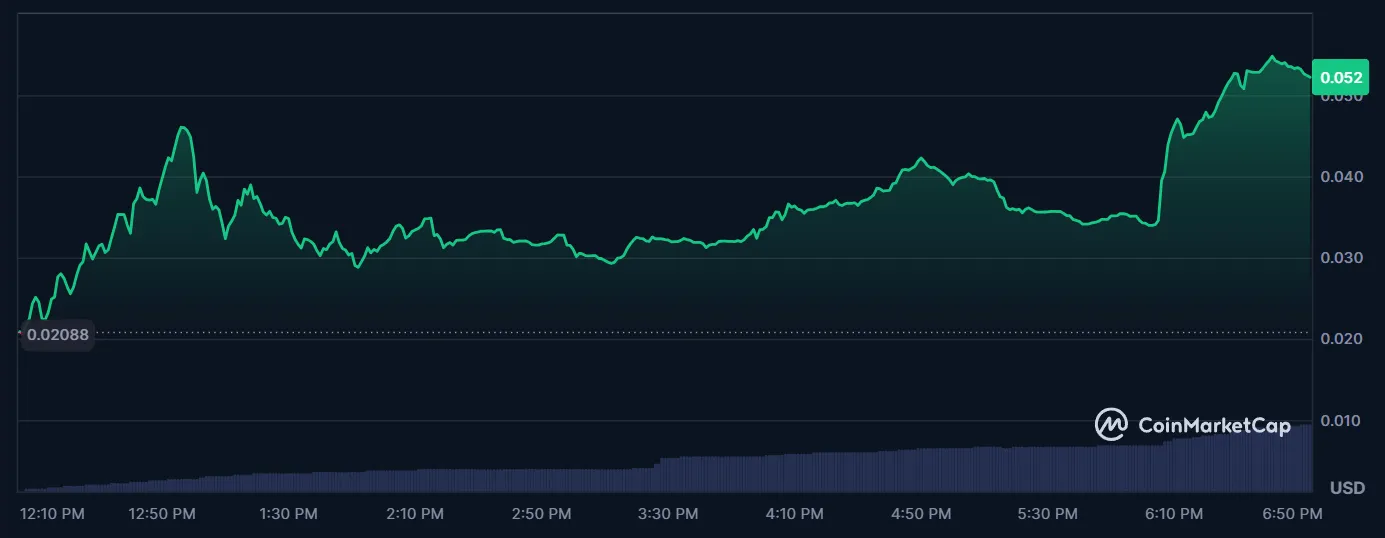
Lorenzo Protocol’s native token, BANK, has recorded a 150% price surge within six hours of its official launch.
The token’s rapid climb follows its listing on multiple platforms, including Binance’s Alpha Market and the launch of a BANKUSDT perpetual contract on Binance Futures with up to 50x leverage.
What is the New BANK Token on Binance Futures?
The Token Generation Event (TGE) for BANK took place today, April 18, via Binance Wallet, in partnership with PancakeSwap. Lorenzo Protocol raised $200,000 through the sale of 42 million BANK tokens—2% of the total supply—priced at $0.0048 each.
The token is now trading on PancakeSwap, Bitget, and CoinEx. Following its debut, BANK reached a market cap of approximately $22 million.
BANK is the governance and utility token for Lorenzo Protocol, a DeFi platform focused on enhancing Bitcoin liquidity.
The protocol allows users to earn yield on BTC without giving up custody. It uses financial primitives like Liquid Principal Tokens (LPTs) and Yield-Accruing Tokens (YATs).
According to its claims, BANK holders can stake their tokens to receive veBANK, which provides governance rights and a share of future emissions.
Also, Lorenzo Protocol is built on a Cosmos-based Ethermint appchain. It enables BTC restaking and interoperability with Bitcoin’s Layer 1. The design supports on-chain issuance and settlement of BTC-backed assets.
The listing of the BANK/USDT perpetual contract on Binance Futures adds further momentum to the token. Binance Futures is a derivatives platform that allows users to trade perpetual contracts with high leverage.
Binance has historically preferred new tokens on the BNB chain for early futures trading. BANK’s sharp price increase and rapid market integration highlight strong early interest in Lorenzo Protocol’s approach to BTC-based DeFi infrastructure.
Currently, it’s far-fetched to project whether the exchange will list this newly launched token. However, Binance’s new community voting on token listing has offered positive hopes for small market cap projects.
Disclaimer
In adherence to the Trust Project guidelines, BeInCrypto is committed to unbiased, transparent reporting. This news article aims to provide accurate, timely information. However, readers are advised to verify facts independently and consult with a professional before making any decisions based on this content. Please note that our Terms and Conditions, Privacy Policy, and Disclaimers have been updated.

HashKey Capital has launched the HashKey XRP Tracker Fund, the first fund in Asia focused exclusively on tracking the performance of XRP.
The fund is now open to professional investors. Ripple is backing the initiative as an early investor.
Institutional Interest in XRP Investment Continues to Grow
According to HashKey, XRP offers a faster and more cost-effective alternative to traditional cross-border payment systems. The new tracker fund aligns with HashKey Capital’s goal of connecting conventional finance with digital asset markets.
The fund allows investors to subscribe using either cash or in-kind contributions. Investors can redeem or subscribe to shares on a monthly basis.
CF Benchmarks, known for its role in global ETF markets, will provide the fund’s benchmark.
“XRP stands out as one of the most innovative cryptocurrencies in today’s market, attracting global enterprises who use it to transact, tokenize, and store value. With the first XRP Tracker Fund available in the region, we simplify access to XRP, catering to the demand for investment opportunities in the very best digital assets,” said Vivien Wong, Partner at HashKey Capital.
Most recently, Ripple acquired prime brokerage platform Hidden Road for $1.25 billion. It was one of the largest acquisition deals in the crypto and blockchain space.
Earlier today, Hidden Road secured a broker-dealer license from the Financial Industry Regulatory Authority (FINRA).
Meanwhile, XRP continues to gain traction with institutional investors. Standard Chartered recently forecast that XRP could surpass Ethereum by 2028, citing increased demand for efficient cross-border payment solutions and growing disruption in global trade.
“XRP is uniquely positioned at the heart of one of the fastest-growing uses for digital assets – facilitation of cross-border and cross-currency payments. In this way, XRPL is similar to the main use case for stablecoins such as Tether. This stablecoin use has grown 50% annually over the past two years, and we expect stablecoin transactions to increase 10x over the next four years. We think this bodes well for XRPL’s throughput growth, given the similar use cases for stablecoins and XRPL,” Geoff Kendrick, Standard Chartered’s Head of Digital Assets Research, told BeInCrypto.
Interest in XRP ETFs is also increasing. Teucrium Investment Advisors recently received NYSE Arca approval for the Teucrium 2x Long Daily XRP ETF (XXRP), the first leveraged XRP ETF in the United States.
Also, attention is now turning to spot XRP ETFs. Grayscale and 21Shares are both awaiting decisions from the SEC on their XRP-based products.
The SEC has up to 240 days to review the Grayscale XRP Trust and the 21Shares Core XRP Trust, with final deadlines set for October 18 and 19, 2025.
XRP’s price has declined by nearly 20% over the past month, but institutional confidence remains high.
Ripple recently confirmed progress in resolving its long-standing legal battle with the SEC. A joint motion to pause court proceedings was approved, giving both parties 60 more days to finalize a settlement.
Disclaimer
In adherence to the Trust Project guidelines, BeInCrypto is committed to unbiased, transparent reporting. This news article aims to provide accurate, timely information. However, readers are advised to verify facts independently and consult with a professional before making any decisions based on this content. Please note that our Terms and Conditions, Privacy Policy, and Disclaimers have been updated.

BONK Symmetrical Triangle Squeeze: Is A Mega Breakout Imminent?

XRP Price History Signals July As The Next Bullish Month
BANK Token Surges 150% After Binance Futures Listing

Asia’s First XRP Investment Fund is Here, Backed by Ripple

What Does This Mean for Altcoins?
How $31 Trillion in US Bonds Could Impact Crypto Markets in 2025

2.52 Million Altcoins Are Ruining Crypto’s Future

Animoca Brands Valuation Tanks 75% In Two Years, Here’s Why

Crypto exchange BingX hacked for $43 million

Are The Big Players Losing Interest?

Hong Kong’s Securities Association Tips Authorities On Crypto Self-Regulation

Coinbase cbBTC Set to go Live on Solana
2.52 Million Altcoins Are Ruining Crypto’s Future
Animoca Brands Valuation Tanks 75% In Two Years, Here’s Why
Crypto exchange BingX hacked for $43 million
Are The Big Players Losing Interest?
Hong Kong’s Securities Association Tips Authorities On Crypto Self-Regulation
Coinbase cbBTC Set to go Live on Solana
-
 Altcoin16 hours ago
Expert Predicts Pi Network Price Volatility After Shady Activity On Banxa
-

 Market21 hours ago
Binance Leads One-Third of the CEX Market in Q1 2025
-
 Altcoin20 hours ago
Dogecoin Price Breakout in view as Analyst Predicts $5.6 high
-

 Ethereum20 hours ago
Ethereum Investors Suffer More Losses Than Bitcoin Amid Ongoing Market Turmoil
-
 Altcoin19 hours ago
Tron Founder Justin Sun Reveals Plan To HODL Ethereum Despite Price Drop
-

 Ethereum24 hours ago
Ethereum Whales Offload 143,000 ETH In One Week – More Selling Ahead?
-

 Market16 hours ago
Ethereum Price Fights for Momentum—Traders Watch Key Resistance
-

 Market22 hours ago
Crypto Ignores ECB Rate Cuts, Highlighting EU’s Fading Influence