
Market
HBAR Price Continues to Decline Amid Strong Bearish Pressure

Hedera (HBAR) price has dropped 5% in the last 24 hours, with an overall 22% correction in the past 30 days. Its market cap is now at $8.5 billion. Technical indicators suggest that bearish momentum is still dominant, though signs of a potential shift are emerging.
The ADX shows that the ongoing downtrend is losing strength, while the Ichimoku Cloud confirms that sellers remain in control for now. If HBAR can sustain its recovery and break key resistance levels, a stronger uptrend could develop, but failure to do so may lead to further declines.
HBAR ADX Shows The Downtrend Is Stable and Not As Strong As Before
Hedera ADX is currently at 23, down from 28.9 three days ago, and has remained below 25. This decline suggests that the strength of the ongoing trend is weakening, with sellers losing some momentum.
Since ADX measures trend strength rather than direction, a falling ADX in a downtrend indicates that bearish pressure is slowing, though not yet reversing.
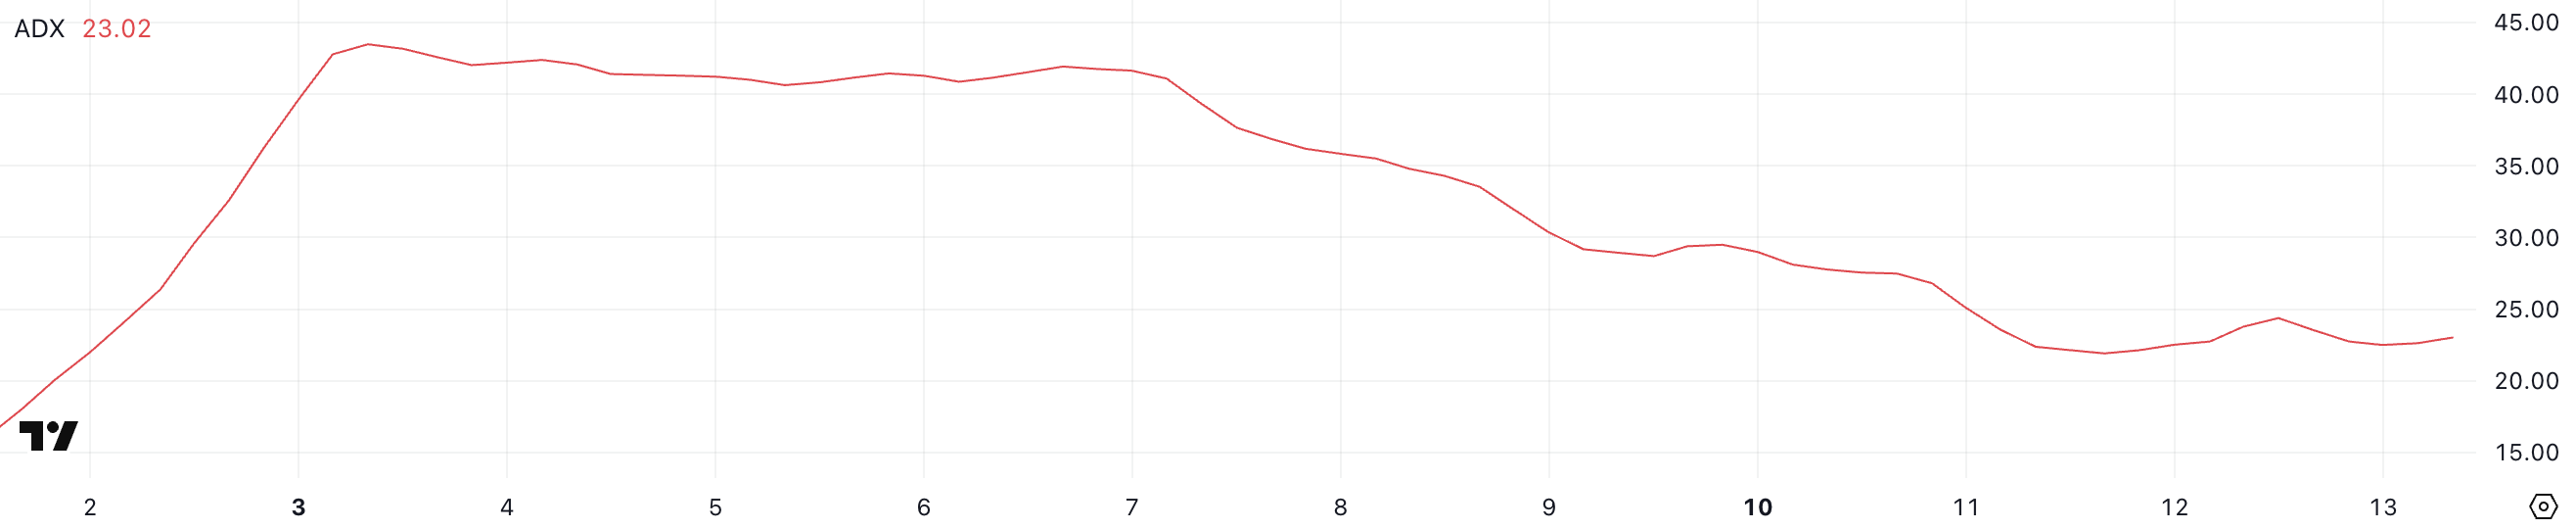
ADX values below 20 signal weak trends, while those above 25 suggest strong, established movement. With HBAR’s ADX at 23, the downtrend is still present but losing intensity.
If ADX continues to decline, price action could shift toward consolidation rather than further downside acceleration. However, without stronger HBAR buying pressure, a clear trend reversal remains uncertain.
HBAR Ichimoku Cloud Shows a Bearish Setup, But This Could Change Soon
HBAR Ichimoku Cloud chart is showing a bearish setup, with price action remaining below the cloud.
The red cloud suggests that bearish momentum has dominated, and multiple attempts to move above it have been rejected. The Tenkan-sen (blue line) is positioned below the Kijun-sen (red line), reinforcing the ongoing weakness.
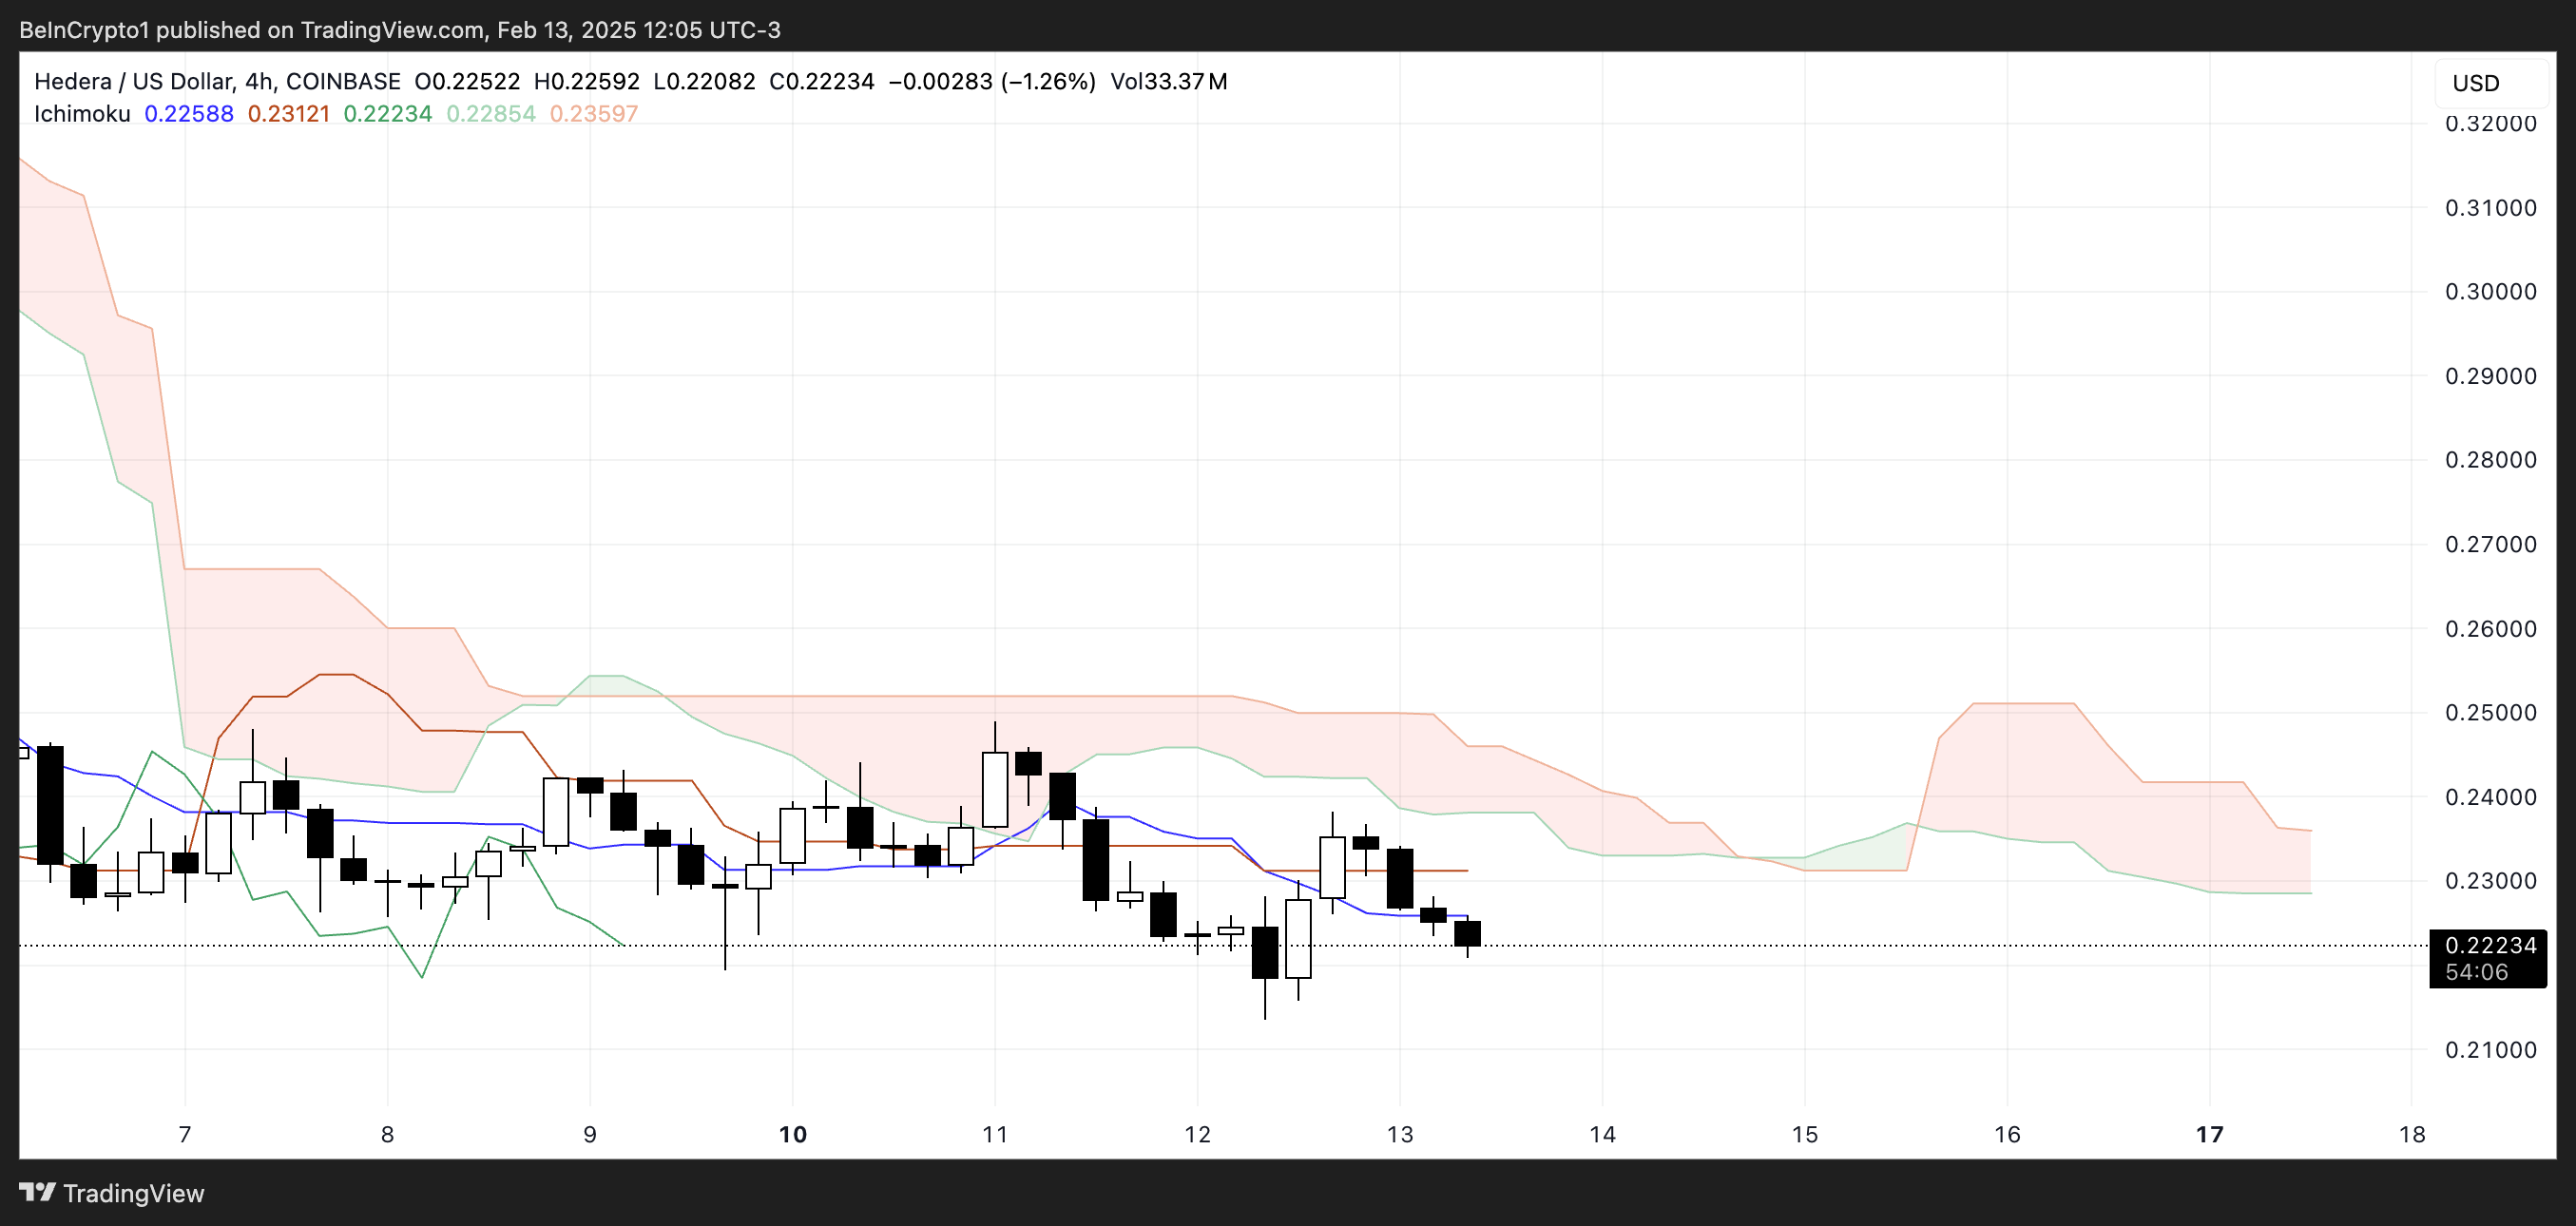
The projected cloud remains bearish, with the Senkou Span A (green line) below the Senkou Span B (red line), signaling continued downward pressure, though the distance between then is narrowing.
The Chikou Span (green lagging line) is also below the past price action, confirming that the market structure still favors sellers. Unless HBAR buyers step in with stronger momentum, the trend remains intact, and bearish continuation is likely.
HBAR Price Prediction: Can Hedera Reclaim $30 In February?
Hedera EMA lines show that short-term trends remain below long-term ones, reinforcing the current bearish setup. This alignment suggests that sellers are still in control, keeping downward pressure on price action.
If this bearish trend strengthens again, HBAR price could drop further, potentially testing the support at $0.179, which would represent a 19% decline from current levels.
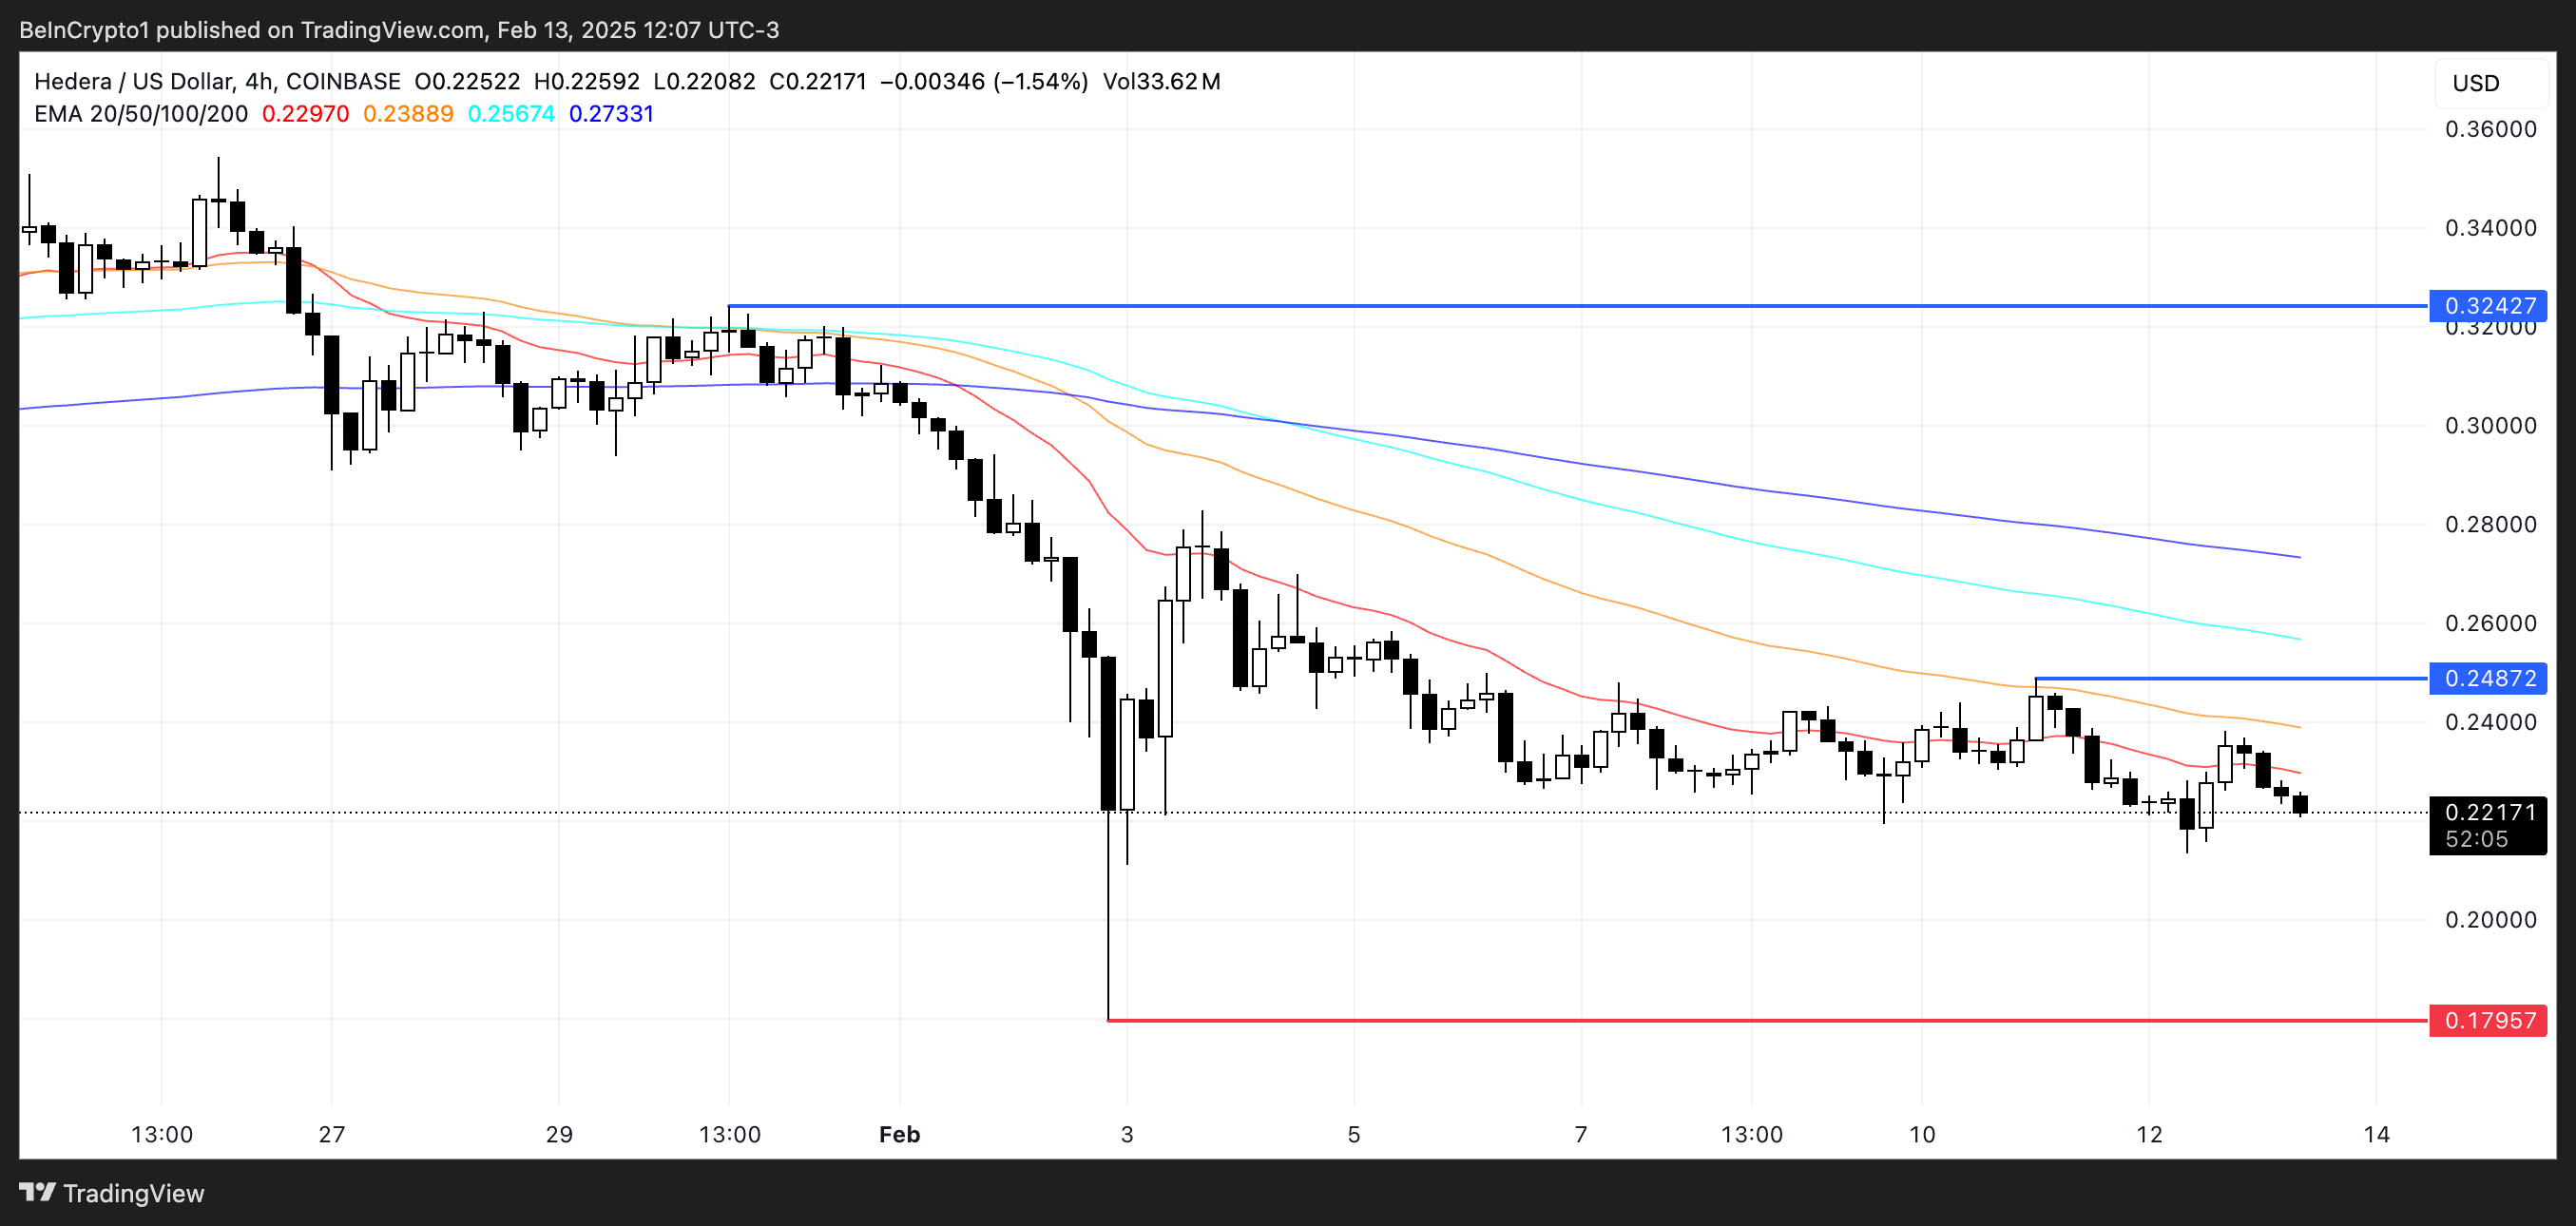
However, if HBAR price can reverse this trend and gain bullish momentum, it could challenge the resistance at $0.248.
A breakout above this level could lead to a stronger recovery, pushing the price toward $0.32, marking a 46% upside. To confirm a shift in trend, buyers would need to sustain momentum and establish price action above key resistance zones.
Disclaimer
In line with the Trust Project guidelines, this price analysis article is for informational purposes only and should not be considered financial or investment advice. BeInCrypto is committed to accurate, unbiased reporting, but market conditions are subject to change without notice. Always conduct your own research and consult with a professional before making any financial decisions. Please note that our Terms and Conditions, Privacy Policy, and Disclaimers have been updated.


The TRUMP meme coin has lost 29% of its value over the past month and is now down more than 90% from its all-time high. The sharp decline has been accompanied by weakening momentum across multiple indicators.
Both suggest that bullish strength has faded and downside risks are growing. Adding to the pressure, a large wallet just withdrew millions in USDC ahead of a $317 million token unlock next week, raising concerns about possible selling activity.
Indicators Suggest Weak Momentum for TRUMP Meme Coin
TRUMP’s BBTrend indicator has sharply dropped to 1.58, down from 6.23 just two days ago. This sudden decline suggests that the strength of the previous trend has significantly weakened.
After showing strong momentum earlier in the week, the current BBTrend reading points to a possible shift toward consolidation or even a reversal if buying interest continues to fade.
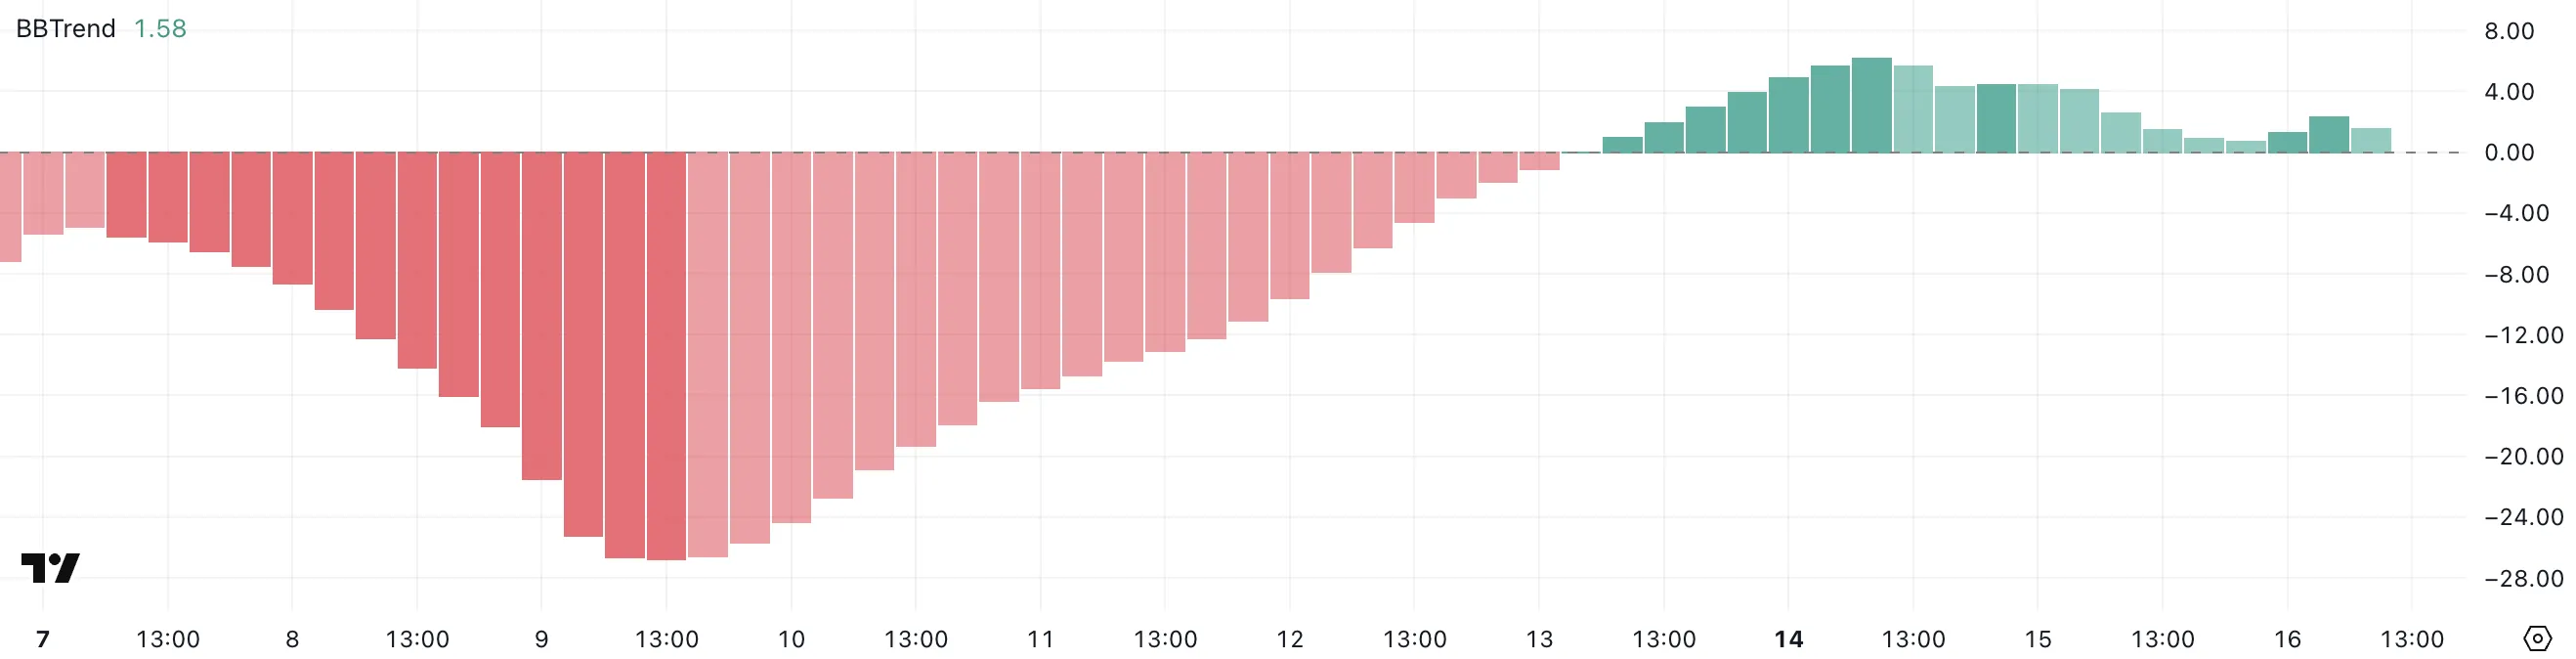
BBTrend, short for Bollinger Band Trend, is a technical indicator that measures the strength of a price trend based on the width of Bollinger Bands.
Higher values typically indicate a strong directional move, while lower values suggest that the market is entering a less volatile phase.
With TRUMP’s BBTrend now at 1.58—close to the neutral zone—it could signal that the strong bullish phase is cooling off. If the indicator continues to fall and the price loses support, it may point to a period of sideways movement or the beginning of a downtrend.
TRUMP’s Ichimoku Cloud chart shows a clear bearish setup. The price is currently trading below both the blue Tenkan-sen (conversion line) and the red Kijun-sen (baseline).

This positioning suggests that short-term momentum remains weak, and buyers have yet to regain control.
The fact that price candles are still beneath the cloud reinforces the ongoing bearish sentiment, as the cloud often acts as resistance when prices are below it.
Looking ahead, the cloud (Kumo) is transitioning from red to green but remains flat and narrow, signaling limited upside strength. The green Senkou Span A is only slightly above the red Senkou Span B, meaning the future trend outlook is still uncertain and lacks conviction.
For any bullish reversal to gain traction, TRUMP meme coin would need to break above the cloud with strong volume. Until that happens, the chart points to continued caution, with the potential for more sideways or downward price action.
Whale Withdrawal Raises Concerns Ahead of $317 Million TRUMP Unlock
A wallet linked to Donald Trump’s memecoin withdrew $4.6 million in USDC from the Solana DEX Meteora on Tuesday.
These funds were previously used to provide liquidity for the TRUMP-USDC trading pair. They helped ensure smoother trading and price stability. This wallet has made a withdrawal for the first time, and the size and timing of the move make it noteworthy.
Even after the withdrawal, the pool still holds around $205 million in USDC and $122 million in TRUMP tokens.

This activity comes just days before a major unlock event set for next Friday. Around $317 million worth of TRUMP meme coin tokens will become available.
Unlocks often worry investors as they increase token supply. If a large portion is sold, it can push prices down. The $4.6 million withdrawal has raised speculation about insider moves. Some believe funds are being repositioned ahead of the unlock.
While it’s not clear if a selloff is coming, the timing suggests caution. In the days ahead, on-chain activity should be closely watched.
Disclaimer
In line with the Trust Project guidelines, this price analysis article is for informational purposes only and should not be considered financial or investment advice. BeInCrypto is committed to accurate, unbiased reporting, but market conditions are subject to change without notice. Always conduct your own research and consult with a professional before making any financial decisions. Please note that our Terms and Conditions, Privacy Policy, and Disclaimers have been updated.

Crypto users often focus on user interfaces and pay less attention to the complex internal protocols. Security experts recently raised concerns about a critical vulnerability in Crypto-MCP (Model-Context-Protocol), a protocol for connecting and interacting with blockchains.
This flaw could allow hackers to steal digital assets. They could redirect transactions or expose the seed phrase — the key to accessing a crypto wallet.
How Dangerous is the Crypto-MCP Vulnerability?
Crypto-MCP is a protocol designed to support blockchain tasks. These tasks include querying balances, sending tokens, deploying smart contracts, and interacting with decentralized finance (DeFi) protocols.
Protocols like Base MCP from Base, Solana MCP from Solana, and Thirdweb MCP offer powerful features. These include real-time blockchain data access, automated transaction execution, and multi-chain support. However, the protocol’s complexity and openness also introduce security risks if not properly managed.
Developer Luca Beurer-Kellner first raised the issue in early April. He warned that an MCP-based attack could leak WhatsApp messages via the protocol and bypass WhatsApp’s security.
Following that, Superoo7—head of Data and AI at Chromia—investigated and reported a potential vulnerability in Base-MCP. This issue affects Cursor and Claude, two popular AI platforms. The flaw allows hackers to use “prompt injection” techniques to change the recipient address in crypto transactions.
For example, if a user tries to send 0.001 ETH to a specific address, a hacker can insert malicious code to redirect the funds to their wallet. What’s worse, the user may not notice anything wrong. The interface will still show the original intended transaction details.
“This risk comes from using a ‘poisoned’ MCP. Hackers could trick Base-MCP into sending your crypto to them instead of where you intended. If this happens, you might not notice,” Superoo7 said.

Developer Aaronjmars pointed out an even more serious issue. Wallet seed phrases are often stored unencrypted in the MCP configuration files. If hackers gain access to these files, they can easily steal the seed phrase and fully control the user’s wallet and digital assets.
“MCP is an awesome architecture for interoperability & local-first interactions. But holy shit, current security is not tailored for Web3 needs. We need better proxy architecture for wallets,” Aaronjmars emphasized.
So far, no confirmed cases of this vulnerability being exploited to steal crypto assets exist. However, the potential threat is serious.
According to Superoo7, users should protect themselves by using MCP only from trusted sources, keeping wallet balances minimal, limiting MCP access permissions, and using the MCP-Scan tool to check for security risks.
Hackers can steal seed phrases in many ways. A report from Security Intelligence at the end of last year revealed that an Android malware called SpyAgent targets seed phrases by stealing screenshots.
Kaspersky also discovered SparkCat malware that extracts seed phrases from images using OCR. Meanwhile, Microsoft warned about StilachiRAT, malware that targets 20 crypto wallet browser extensions on Google Chrome, including MetaMask and Trust Wallet.
Disclaimer
In adherence to the Trust Project guidelines, BeInCrypto is committed to unbiased, transparent reporting. This news article aims to provide accurate, timely information. However, readers are advised to verify facts independently and consult with a professional before making any decisions based on this content. Please note that our Terms and Conditions, Privacy Policy, and Disclaimers have been updated.

After suffering a historic price collapse, Mantra’s OM is making a remarkable comeback. The altcoin plunged over 90% on April 13, falling from $6.30 to under $0.50 in hours.
However, it has bounced back with a 25% gain over the past 24 hours. OM is currently the market’s top gainer and is poised to extend its gains in the short term.
OM Leads Market Gains With a 25% Jump
The sudden resurgence in investor interest in OM comes after an April 15 X post from Mantra CEO John Patrick Mullin, announcing plans to burn the team’s token allocation.
While plans for the token burn are still being finalized, Mullin’s announcement has calmed market fears and revived bullish sentiment among some traders. This renewed confidence has prompted increased OM accumulation, driving the token’s price up by over 25% in the past 24 hours.
Key on-chain and market metrics support the rebound narrative. For example, the token’s open interest has risen sharply by 9%, indicating a surge in fresh capital entering OM positions in the past 24 hours.
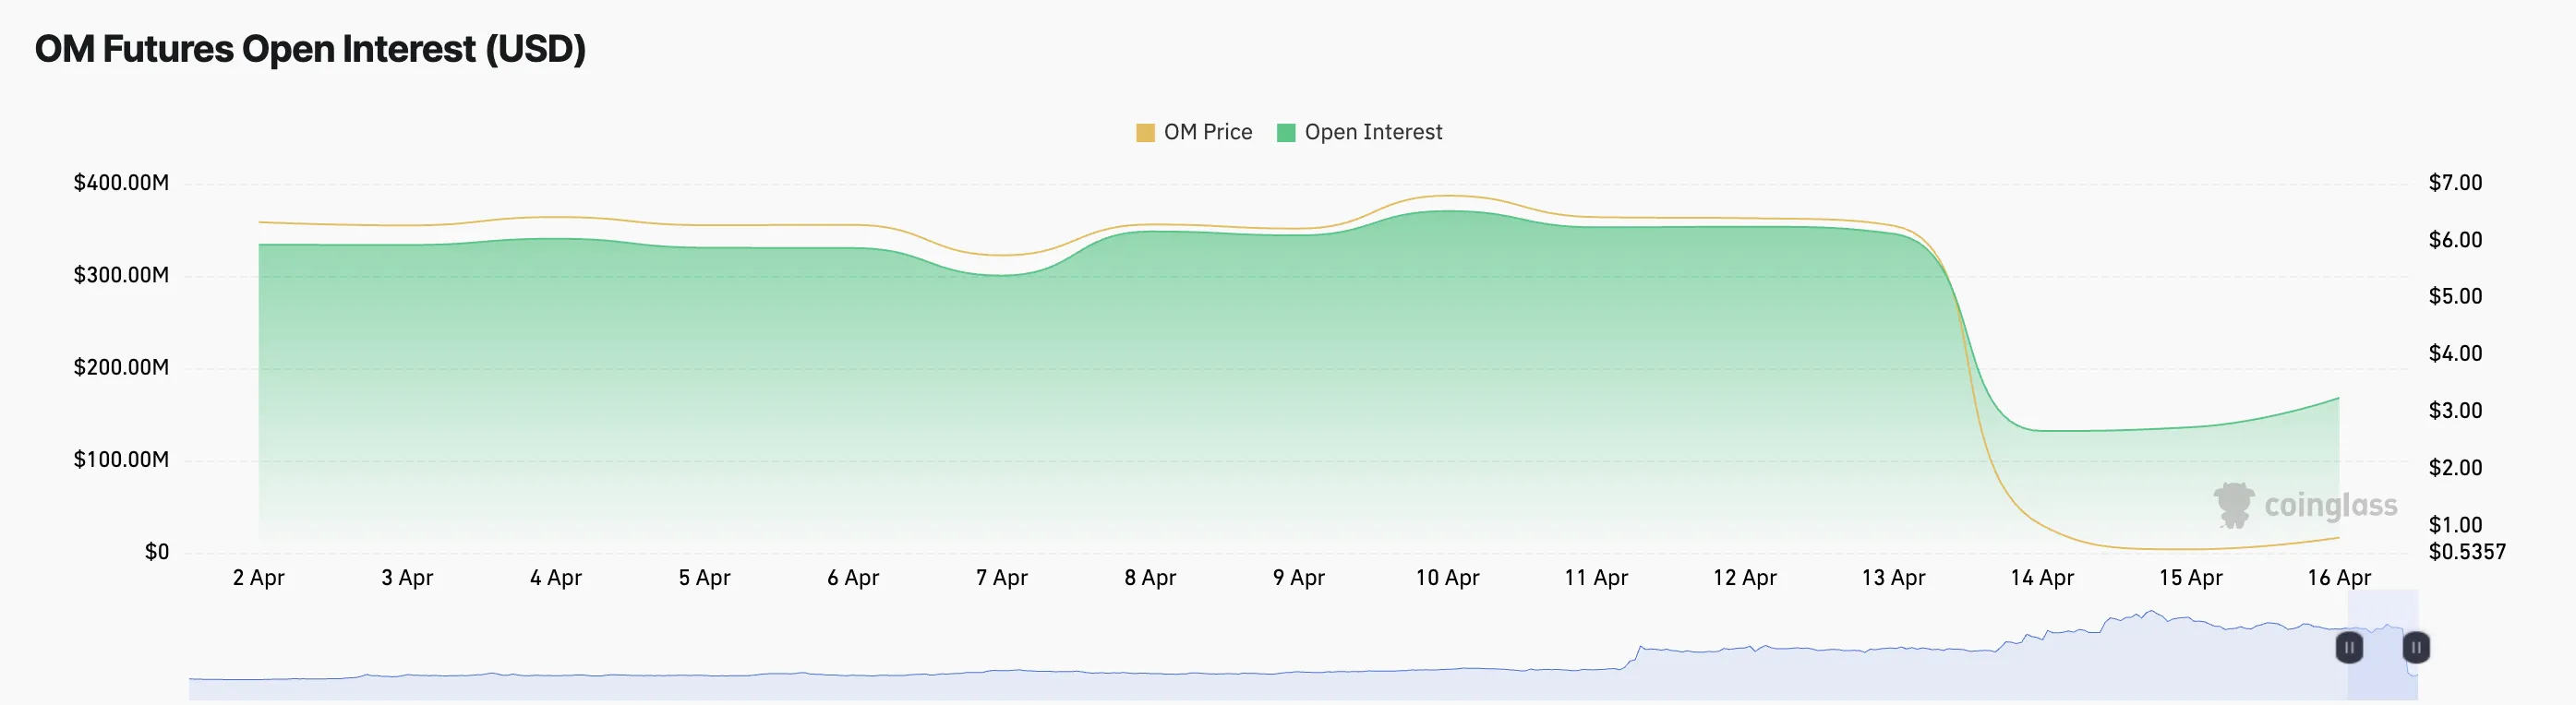
As of this writing, this stands at $156.74 million. When an asset’s open interest climbs alongside its price like this, it signals that new money is entering the market and that traders are opening fresh positions in the direction of the uptrend.
Moreover, OM’s long/short ratio confirms this. As of this writing, it is currently at 1.02, highlighting the preference for long positions among futures traders.
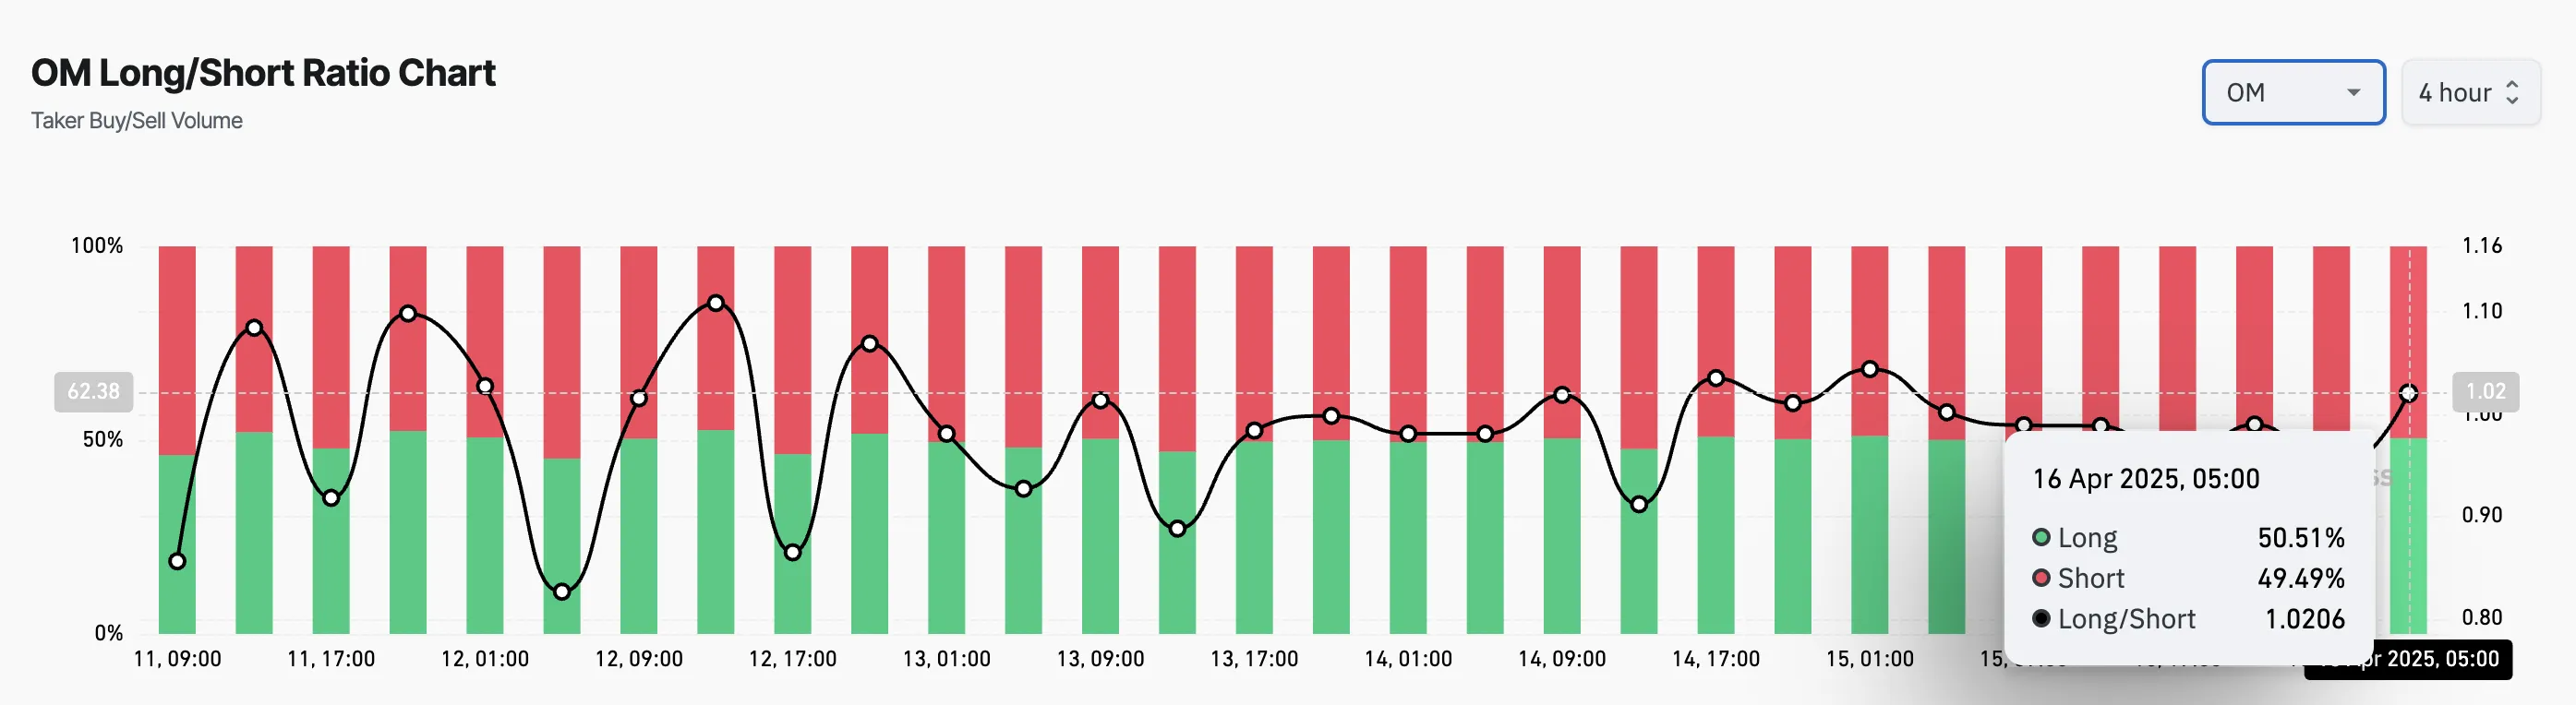
An asset’s long/short ratio measures the proportion of its long positions to short ones in the market.
A ratio above one like this means there are more positions betting on a sustained OM price rally than those opened in favor of a decline.
Next Stop $2.64 or Back to January’s $0.09 Lows?
At press time, OM trades at $0.78, climbing 29% from April 13’s low of $0.50. With the gradual uptick in its buying pressure, the altcoin could maintain its current rally to trade at $2.64.
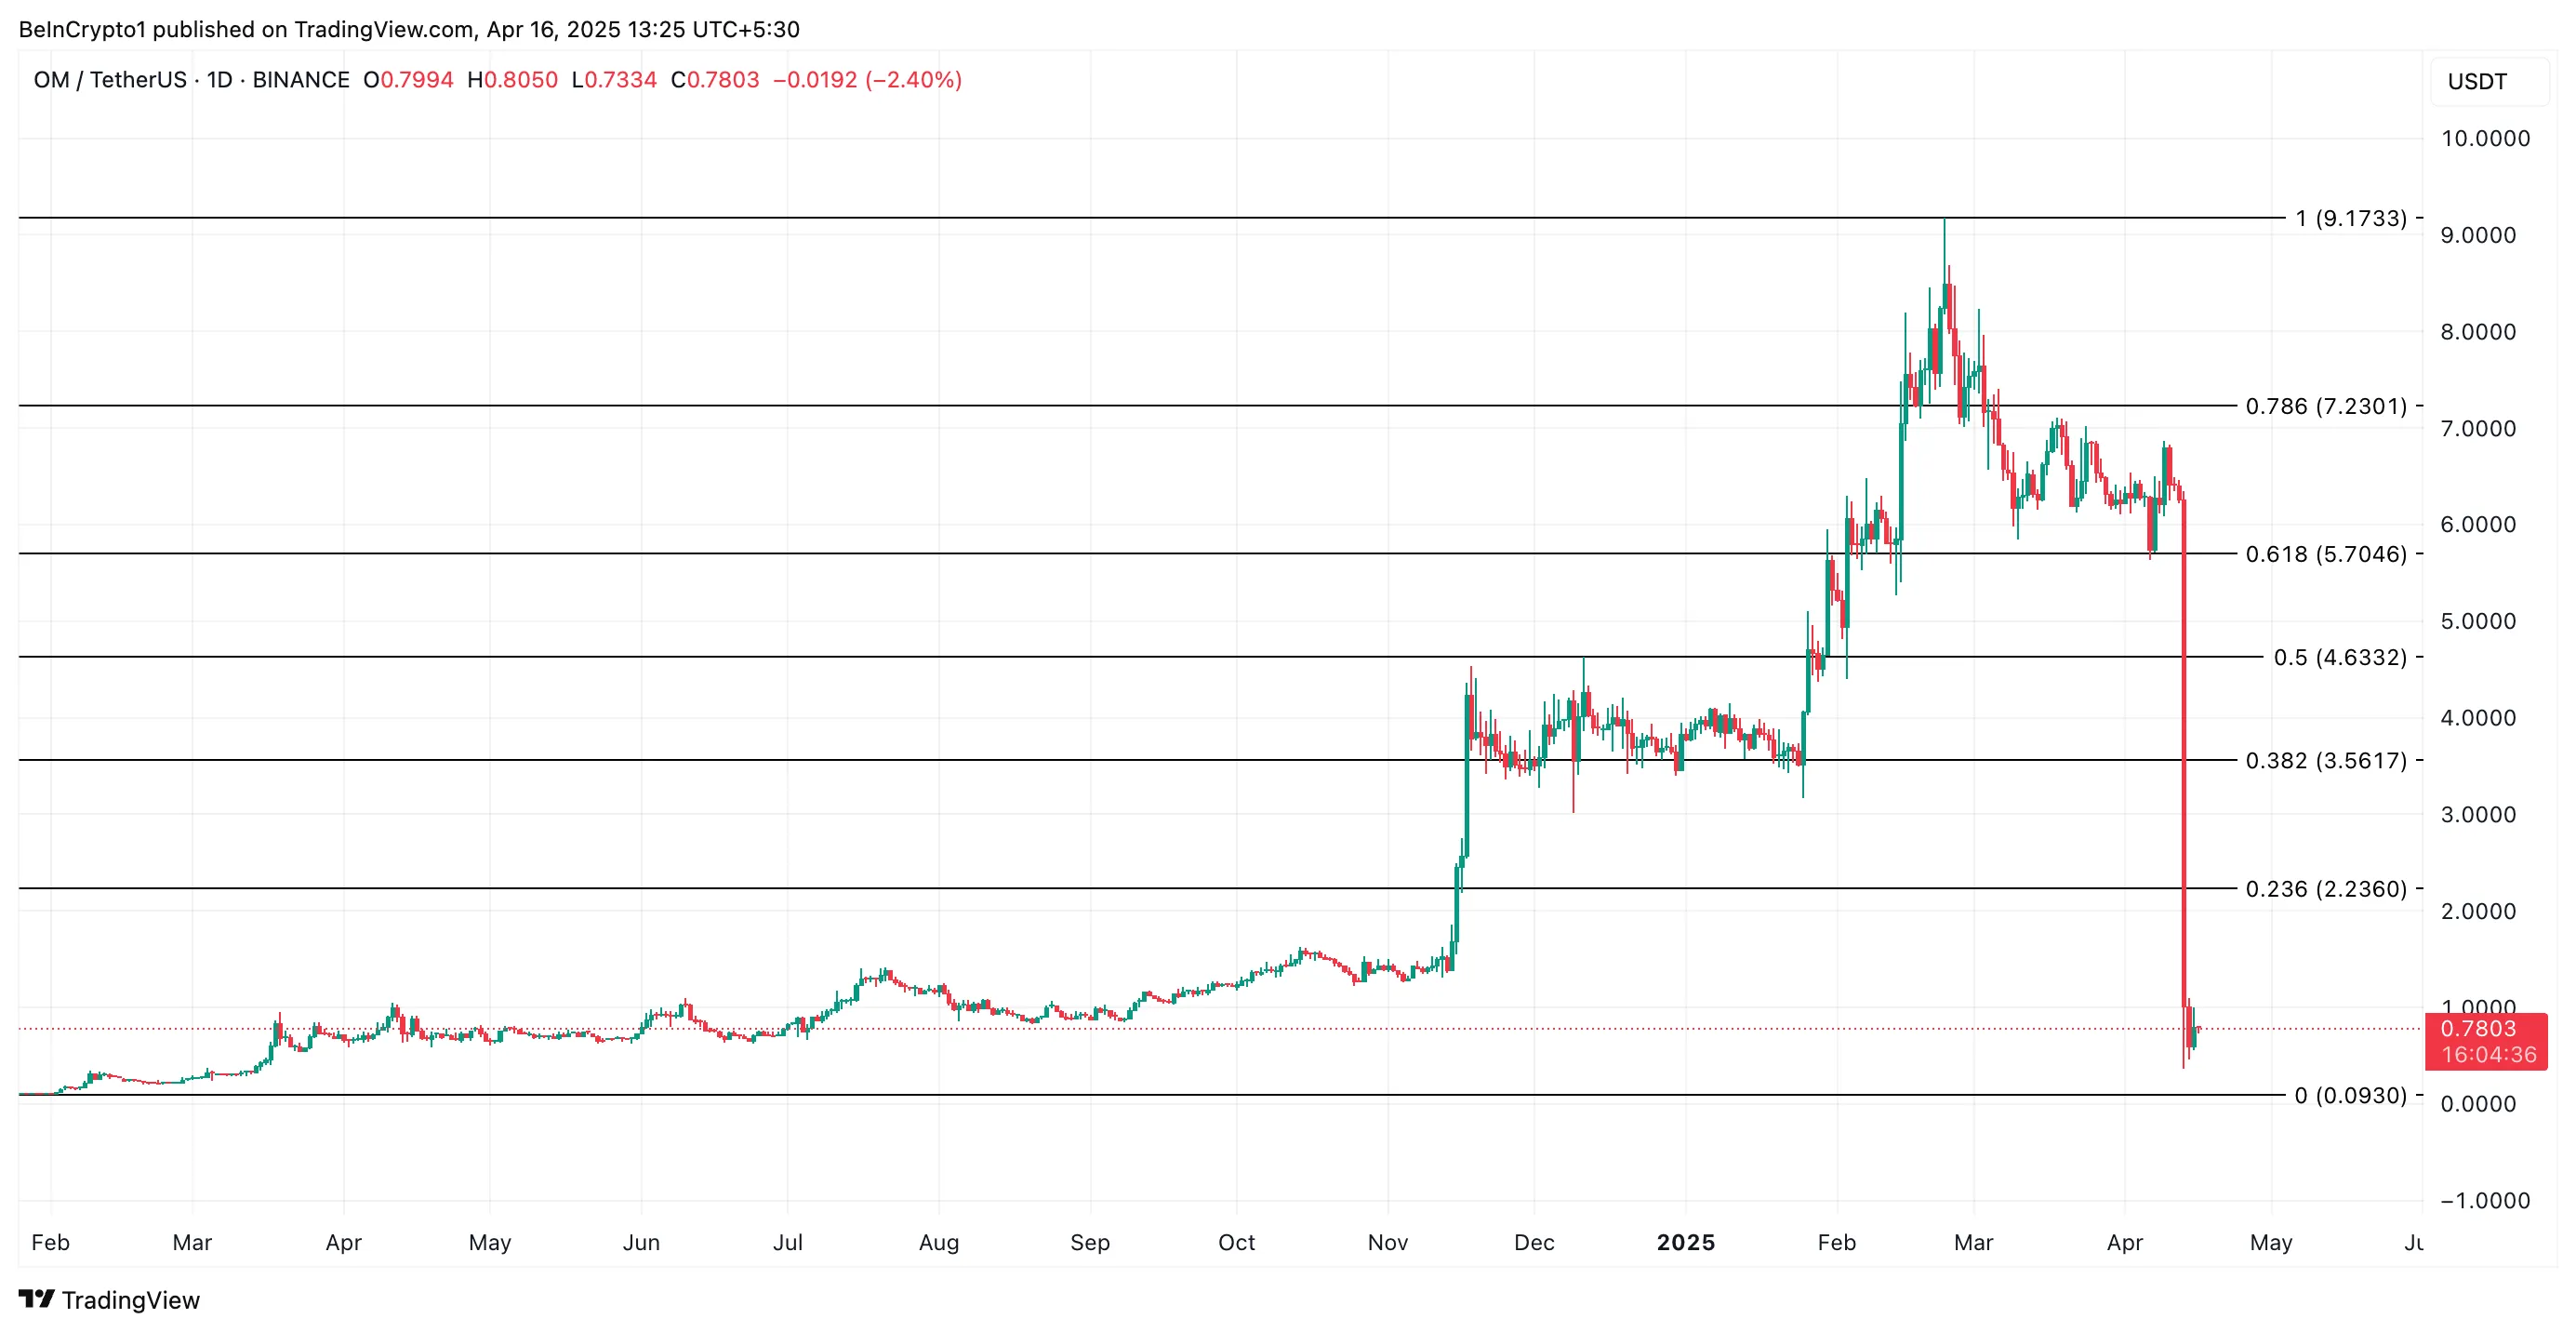
However, if the bears regain market control and increase the downward pressure on OM, it could extend its decline and fall to $0.09, a low it last reached in January 2024.
Disclaimer
In line with the Trust Project guidelines, this price analysis article is for informational purposes only and should not be considered financial or investment advice. BeInCrypto is committed to accurate, unbiased reporting, but market conditions are subject to change without notice. Always conduct your own research and consult with a professional before making any financial decisions. Please note that our Terms and Conditions, Privacy Policy, and Disclaimers have been updated.
Are TRUMP Meme Coin Investors Selling Before Friday’s Unlock?

Mantra (OM) Price Pumps As Founder Reveals Massive Token Burn Plan

This Crypto Security Flaw Could Expose Seed Phrases
Mantra’s OM Token Surges 25% After Token Burn Announcement

BNB Burn Reduces Circulating Supply by $916 Million

Ethereum Breakout Imminent? Analyst Expects ETH Price Surge To $2,000


-

 Market23 hours ago
Trump Family Plans Crypto Game Inspired by Monopoly
-

 Altcoin24 hours ago
Whispers Of Insider Selling As Mantra DAO Relocates Nearly $27 Million In OM To Binance
-

 Market20 hours ago
Bitcoin Eyes $90,000, But Key Resistance Levels Loom
-

 Market22 hours ago
ETH Retail Traders Boost Demand Despite Institutional Outflows
-
 Altcoin22 hours ago
Could Tomorrow’s Canada Solana ETF Launch Push SOL Price to $200?
-

 Market16 hours ago
Solana (SOL) Jumps 20% as DEX Volume and Fees Soar
-

 Market15 hours ago
Hedera Under Pressure as Volume Drops, Death Cross Nears
-

 Market24 hours ago
Forget XRP At $3, Analyst Reveals How High Price Will Be In A Few Months

 Arabic
 Chinese (Simplified)
 Dutch
Dutch English
 French
 German
 Italian
 Portuguese
 Russian
 Spanish
 Vietnamese