
Market
Has Bitcoin (BTC) Price Topped For This Cycle?
Bitcoin (BTC) is at a critical point in its current cycle, with signs that it may be diverging from past halving patterns. Unlike previous cycles, where strong rallies followed halvings, this one has been more uncertain. Bitcoin’s market movements are now largely shaped by macroeconomic shifts and new institutional influences.
Political factors, such as Trump’s pro-crypto stance and state-level Bitcoin adoption, have also added unexpected variables. With these new dynamics in play, the question remains: has Bitcoin already topped the cycle? Or is there still room for another rally beyond $100,000?
Has BTC Detached From Other Cycles?
The current Bitcoin cycle appears to be diverging from previous ones. It’s showing a different price trajectory compared to past halvings.
Historically, Bitcoin experienced strong rallies at this point in the cycle, particularly in the 2012-2016 and 2016-2020 phases.
However, this cycle saw a surge beginning in October 2024 and December 2024, followed by consolidation in January 2025 and a correction by late February.
This contrasts with prior cycles, where Bitcoin continued rallying aggressively post-halving. The deviation suggests that macroeconomic factors, market structure changes, and the growing presence of institutional investors may be altering Bitcoin’s traditional cycle dynamics.
Unlike the retail-driven speculative booms of past halvings, Bitcoin is now treated as a more mature asset class, which influences its price movement.
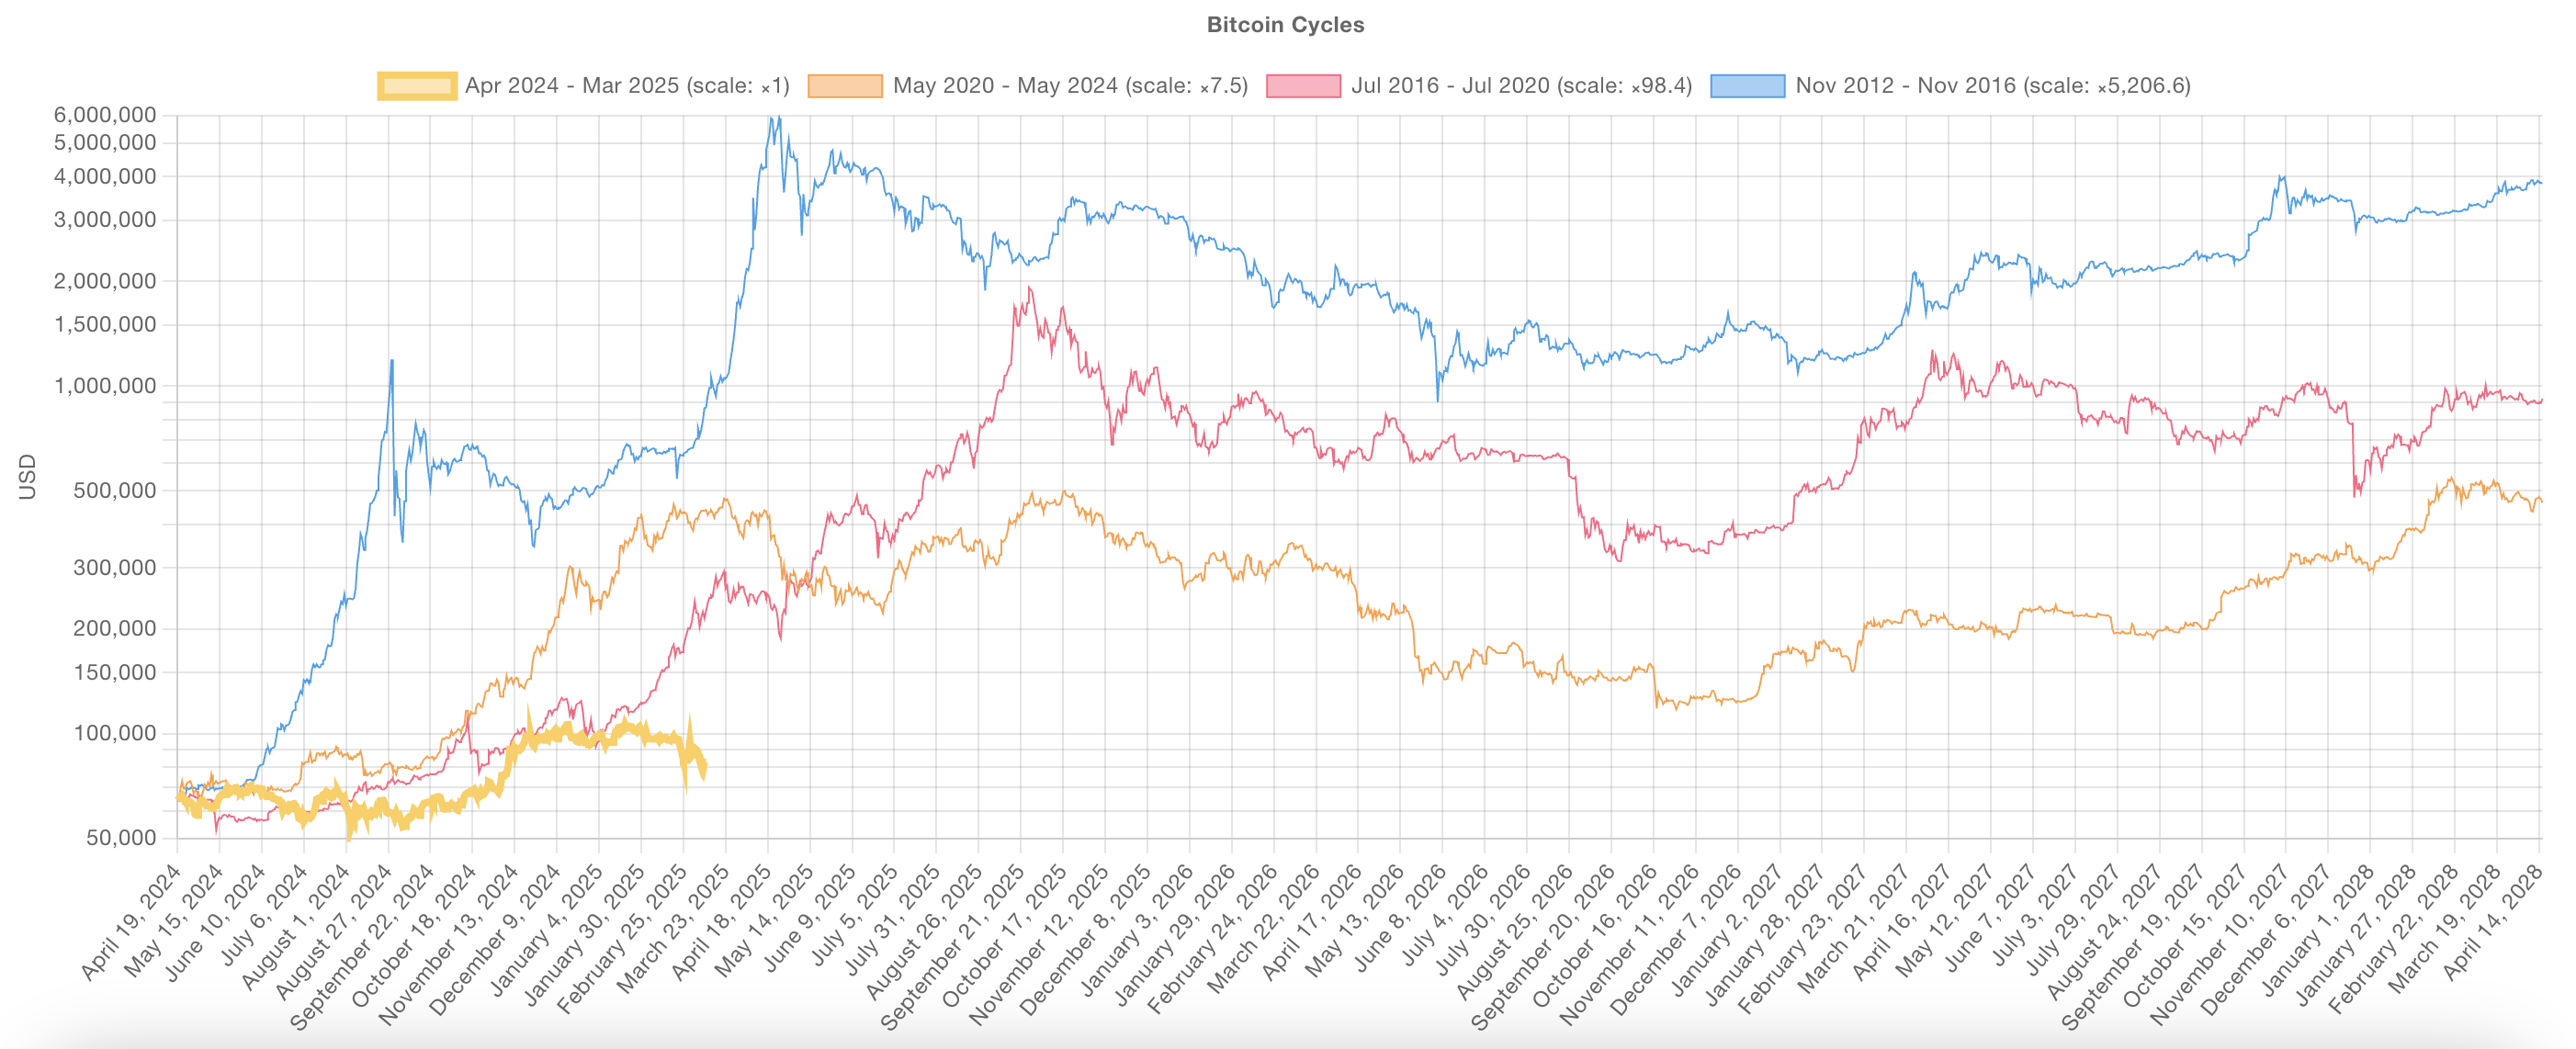
Another key factor is the diminishing strength of Bitcoin’s surges as cycles progress. The exponential rallies seen in 2012-2016 and 2016-2020 far exceeded those of the 2020-2024 cycle and the current one.
While this is expected due to Bitcoin’s increasing market capitalization, it also reflects the growing influence of institutional investors, banks, and even governments. In the long term, it’s likely to introduce more stability and structured market behavior.
Despite these shifts, previous cycles also had periods of consolidation and correction before resuming their uptrend. If Bitcoin follows that precedent, this phase could be a temporary reset before another upward move.
However, given the structural changes in the market, this cycle could unfold differently, with less extreme volatility but a more prolonged and sustainable price appreciation rather than the explosive parabolic tops of the past.
Long-Term Holder MVRV Signals a Shift in Cycle Dynamics
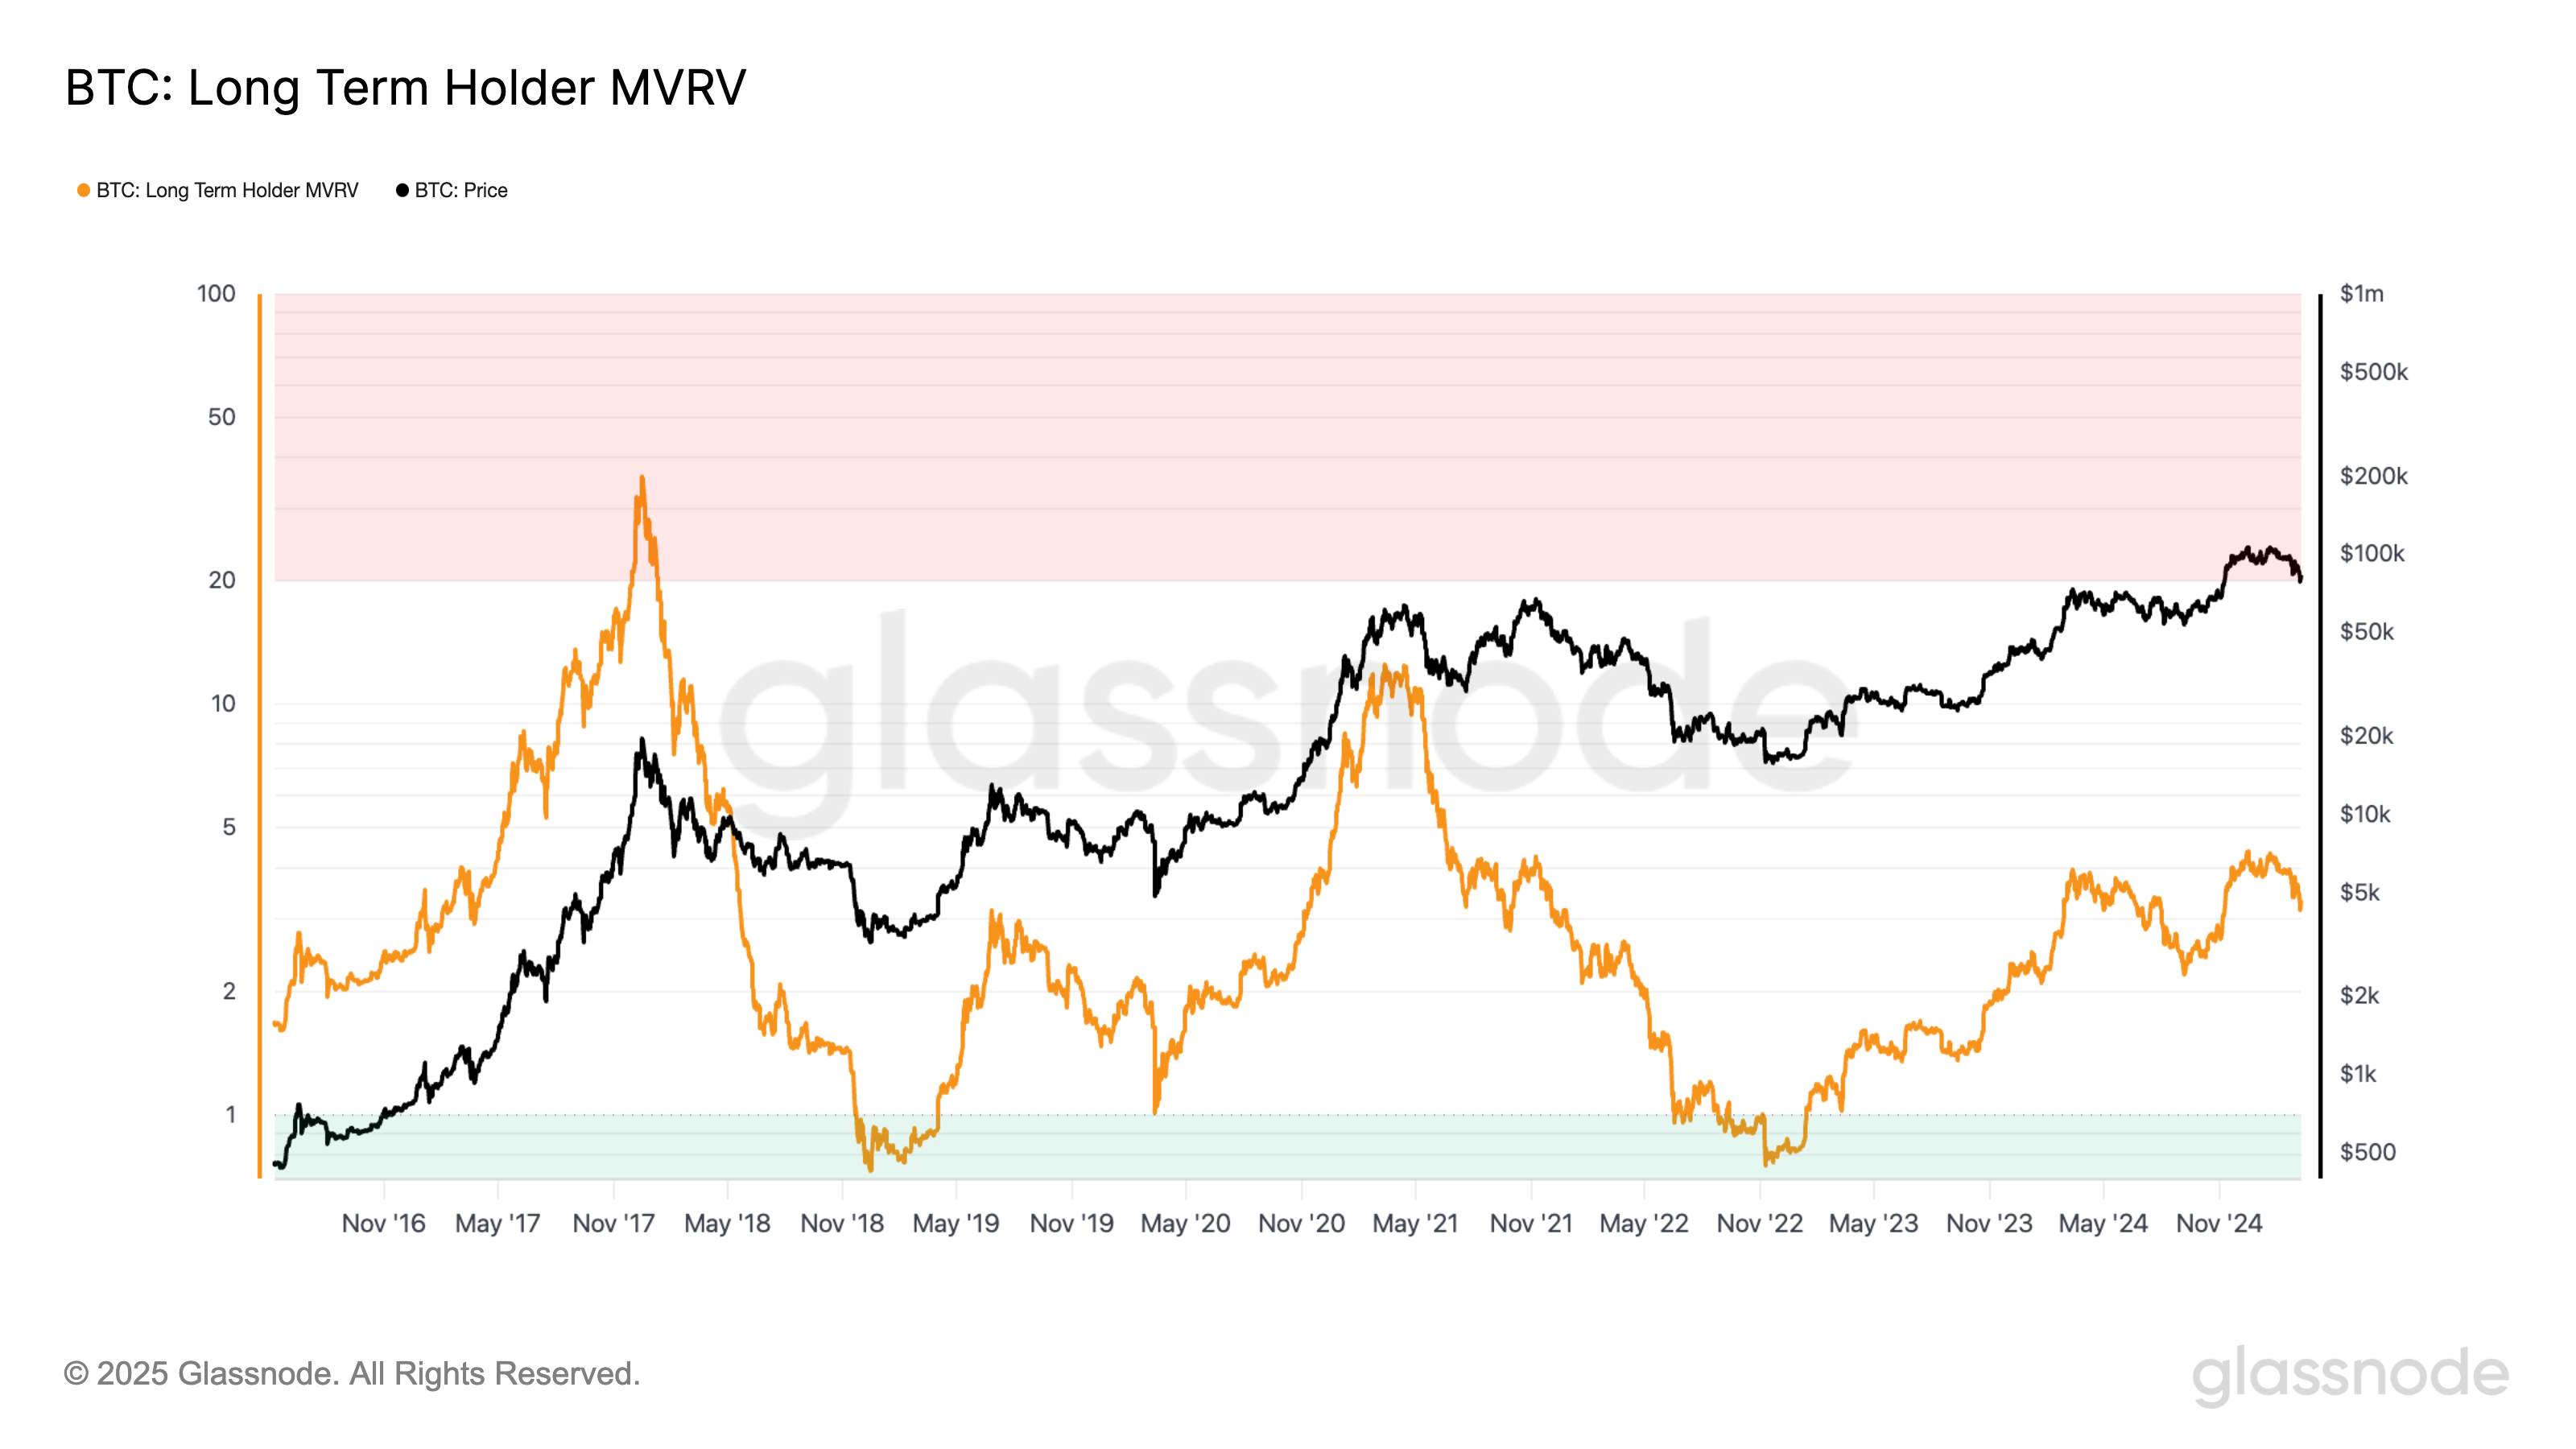
Bitcoin’s Long-Term Holder (LTH) MVRV ratio clearly demonstrates a pattern of diminishing returns across cycles. In the 2016-2020 cycle, LTH MVRV peaked at 35.8, reflecting an extreme level of unrealized profit among long-term holders before distribution began.
By the 2020-2024 cycle, this peak had dropped significantly to 12.2. It showed a lower overall multiple of unrealized profits despite Bitcoin reaching new all-time highs.
In the current cycle, LTH MVRV has so far only peaked at 4.35, indicating that long-term holders have not seen nearly the same level of liquid profits as in past cycles.
This sharp decline across cycles suggests that Bitcoin’s upside potential is compressing over time, which aligns with the broader trend of diminishing returns as the asset matures and market structure changes.
This data implies that Bitcoin’s cyclical growth phases are becoming less explosive. This is likely due to the increasing influence of institutional investors and a more efficient market.
As the market cap expands, significantly more capital inflows are required to drive the same percentage gains seen in early cycles.
While this could suggest that Bitcoin’s long-term growth is stabilizing, it does not necessarily confirm that the cycle has already peaked.
Previous cycles have had periods of consolidation before reaching final highs. Also, institutional participation could lead to more prolonged accumulation phases rather than sudden blow-off tops.
However, if diminishing MVRV peaks continue, it could mean Bitcoin’s ability to deliver extreme cycle-based returns is fading, and this cycle may already be past its most aggressive growth phase.
Bitcoin’s Long-Term Outlook
Despite the differences in this cycle, experts remain optimistic about Bitcoin’s long-term prospects, particularly with increasing adoption at the state level.
Harrison Seletsky, director of business development at SPACE ID, told BeInCrypto:
“Expectations were running high ahead of Friday’s White House Crypto Summit, but the aftermath was somewhat anticlimactic. The market didn’t react with as much excitement since the US is currently holding their confiscated BTC instead of actively buying more. However, there’s a lot more to be excited about than the market is pricing in. It’s encouraging to see that not only has President Trump signed an executive order for a crypto reserve – whatever it may look like in practice – but we’re also seeing this conversation moving ahead at the state level. The day before the Summit also saw Texas pass Senate Bill 21, which allows it to establish a state-controlled crypto reserve, consisting of Bitcoin and other digital assets. A year ago, none of us could have dreamed of this. Texas’s move could open the floodgates for other states to follow suit, as well as state and local level municipalities internationally.”
Nic Puckrin, founder of The Coin Bureau, told BeInCrypto that Bitcoin’s short-term trajectory remains tied to macroeconomic conditions. He points to the fact that investors in the current cycle had unrealistic expectations from the Bitcoin crypto reserve.
Notably, there was a growing perception that the US government would buy billions worth of new BTC, causing a supply shock. From any economic or political concept, that would not have been possible.
It’s hard to imagine Congress approving such a purchase with taxpayers’ money to invest in risk assets. This unrealistic expectation was a catalyst behind the current price corrections.
“The current crypto sell-off reveals a mismatch between expectations and reality. The reserve will now only constitute crypto that the US government already has in its ownership and it won’t be buying new BTC on the market. It’s also important to point out that neither crypto nor stock prices are at the top of Trump’s agenda. In fact, he even dismissed stock price crashes as being the work of globalists. Meanwhile, the improving regulatory landscape and promise of integration with traditional finance rails will cement crypto’s important role in the US financial landscape. It’s worth celebrating this progress, instead of complaining about the gloomy short-term backdrop,” said Puckrin.
Based on all that, this cycle appears to be different from previous ones. So, despite recent corrections, BTC may not have topped yet.
New factors like institutional adoption, Trump’s crypto stance, and geopolitical tensions make historical comparisons less reliable. Unlike past cycles, Bitcoin price action isn’t following a clear post-halving rally.
At the same time, uncertainty is higher than ever. Macro conditions, the trade war, and changing US policies are adding complexity. With Bitcoin now part of the global financial system, its price is reacting to more than just halving cycles. The path forward is unclear, but the cycle isn’t necessarily over.
Disclaimer
In line with the Trust Project guidelines, this price analysis article is for informational purposes only and should not be considered financial or investment advice. BeInCrypto is committed to accurate, unbiased reporting, but market conditions are subject to change without notice. Always conduct your own research and consult with a professional before making any financial decisions. Please note that our Terms and Conditions, Privacy Policy, and Disclaimers have been updated.


Pi Network released its Mainnet Migration Roadmap today. The roadmap lays out a three‑phase plan to move tens of millions of Pioneers who are still waiting to be moved to the open network. It also introduces new rewards, such as referral bonuses.
However, unlike most project roadmaps, Pi network didn’t provide any estimated date or timeline. This lack of clarification has frustrated early adopters who still await key rewards and clarity on rollout pacing.
Pi Network’s Three‑Phase Migration Plan
According to the roadmap, Pi Network will first complete initial migrations for Pioneers already in the queue. This batch covers verified base mining rewards, Security Circle contributions, lockup commitments, utility‑app usage rewards, and confirmed Node rewards for some operators.
After clearing the first wave, the team will tackle second migrations, adding all referral mining bonuses linked to KYC‑verified team members. Pi says these referral rewards will follow once the current queue finishes.
Finally, the network will move into ongoing periodic migrations—potentially monthly or quarterly—to process any remaining bonuses and rewards.
The cadence “is to be determined,” the roadmap notes.
Community Concerns and Critical Gaps
A thorough observation reveals several gaps and potential concerns in the roadmap.
For one, the plan never discloses how many Pioneers remain in the queue or the network’s daily migration capacity. Without those figures, users can’t predict when their own migration will occur.
Node operators report that some “confirmed Node rewards” have landed, but criteria for qualification remain opaque. Early node runners worry they may miss out without clear benchmarks.
Many Pioneers say they have tapped their claim buttons daily since migration opened yet still lack basic mining rewards. They question whether those base rewards and deferred referral bonuses will ever arrive in phase two.
Also, the roadmap admits the UI’s “Transferable Balance” underestimates actual migrated amounts to save resources. Users fear this pessimistic display could erode trust if their true balances remain hidden.
“I thought we were mining all of these PI coins this whole time? I thought the security circles were the Consensus Mechanism. It kinda seems to me like there isn’t a blockchain, and never was one. What kind of “Blockchain protocol” would “Require” all tokens to be minted at genesis?” one community member wrote.
Crucially, Pi offers no audit or error‑resolution process for users who spot mismatches in their historical mining data.
Given six years of complex records, occasional disputes seem inevitable, but the roadmap remains silent on redress.
All migrations hinge on KYC completion, yet the team omits any scaling targets or timelines for identity verification. A bottleneck here could stall every subsequent phase.
The schedule also ignores how major token unlock events—such as the roughly 108.9 million PI tokens due to release this month—will align with migration waves.
Finally, some Pioneers challenge the project’s foundational narrative. They note that Pi’s statement “all tokens were minted at genesis” contradicts six years of “mining.”
This raises doubts about whether Pi ever operated on a true blockchain protocol.
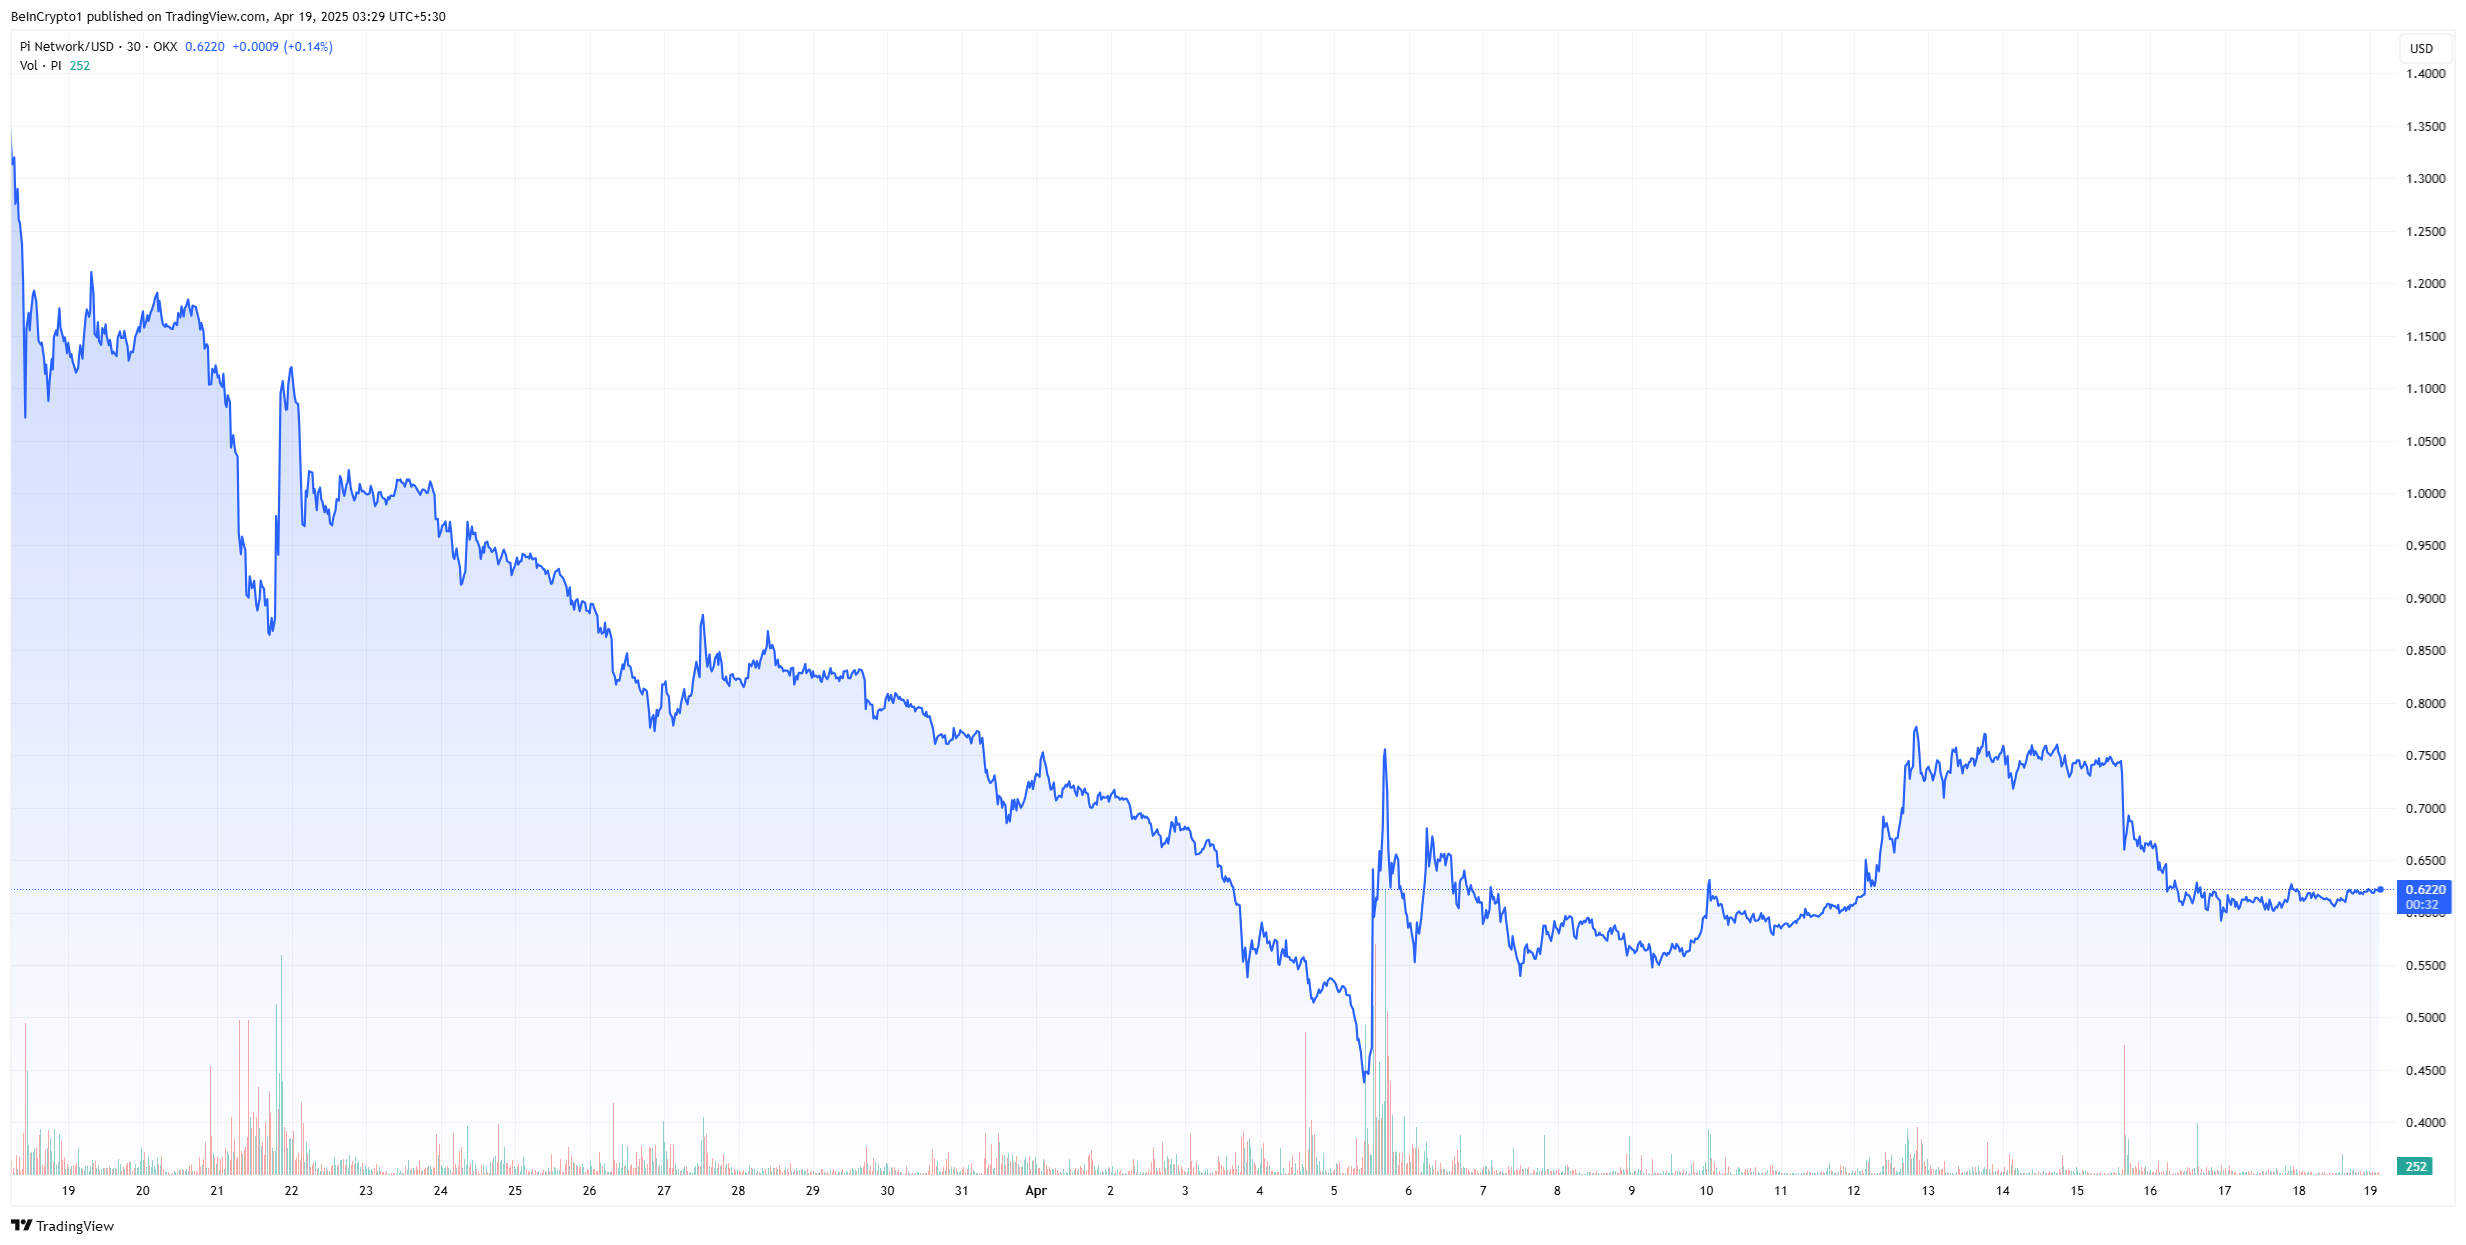
In the past month, PI price has dipped by over 45%. To sustain momentum and community trust, the team must now supply concrete timelines, transparent criteria, and clear audit paths for its Mainnet migration.
Disclaimer
In adherence to the Trust Project guidelines, BeInCrypto is committed to unbiased, transparent reporting. This news article aims to provide accurate, timely information. However, readers are advised to verify facts independently and consult with a professional before making any decisions based on this content. Please note that our Terms and Conditions, Privacy Policy, and Disclaimers have been updated.

The meme coin market is experiencing a surge in investor interest, helping certain tokens recover from their all-time lows (ATLs). Memecoin (MEME) is one such token that has avoided a new ATL and also posted a significant 73% rise.
BeInCrypto has analyzed two other meme coins that have performed well over the past day, making them important tokens to watch.
Memecoin (MEME)
- Launch Date – November 2023
- Total Circulating Supply – 43.11 Billion MEME
- Maximum Supply – 69 Billion MEME
- Fully Diluted Valuation (FDV) – $135.37 Million
MEME had a rough week, hitting a new all-time low at $0.00137. However, the altcoin rebounded sharply, rising by 38% in the last 24 hours to trade at $0.00196. This surge marks a significant recovery, driven by renewed interest in meme coins.
The recent surge in MEME’s price was fueled by a sudden spike in interest for joke tokens, driving a 73% intraday high. To maintain its gains, MEME must successfully breach and flip the $0.00228 resistance into support, a critical level for sustaining its upward momentum.
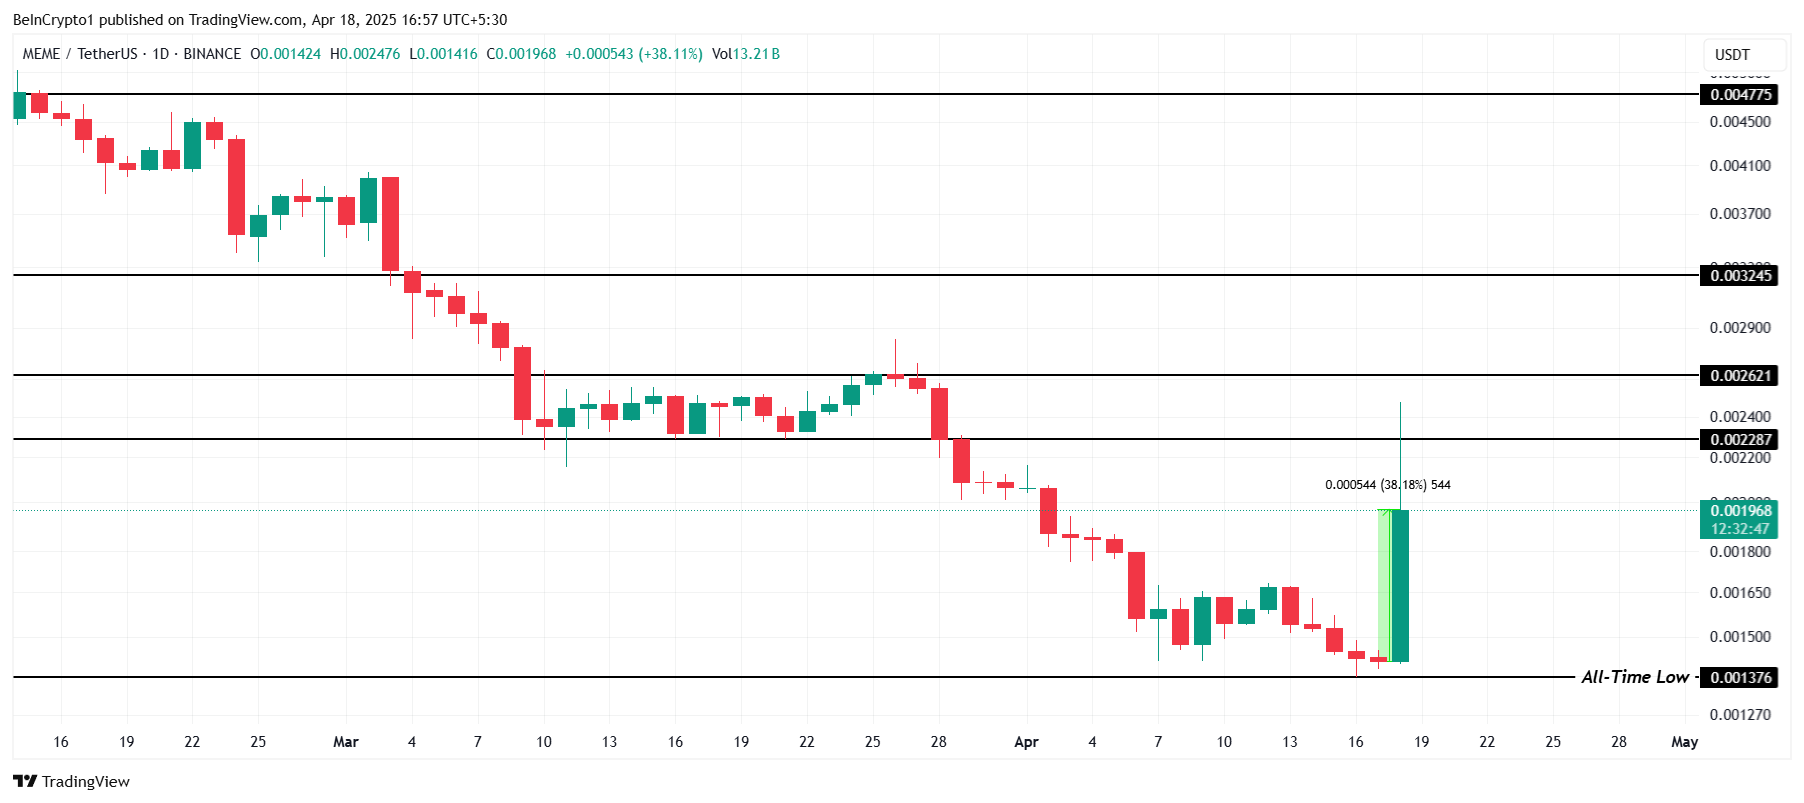
If MEME experiences profit-taking from investors, it could reverse course and drop back down to the all-time low of $0.00137. A decline through this level would invalidate the bullish outlook and signal further challenges for the meme coin.
Bone ShibaSwap (BONE)
- Launch Date – July 2021
- Total Circulating Supply – 249.89 Million BONE
- Maximum Supply – 250 Million BONE
- Fully Diluted Valuation (FDV) – $71.67 Million
BONE posted an impressive 18.5% rise over the last 24 hours, trading at $0.285. The altcoin is currently under the key resistance of $0.295. Given the recent momentum, it seems poised to breach this level, signaling a potential upward trajectory for the token in the near future.
Flipping the $0.295 resistance into support would open the door for BONE to target its next major resistance at $0.348. A sustained push above this level could drive further bullish sentiment, propelling the token toward even higher price levels.

However, if BONE fails to breach $0.295, the bullish momentum could fade. A decline from this point could send the meme coin back towards $0.232, invalidating the optimistic outlook. Such a reversal would likely create caution among investors, delaying potential upward movement.
- Launch Date – April 2024
- Total Circulating Supply – 999.96 Million BAN
- Maximum Supply – 1 Billion BAN
- Fully Diluted Valuation (FDV) – $40.54 Million
BAN, a small-cap token, has caught the attention of investors, rising nearly 25% in the last 24 hours to trade at $0.040. This surge highlights the growing interest in the meme coin market, with BAN standing out despite its smaller market capitalization.
Inspired by the infamous banana taped to a wall, BAN gained significant fame after being purchased by Tron’s founder, Justin Sun, for $6.2 million last year. If the token continues its upward momentum, it could breach the $0.045 barrier and potentially flip it into support, securing its gains.

However, failing to break through the $0.045 resistance could lead to a drop back to $0.032. If this occurs, it would invalidate the bullish outlook and erase the recent gains, putting investors on alert for further price declines.
Disclaimer
In line with the Trust Project guidelines, this price analysis article is for informational purposes only and should not be considered financial or investment advice. BeInCrypto is committed to accurate, unbiased reporting, but market conditions are subject to change without notice. Always conduct your own research and consult with a professional before making any financial decisions. Please note that our Terms and Conditions, Privacy Policy, and Disclaimers have been updated.

XRP is currently showing signs of indecision, trading sideways with limited momentum as traders await a clearer signal. Over the past 24 hours, XRP’s trading volume has dropped by 20.37%, now sitting at $2.4 billion—a decline that reflects cooling interest in the short term.
Technical indicators like the RSI and Ichimoku Cloud suggest a neutral trend, with no strong bullish or bearish dominance in play. Price action remains confined between key support and resistance levels, leaving the next breakout direction still uncertain.
Neutral RSI Reading Suggests Caution for XRP Traders
XRP’s Relative Strength Index (RSI) is currently sitting at 46.82, signaling neutral momentum in the market. This neutral zone has persisted since April 7, with no significant shifts into either overbought or oversold territory.
Notably, the RSI was at 57.30 just three days ago, indicating that XRP has experienced a recent decline in buying pressure.
The drop suggests cooling interest or a possible shift in sentiment among traders, as the asset now hovers closer to the midpoint of the RSI scale.

The RSI is a momentum oscillator that measures the speed and magnitude of recent price changes, typically on a scale from 0 to 100.
Readings above 70 often suggest an asset is overbought and could be due for a pullback, while readings below 30 indicate it may be oversold and potentially poised for a bounce. With XRP now at 46.82, the asset is neither overbought nor oversold, implying indecision in the market.
This level, combined with the recent dip from 57.30, may signal growing caution or weakening bullish momentum. It could potentially point to a consolidation phase or slight downward pressure in the short term unless buyers re-enter with conviction.
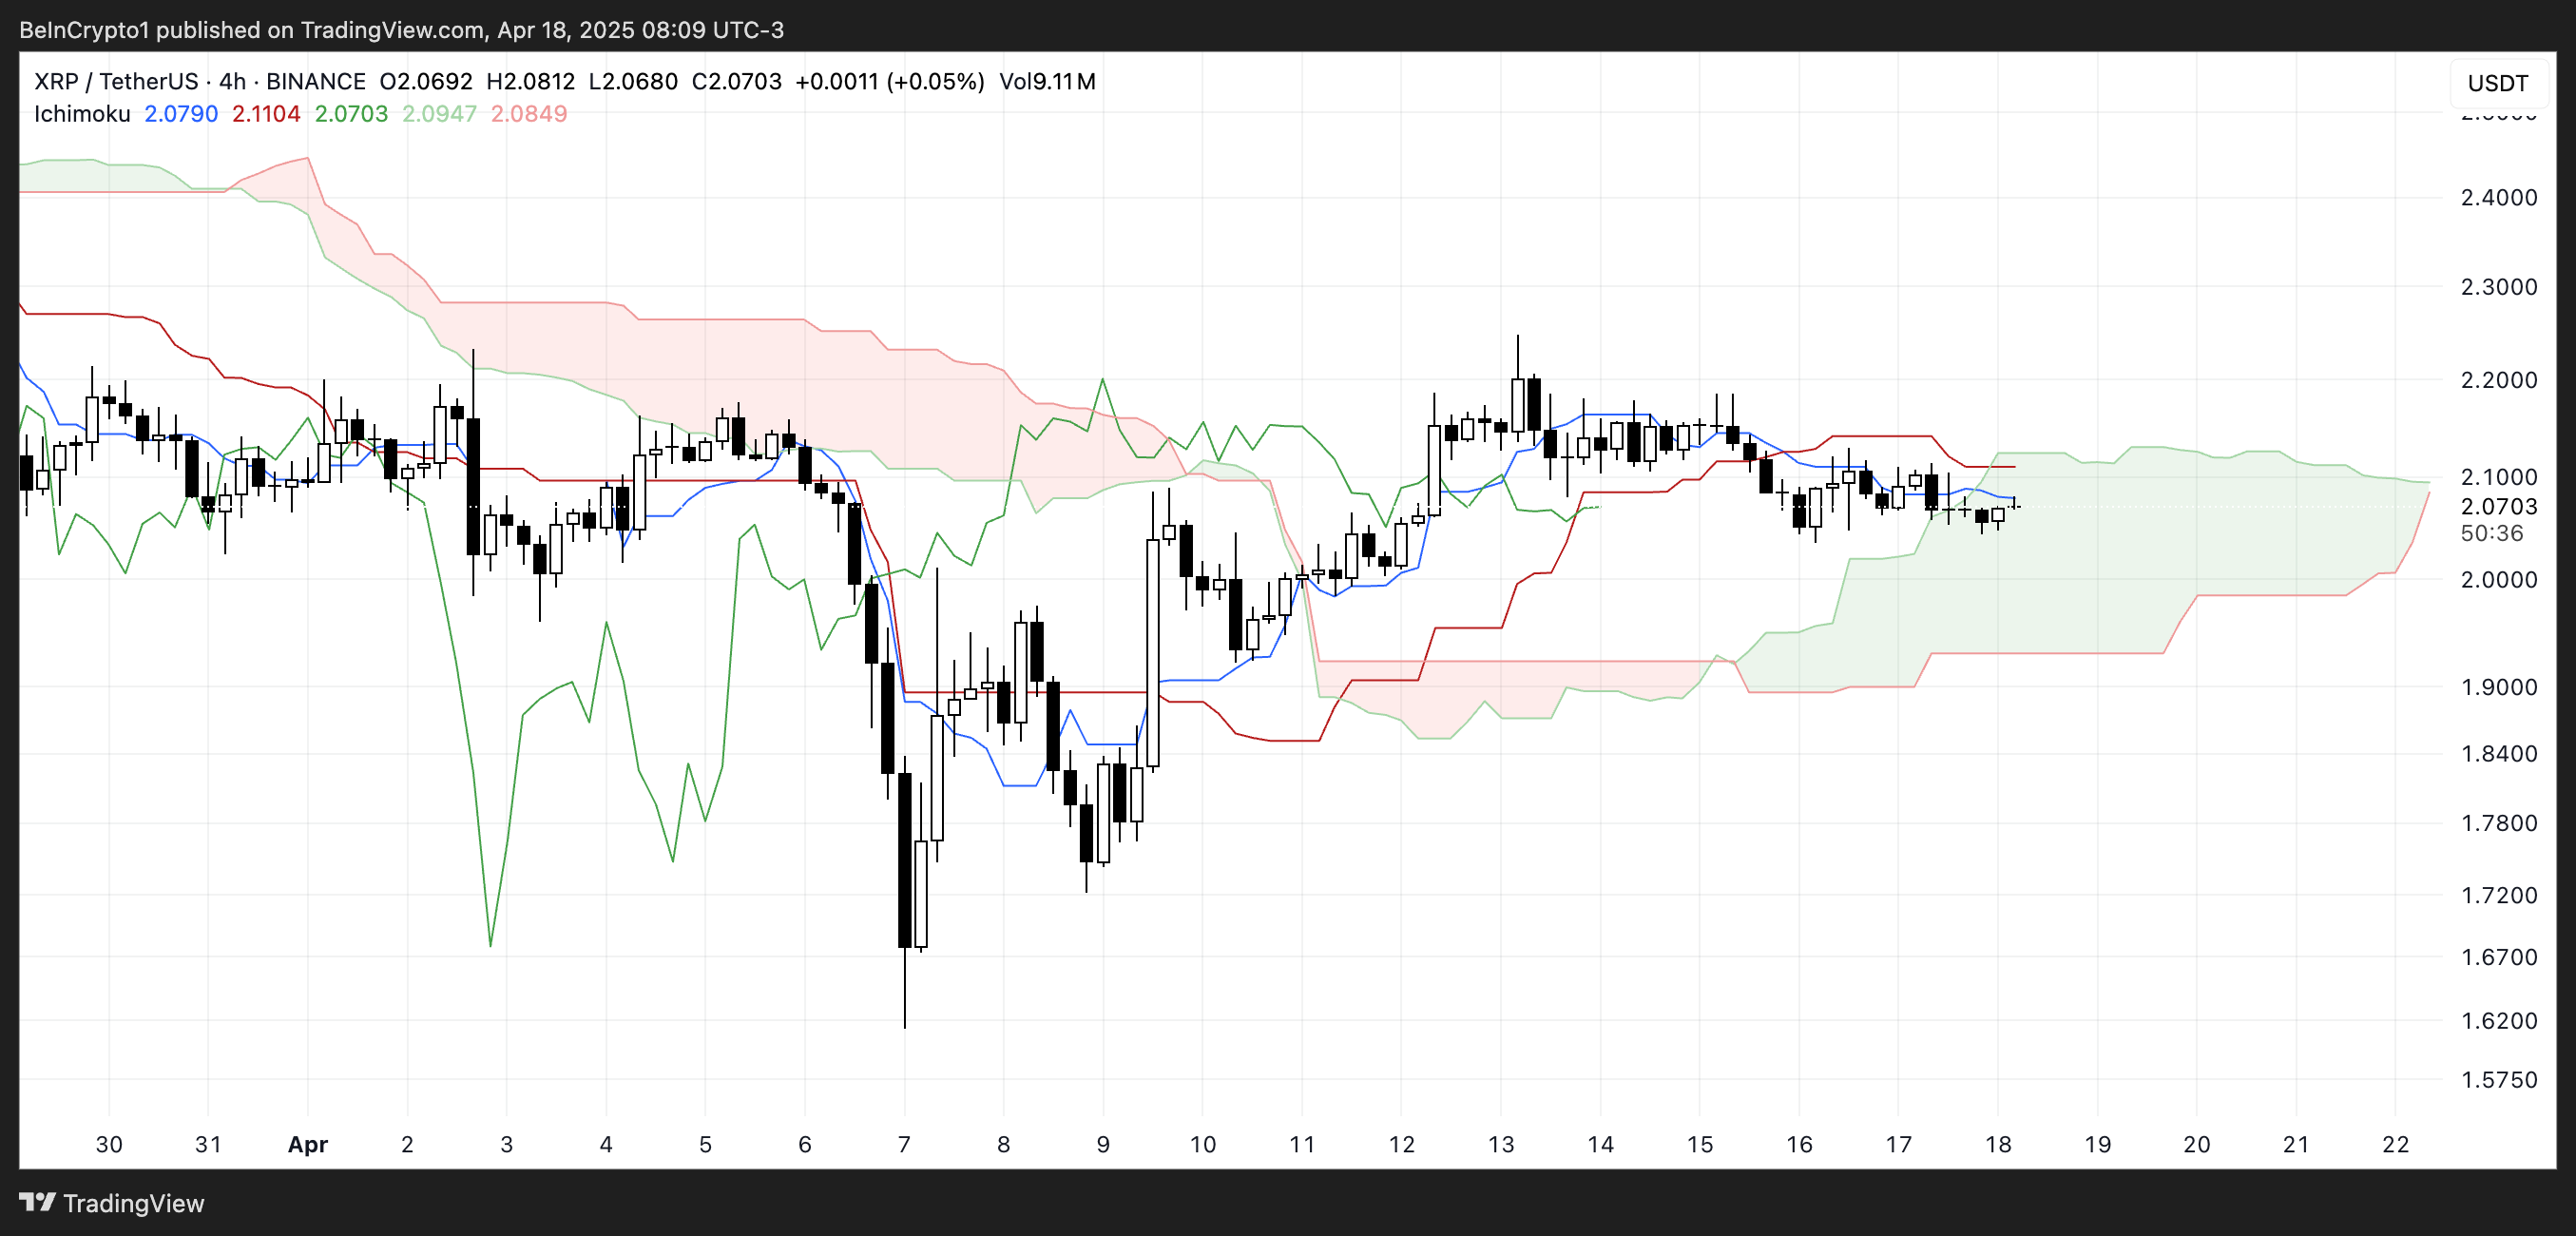
Ichimoku Indicators Show Indecision in XRP’s Price Action
XRP is currently trading inside the Ichimoku Cloud, reflecting a state of indecision or consolidation.
The Tenkan-sen (blue line) and Kijun-sen (red line) are flat and closely aligned, suggesting weak momentum and a lack of short-term trend direction.
The Senkou Span A and B (the cloud boundaries) are relatively flat as well, which typically indicates that the market is in equilibrium without strong pressure from either buyers or sellers.
The Ichimoku Cloud, or Kumo, helps visualize support, resistance, and trend direction at a glance. When the price is above the cloud, the trend is considered bullish; below it, bearish.
Inside the cloud, as XRP currently is, the trend is neutral, and volatility often contracts. The flatness of the cloud’s leading edges implies a consolidation phase, and the fact that price is not breaking clearly above or below the cloud reinforces the idea of market uncertainty.
For now, the lack of a decisive breakout suggests XRP could remain range-bound until a stronger trend develops.
$2.03 Support and $2.09 Resistance Hold the Key to XRP’s Next Move
XRP price is currently trading within a narrow consolidation range, with key support at $2.03 and resistance at $2.09.
The price action has been relatively muted, but the EMA lines are starting to show signs of potential weakness, as a death cross—where the short-term EMA crosses below the long-term EMA—appears to be forming.
If this bearish crossover confirms and XRP breaks below the $2.03 support, a move down to $1.96 becomes increasingly likely.

A strong continuation of the downtrend could trigger a steeper drop. It could potentially drive the price as low as $1.61 if selling pressure accelerates.
However, there’s still a bullish scenario on the table. If buyers manage to push XRP above the $2.09 resistance, it could open the door for a retest of the $2.17 and $2.35 levels.
This would indicate renewed strength and a shift in momentum in favor of the bulls. Should the rally gain traction beyond these levels, XRP could make a run toward $2.50, marking a significant recovery.
Disclaimer
In line with the Trust Project guidelines, this price analysis article is for informational purposes only and should not be considered financial or investment advice. BeInCrypto is committed to accurate, unbiased reporting, but market conditions are subject to change without notice. Always conduct your own research and consult with a professional before making any financial decisions. Please note that our Terms and Conditions, Privacy Policy, and Disclaimers have been updated.

Pi Network Roadmap Frustrates Users Over Missing Timeline

MEME Rallies 73%, BONE Follows

Canary Capital Files For Staked Tron ETF

XRP Volume Plunges 20% Amid Market Uncertainty

BONK Symmetrical Triangle Squeeze: Is A Mega Breakout Imminent?

XRP Price History Signals July As The Next Bullish Month

2.52 Million Altcoins Are Ruining Crypto’s Future

Animoca Brands Valuation Tanks 75% In Two Years, Here’s Why

Crypto exchange BingX hacked for $43 million

Are The Big Players Losing Interest?

Hong Kong’s Securities Association Tips Authorities On Crypto Self-Regulation

Coinbase cbBTC Set to go Live on Solana
2.52 Million Altcoins Are Ruining Crypto’s Future
Animoca Brands Valuation Tanks 75% In Two Years, Here’s Why
Crypto exchange BingX hacked for $43 million
Are The Big Players Losing Interest?
Hong Kong’s Securities Association Tips Authorities On Crypto Self-Regulation
Coinbase cbBTC Set to go Live on Solana
-

 Market24 hours ago
Binance Leads One-Third of the CEX Market in Q1 2025
-
 Altcoin22 hours ago
Tron Founder Justin Sun Reveals Plan To HODL Ethereum Despite Price Drop
-

 Market18 hours ago
Ethereum Price Fights for Momentum—Traders Watch Key Resistance
-
 Altcoin18 hours ago
Expert Predicts Pi Network Price Volatility After Shady Activity On Banxa
-

 Altcoin23 hours ago
Dogecoin Price Breakout in view as Analyst Predicts $5.6 high
-

 Ethereum22 hours ago
Ethereum Investors Suffer More Losses Than Bitcoin Amid Ongoing Market Turmoil
-

 Ethereum15 hours ago
Ethereum Fee Plunges To 5-Year Low—Is This A Bottom Signal?
-

 Market16 hours ago
Is XRP’s Low Price Part of Ripple’s Long-Term Growth Strategy?