
Market
Find Out If Shiba Inu Can Surge 15% After Shibarium Hard Fork

Shibarium, the layer-2 network from the Shiba Inu (SHIB) ecosystem, successfully completed a significant hard fork on May 2.
This update promises to deliver blazing-fast transactions and more predictable gas fees, enhancing user interactions with the network.
Is Shiba Inu Poised For a Breakout After the Shibarium Hard Fork?
The Shibarium Network announced on X (formerly Twitter) that it completed the hard fork at the block height of 4,504,576. A hard fork in blockchain technology entails a major upgrade that results in the split of the network into two chains.
Introduced on April 24, this process introduces fundamental changes incompatible with the previous software version. Consequently, the Shiba Inu development team initiated this ambitious upgrade to unlock advanced capabilities and streamline user engagement on the Shibarium platform.
Read more: Dogecoin (DOGE) vs Shiba Inu (SHIB): What’s the Difference?
The enhancements from this Shibarium hard fork aim to meet community demands for better usability and performance. As a result, Shibarium aims to be more affordable and accessible, addressing the primary concerns of its growing user base.
Moreover, the upgrade serves as a strategic move to foster innovation within the decentralized finance (DeFi) sector. By providing a robust and secure platform, Shibarium wants to be well-positioned to support developers and users eager to explore new possibilities in the crypto space.
Developers of Shiba Inu have expressed their enthusiasm about the upgrade’s potential impact.
“Consider a hard fork as a necessary update to unlock next-level capabilities in our network. This isn’t just a technical shift; it’s about delivering new value and simplifying engagement with Shibarium,” Shiba Inu wrote.
From a market perspective, analysts are optimistic about the hard fork’s effect on SHIB, the native token of Shibarium. Despite recent challenges, SHIB could see positive momentum from the network enhancements. Currently, SHIB is at the cusp of a breakout.
Technical analysis reveals that SHIB is forming a cup and handle pattern, with the neckline at $0.00002349. If there is a successful breakout above this level, the token’s value could increase by approximately 15%, testing resistance at $0.00002625.
Read more: Shiba Inu (SHIB) Price Prediction 2024/2025/2030
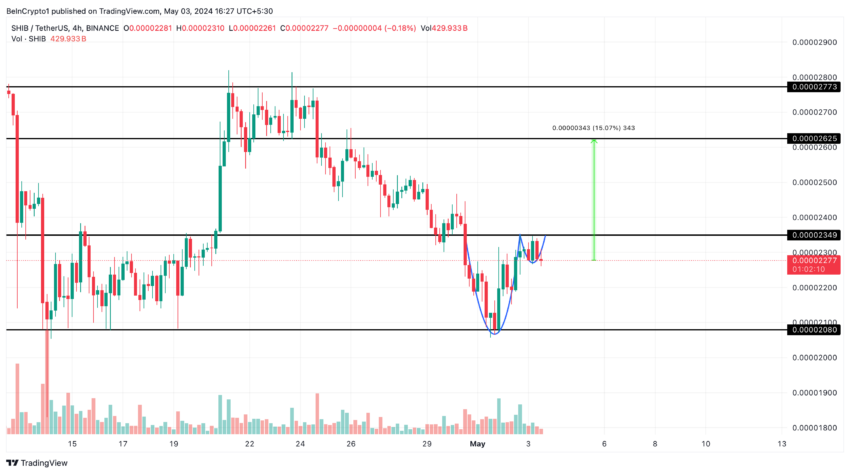
Conversely, failure to surpass the neckline could lead to a price correction, potentially finding support at $0.00002080, an 8% drop.
Disclaimer
In line with the Trust Project guidelines, this price analysis article is for informational purposes only and should not be considered financial or investment advice. BeInCrypto is committed to accurate, unbiased reporting, but market conditions are subject to change without notice. Always conduct your own research and consult with a professional before making any financial decisions. Please note that our Terms and Conditions, Privacy Policy, and Disclaimers have been updated.


Reason to trust
![]()
Strict editorial policy that focuses on accuracy, relevance, and impartiality
Created by industry experts and meticulously reviewed
The highest standards in reporting and publishing
Strict editorial policy that focuses on accuracy, relevance, and impartiality
Morbi pretium leo et nisl aliquam mollis. Quisque arcu lorem, ultricies quis pellentesque nec, ullamcorper eu odio.
Bitcoin price started a fresh decline from the $86,500 zone. BTC is now consolidating and might continue to decline below the $83,200 support.
- Bitcoin started a fresh decline from the $86,500 zone.
- The price is trading below $85,000 and the 100 hourly Simple moving average.
- There was a break below a connecting bullish trend line with support at $84,500 on the hourly chart of the BTC/USD pair (data feed from Kraken).
- The pair could start another increase if it clears the $84,500 zone.
Bitcoin Price Faces Rejection
Bitcoin price started a fresh increase above the $83,500 zone. BTC formed a base and gained pace for a move above the $84,000 and $85,500 resistance levels.
The bulls pumped the price above the $86,000 resistance. A high was formed at $86,401 and the price recently corrected some gains. There was a move below the $85,000 support. Besides, there was a break below a connecting bullish trend line with support at $84,500 on the hourly chart of the BTC/USD pair.
The price tested the $83,200 support. Bitcoin price is now trading below $85,000 and the 100 hourly Simple moving average. On the upside, immediate resistance is near the $84,000 level and the 23.6% Fib retracement level of the downward move from the $86,401 swing high to the $83,171 low.
The first key resistance is near the $84,500 level. The next key resistance could be $84,750 and the 50% Fib retracement level of the downward move from the $86,401 swing high to the $83,171 low.

A close above the $84,750 resistance might send the price further higher. In the stated case, the price could rise and test the $85,500 resistance level. Any more gains might send the price toward the $86,400 level.
Another Decline In BTC?
If Bitcoin fails to rise above the $85,000 resistance zone, it could start another decline. Immediate support on the downside is near the $83,500 level. The first major support is near the $83,200 level.
The next support is now near the $82,200 zone. Any more losses might send the price toward the $81,500 support in the near term. The main support sits at $80,800.
Technical indicators:
Hourly MACD – The MACD is now gaining pace in the bearish zone.
Hourly RSI (Relative Strength Index) – The RSI for BTC/USD is now below the 50 level.
Major Support Levels – $83,200, followed by $82,200.
Major Resistance Levels – $84,750 and $85,500.

Crypto US stocks are showing mixed performance today, with Core Scientific (CORZ), MicroStrategy (MSTR), and Coinbase (COIN) in focus.
CORZ is down -0.84% in the pre-market and remains one of the worst performers in the sector this year. Meanwhile, MSTR is gaining momentum after a fresh $285 million Bitcoin purchase, pushing its 5-day gains to 16%. COIN is up +0.88% pre-market as it heads into its Q1 2025 earnings report on May 8, trying to recover from a steep YTD decline.
Core Scientific (CORZ)
Core Scientific (CORZ) is down -0.84% in pre-market trading, continuing its recent underperformance. Despite broader strength across crypto-related equities, the stock has struggled to attract buyers.
The company operates one of the largest Bitcoin mining businesses in North America. It provides infrastructure, hosting, and self-mining services through its network of data centers.

CORZ is down nearly 50% year-to-date, making it one of the worst performers among crypto stocks. In contrast, peers like Marathon Digital (MARA) and Coinbase (COIN) have held up much better.
While others benefit from diversification or stronger narratives, Core Scientific remains tied to mining economics—an area hit by rising costs and thinning margins, but that it could have a rebound as BTC rebuilds momentum.
Strategy (MSTR)
MicroStrategy (MSTR) closed yesterday up 3.82%, pushing its year-to-date return to 7.54%. The stock has shown strong momentum alongside Bitcoin’s recent price recovery, with MSTR price up 16% in the last 5 days.
The company, led by Michael Saylor, is best known for its aggressive Bitcoin accumulation strategy. While it originally focused on enterprise software, it has since become heavily tied to BTC’s performance.

Strategy recently purchased an additional $285 million worth of Bitcoin, adding 3,459 BTC to its balance sheet. This brings its total holdings to 531,644 BTC.
The move reinforces the firm’s position as the largest corporate holder of Bitcoin, effectively turning it into a leveraged BTC play for investors.
Coinbase (COIN)
Coinbase (COIN) is trading up +0.88% in the pre-market, showing signs of continued short-term strength. The move comes ahead of a key earnings update.

The company operates one of the largest cryptocurrency exchanges in the US, offering trading, custody, and staking services. Coinbase is set to report its Q1 2025 earnings on May 8, which could be a major catalyst for the stock.
COIN is up 12% over the last five days, attempting to rebound after falling nearly 29% year-to-date.
Disclaimer
In line with the Trust Project guidelines, this price analysis article is for informational purposes only and should not be considered financial or investment advice. BeInCrypto is committed to accurate, unbiased reporting, but market conditions are subject to change without notice. Always conduct your own research and consult with a professional before making any financial decisions. Please note that our Terms and Conditions, Privacy Policy, and Disclaimers have been updated.

Ethena Labs is officially closing its German branch and EU operations after a previous MiCA application rejection. For the past month, the firm has been preparing to withdraw from this market.
Although the exit was anticipated, ENA reacted notably, with the altcoin falling over 7% after today’s announcement.
Ethena Labs Failed MiCA Effort
Ethena Labs has been facing continued regulatory difficulties in Europe. In late March, German authorities rejected Ethena’s application for MiCA compliance.
At the time, the firm suggested that this was a minor setback and that it would focus on other markets. Today, it announced that its German branch is winding down altogether.
“We have agreed with BaFin to wind down all activities of Ethena GmbH and will no longer be pursuing the MiCAR authorization in Germany. All whitelisted… users previously interacting with Ethena GmbH have at their request been onboarded with Ethena (BVI) Limited instead. As a result, Ethena GmbH no longer has any direct customers,” it claimed.
The statement further claimed that Ethena GmbH, the German branch, “has not conducted any mint or redeem activity” since the regulators’ MiCA ruling.
Specifically, regulators banned all sales of the USDe stablecoin, putting serious restrictions on the firm. In other words, this outcome is fairly expected. Ethena (BVI) Limited has taken over the German branch’s users.
The network’s governance token, ENA, has seen notable price swings around its MiCA efforts. In Early March, when Ethena Labs was reportedly on track to receive regulatory approval, ENA broke out of multi-month lows and nearly reached $2.5 billion in mark cap.
However, since the rejection, ENA saw continued bearish pressure, which was exacerbated by the macroeconomic conditions across the market. Today’s announcement drove further decline.

MiCA, the European Union’s new stablecoin regulations, have presented difficulties for several firms besides Ethena. For example, Tether’s stablecoins were delisted from EU exchanges when MiCA took effect, prompting serious changes to its business.
Several other issuers have been racing to fill the gap left by these firms by achieving compliance. Most recently, major centralized exchanges such as Crypto.com and OKX have achieved the license, further strengthening their grasp over the EU market.
Disclaimer
In adherence to the Trust Project guidelines, BeInCrypto is committed to unbiased, transparent reporting. This news article aims to provide accurate, timely information. However, readers are advised to verify facts independently and consult with a professional before making any decisions based on this content. Please note that our Terms and Conditions, Privacy Policy, and Disclaimers have been updated.

Bitcoin Price on The Brink? Signs Point to Renewed Decline

3 US Crypto Stocks to Watch Today: CORZ, MSTR, and COIN

Ethena Labs Leaves EU Market Over MiCA Compliance

Hedera Under Pressure as Volume Drops, Death Cross Nears

Solana (SOL) Jumps 20% as DEX Volume and Fees Soar

Ethereum Metrics Reveal Critical Support Level – Can Buyers Step In?

2.52 Million Altcoins Are Ruining Crypto’s Future

Animoca Brands Valuation Tanks 75% In Two Years, Here’s Why

Crypto exchange BingX hacked for $43 million

Are The Big Players Losing Interest?

Hong Kong’s Securities Association Tips Authorities On Crypto Self-Regulation

Coinbase cbBTC Set to go Live on Solana
2.52 Million Altcoins Are Ruining Crypto’s Future
Animoca Brands Valuation Tanks 75% In Two Years, Here’s Why
Crypto exchange BingX hacked for $43 million
Are The Big Players Losing Interest?
Hong Kong’s Securities Association Tips Authorities On Crypto Self-Regulation
Coinbase cbBTC Set to go Live on Solana
-

 Market18 hours ago
Can Pi Network Avoid a Similar Fate?
-

 Ethereum22 hours ago
SEC Delays Decision On Staking For Grayscale’s Ethereum ETFs
-

 Market21 hours ago
XRP Price Could Regain Momentum—Is a Bullish Reversal in Sight?
-

 Market23 hours ago
Trump’s Tariffs Spark Search for Jerome Powell’s Successor
-
 Bitcoin20 hours ago
Bitcoin Poised for Summer Rally as Gold Leads and Liquidity Peaks
-
 Altcoin18 hours ago
Binance Delists This Crypto Causing 40% Price Crash, Here’s All
-

 Market17 hours ago
Ethereum Price Consolidation Hints at Strength—Is a Move Higher Coming?
-

 Market16 hours ago
Pi Network Price Rise To $1 is Now In The Hands Of Bitcoin
