
Market
FET Risks Plummeting By 16%

Holders of the Artificial Superintelligence Alliance (FET) token have seen profitable returns this week. On-chain data indicates that most transactions over the past seven days have ended with gains.
However, with bearish sentiment prevailing in the market, the altcoin faces a potential 16% decline in value.
Artificial Superintelligence Alliance Holders Smile to the Bank
As of this writing, FET trades at $0.84, marking a 3% increase over the past seven days. Analysis of the token’s daily on-chain transaction volume ratio in profit versus loss reveals that most traders have secured gains during this period. On Thursday, the metric reached 2.40, its highest level since July 27.
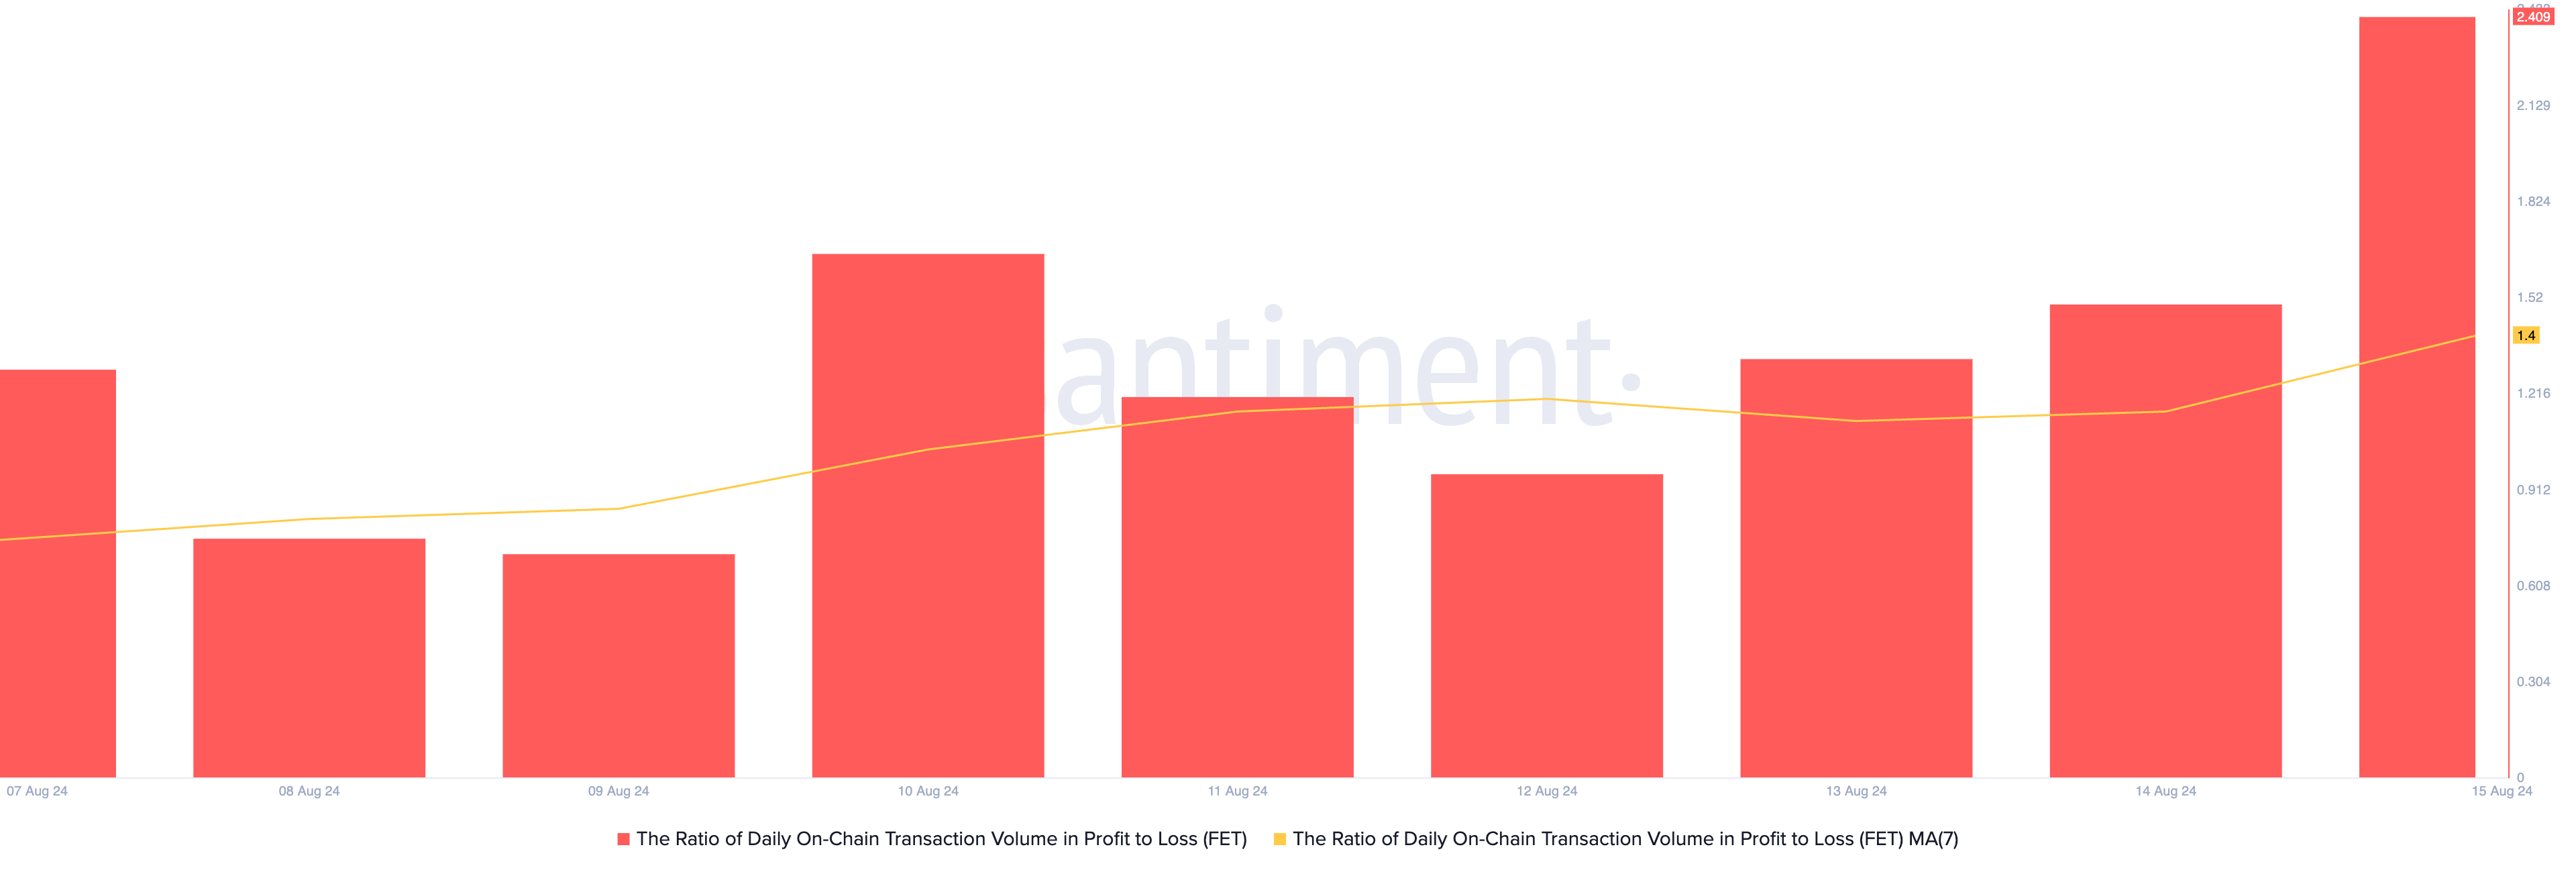
This metric tracks the proportion of an asset’s daily on-chain transaction volume that ends in profit compared to those that result in a loss. A value of 2.40 indicates that for every FET transaction ending in a loss on Thursday, 2.4 transactions concluded in profit.
When this ratio is elevated alongside a surge in trading volume, it typically signals accumulation by large investors. The recent increase in FET’s supply distribution over the past week further supports this trend.
Read more: How Will Artificial Intelligence (AI) Transform Crypto?
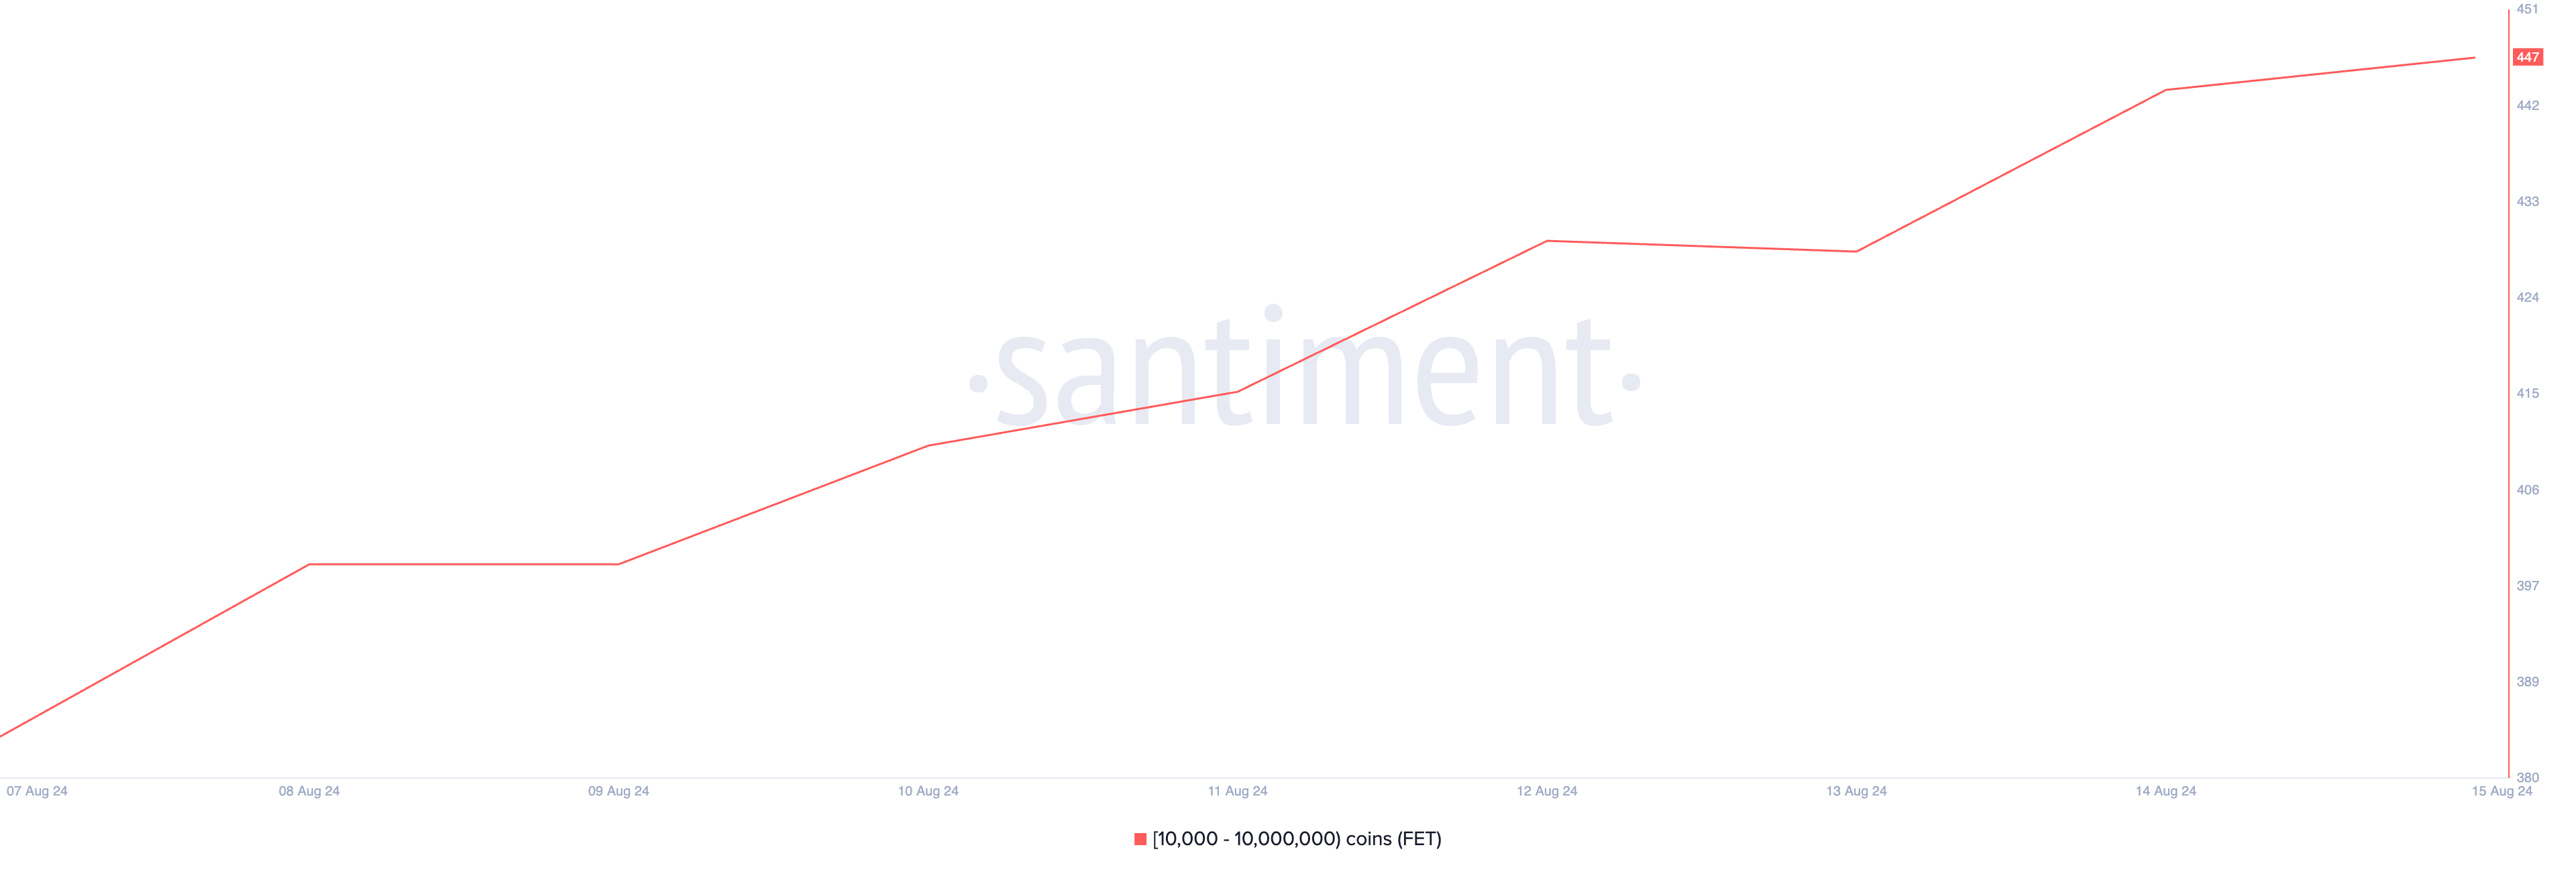
Santiment’s data shows a 16% uptick in the number of FET whales that hold between 10,000 and 10,000,000 tokens in the past seven days. This cohort of FET investors holds over 37,000% of the altcoin’s circulating supply of 2,520,000,000 tokens.
FET Price Prediction: The Profits May Soon Turn to Losses
While FET holders are enjoying short-term profits, caution remains essential as bearish sentiment lingers. This is evident from the Elder-Ray Index, which has consistently shown negative values since July 23. As of now, the indicator sits at -0.097.
The Elder-Ray Index measures the balance of power between buyers and sellers. Negative values indicate that sellers are in control, reflecting bearish dominance in the market.
Additionally, FET is currently trading below its 20-day exponential moving average (EMA), which tracks its average price over the last 20 trading days. Trading below this level signals a short-term downtrend, indicating that recent price action is weaker than the 20-day average — a bearish signal for traders.
Read more: Top 9 Artificial Intelligence (AI) Cryptocurrencies in 2024
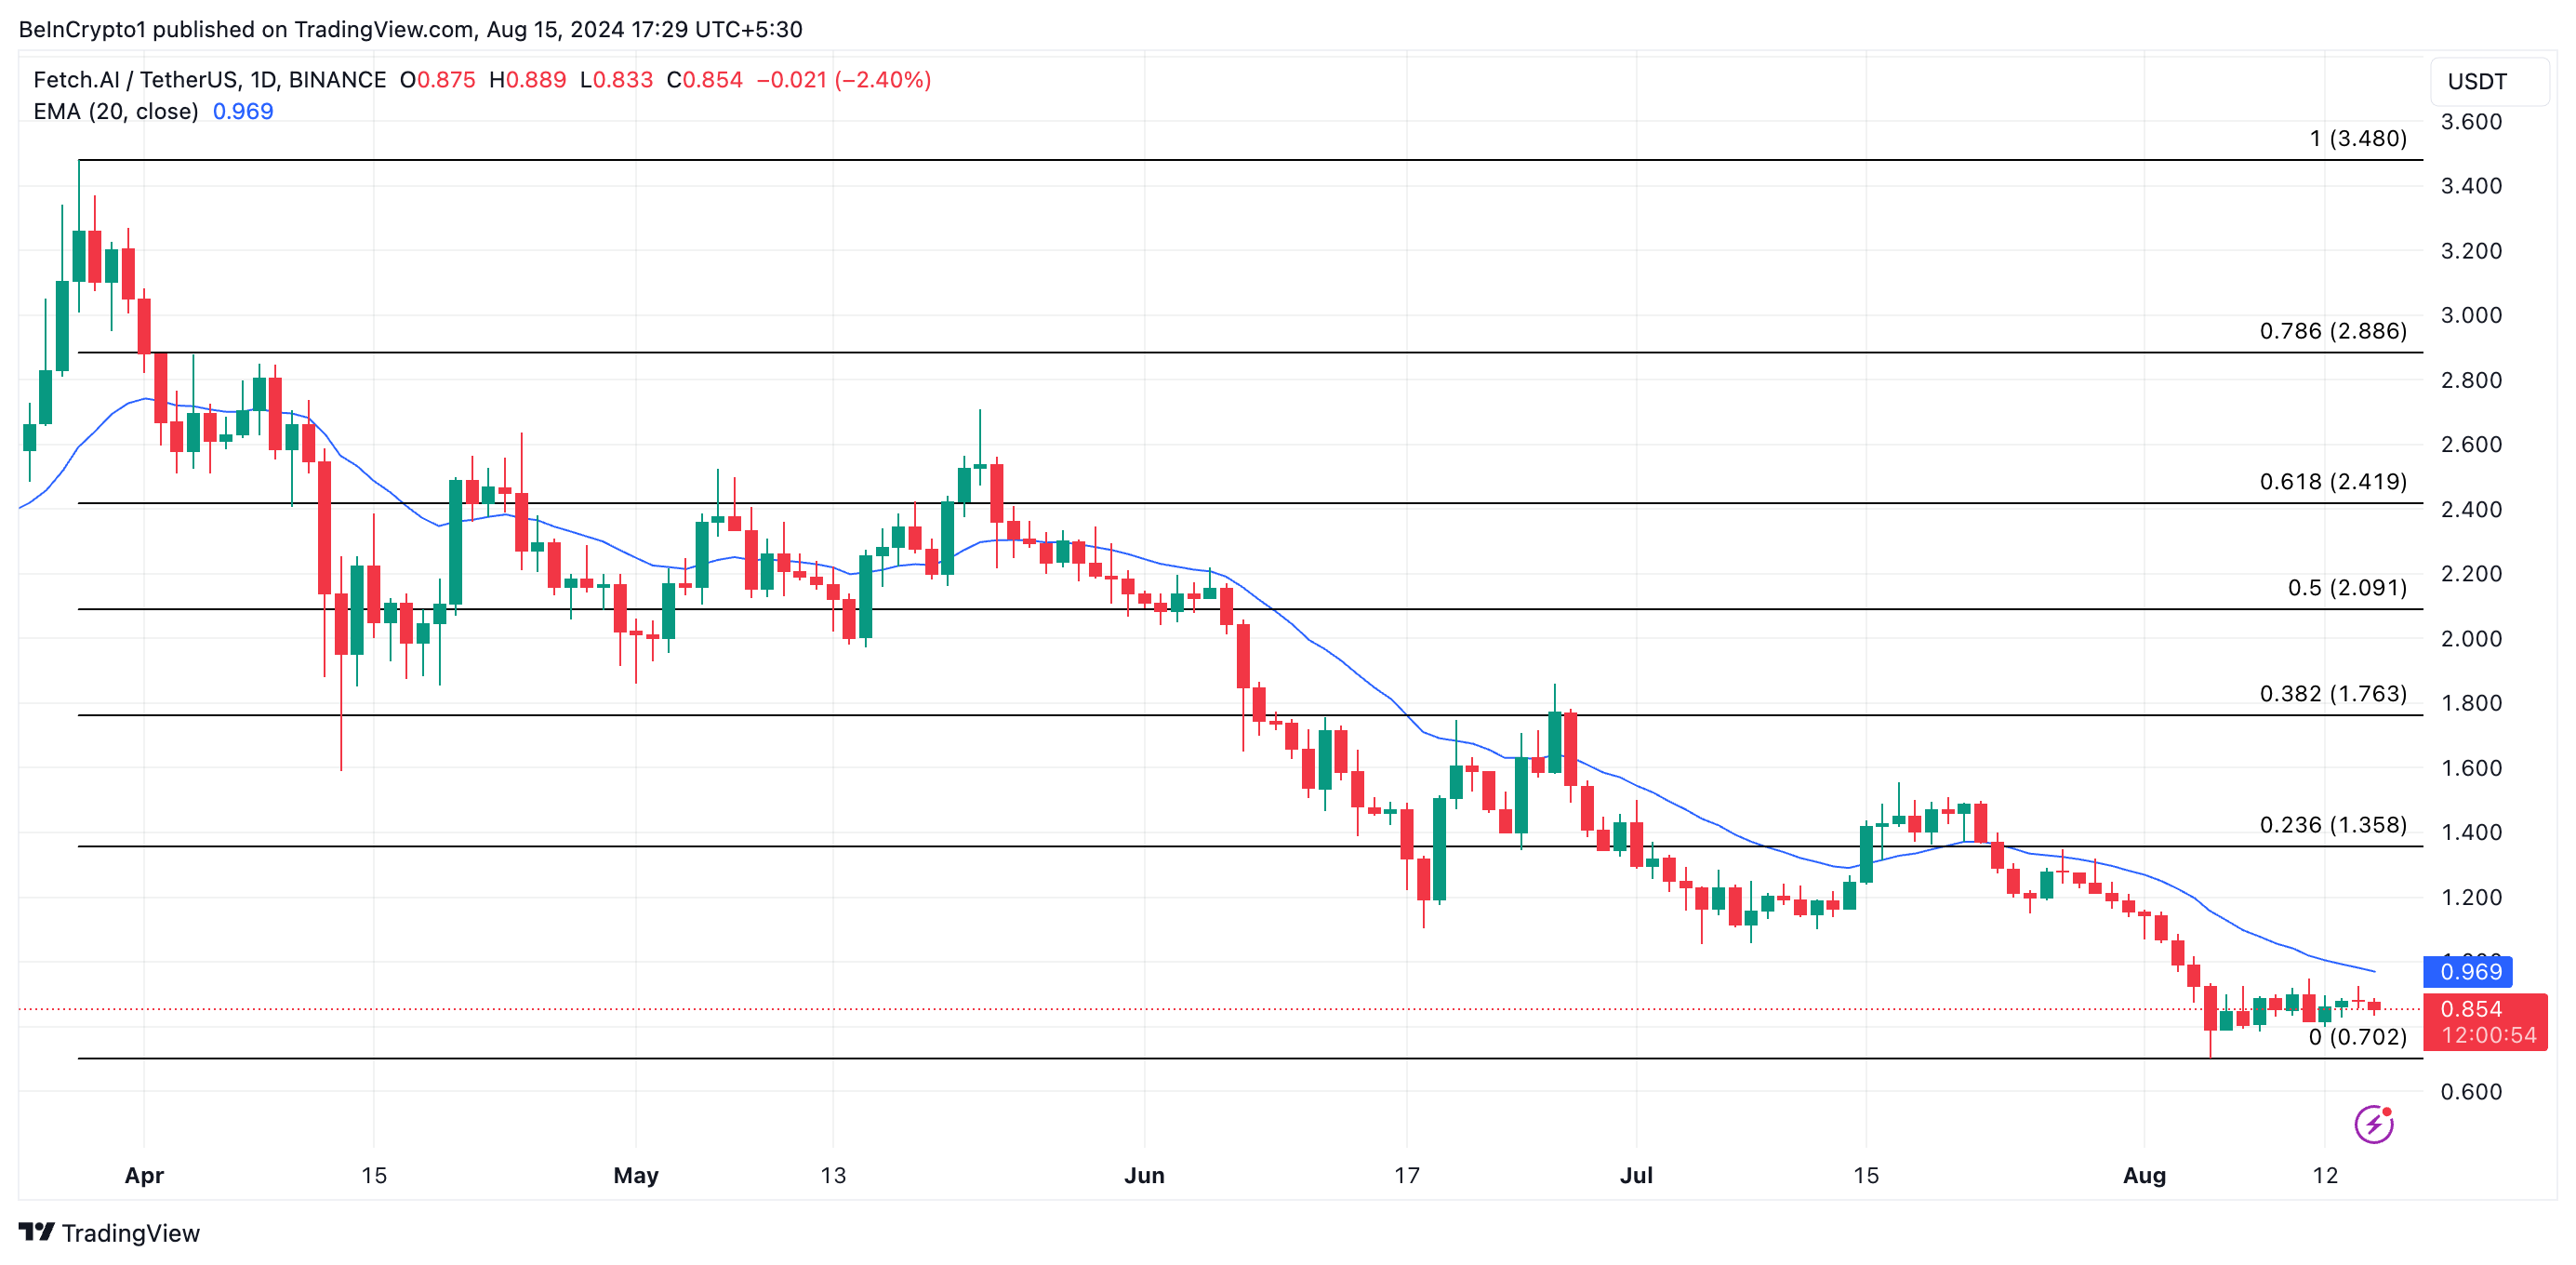
If FET’s decline continues, its price may drop to $0.70. It last traded at this level on August 5, during the general market downturn. However, if market sentiment turns bullish, the token’s price could rebound and rally above $1, potentially reaching $1.35.
Disclaimer
In line with the Trust Project guidelines, this price analysis article is for informational purposes only and should not be considered financial or investment advice. BeInCrypto is committed to accurate, unbiased reporting, but market conditions are subject to change without notice. Always conduct your own research and consult with a professional before making any financial decisions. Please note that our Terms and Conditions, Privacy Policy, and Disclaimers have been updated.


Solana (SOL) has dropped over 6% in the past seven days and has been trading below $150 since March 6. The current trend shows clear bearish signals across multiple indicators.
From a death cross to a rising ADX and a red Ichimoku Cloud, technicals suggest growing downside pressure. With SOL nearing key support, the next few days could be critical for its price direction.
SOL Ichimoku Cloud Paints A Bearish Picture
The Ichimoku Cloud chart for Solana shows a clear bearish structure, with price action trading below both the Kijun-sen (red line) and Tenkan-sen (blue line).
The Lagging Span (green line) is also positioned below the price candles and the cloud, reinforcing the negative outlook. The Kumo ahead is red and descending, suggesting that resistance remains strong in the near term.

Solana has struggled to break above short-term resistance levels and remains stuck in a downward channel. The thin nature of the current cloud suggests weak support, making the price vulnerable to further downside if bearish momentum continues.
For a reversal, Solana would need to break above the Kijun-sen and push decisively toward the cloud, but for now, the trend remains tilted to the downside.
Solana DMI Shows Sellers Are In Control
Solana’s DMI chart shows a sharp rise in the ADX, now at 40.87—up from 19.74 just three days ago.
The ADX (Average Directional Index) measures the strength of a trend, with values above 25 indicating a strong trend and values above 40 signaling a very strong one.
This surge confirms that the current downtrend in SOL is gaining momentum.

At the same time, the +DI has dropped from 17.32 to 8.82, while the -DI has climbed to 31.09, where it has held steady for the past two days.
This setup suggests that the sellers are firmly in control, and the downtrend is strong and also strengthening.
As long as the -DI remains dominant and ADX stays elevated, SOL is likely to remain under pressure in the short term.
Can Solana Drop Below $110 Soon?
Solana recently formed a death cross, a bearish signal where short-term moving averages cross below long-term ones.
It’s now approaching key support at $120—if that level breaks, Solana price could drop to $112, and possibly below $110 for the first time since February 2024.

If bulls step in and buying pressure returns, SOL could rebound toward resistance at $136.
A breakout above that level may lead to a push toward $147, which acted as strong resistance just five days ago.
Disclaimer
In line with the Trust Project guidelines, this price analysis article is for informational purposes only and should not be considered financial or investment advice. BeInCrypto is committed to accurate, unbiased reporting, but market conditions are subject to change without notice. Always conduct your own research and consult with a professional before making any financial decisions. Please note that our Terms and Conditions, Privacy Policy, and Disclaimers have been updated.

Made in USA coins are showing mixed signals as April begins, with XRP, SUI, and Pi Network (PI) standing out. XRP leads in market cap but also posted the biggest drop among the top 10, down 10.6% this week.
SUI is the only major gainer, up 3.8%, showing some strength despite broader weakness. Meanwhile, PI has been the worst performer, plunging over 23% and staying below $1 all week.
XRP
XRP is the largest Made in USA crypto by market cap, but it’s also down 10.6% over the last 7 days—the biggest drop among the top 10. This sharp correction could present an opportunity, especially with Trump’s “Liberation Day” event coming up on April 2.
If XRP builds an uptrend, it could push to test resistance at $2.22. A breakout there may lead to moves toward $2.47 and even $2.59 if momentum grows.

If the downtrend continues, XRP could revisit support at $2.06. A breakdown below that level might drag it further down to $1.90.
With volatility rising and a possible narrative shift on the horizon, XRP could be a key coin to watch this week.
SUI
SUI is the only among major Made in USA cryptos showing gains over the past week, up 3.8%, even though it’s still down 13% over the last 30 days. This resilience sets it apart from the rest of the pack.
In the last 24 hours, trading volume has dropped 15% to $767 million. The coin’s current market cap is $7.43 billion.
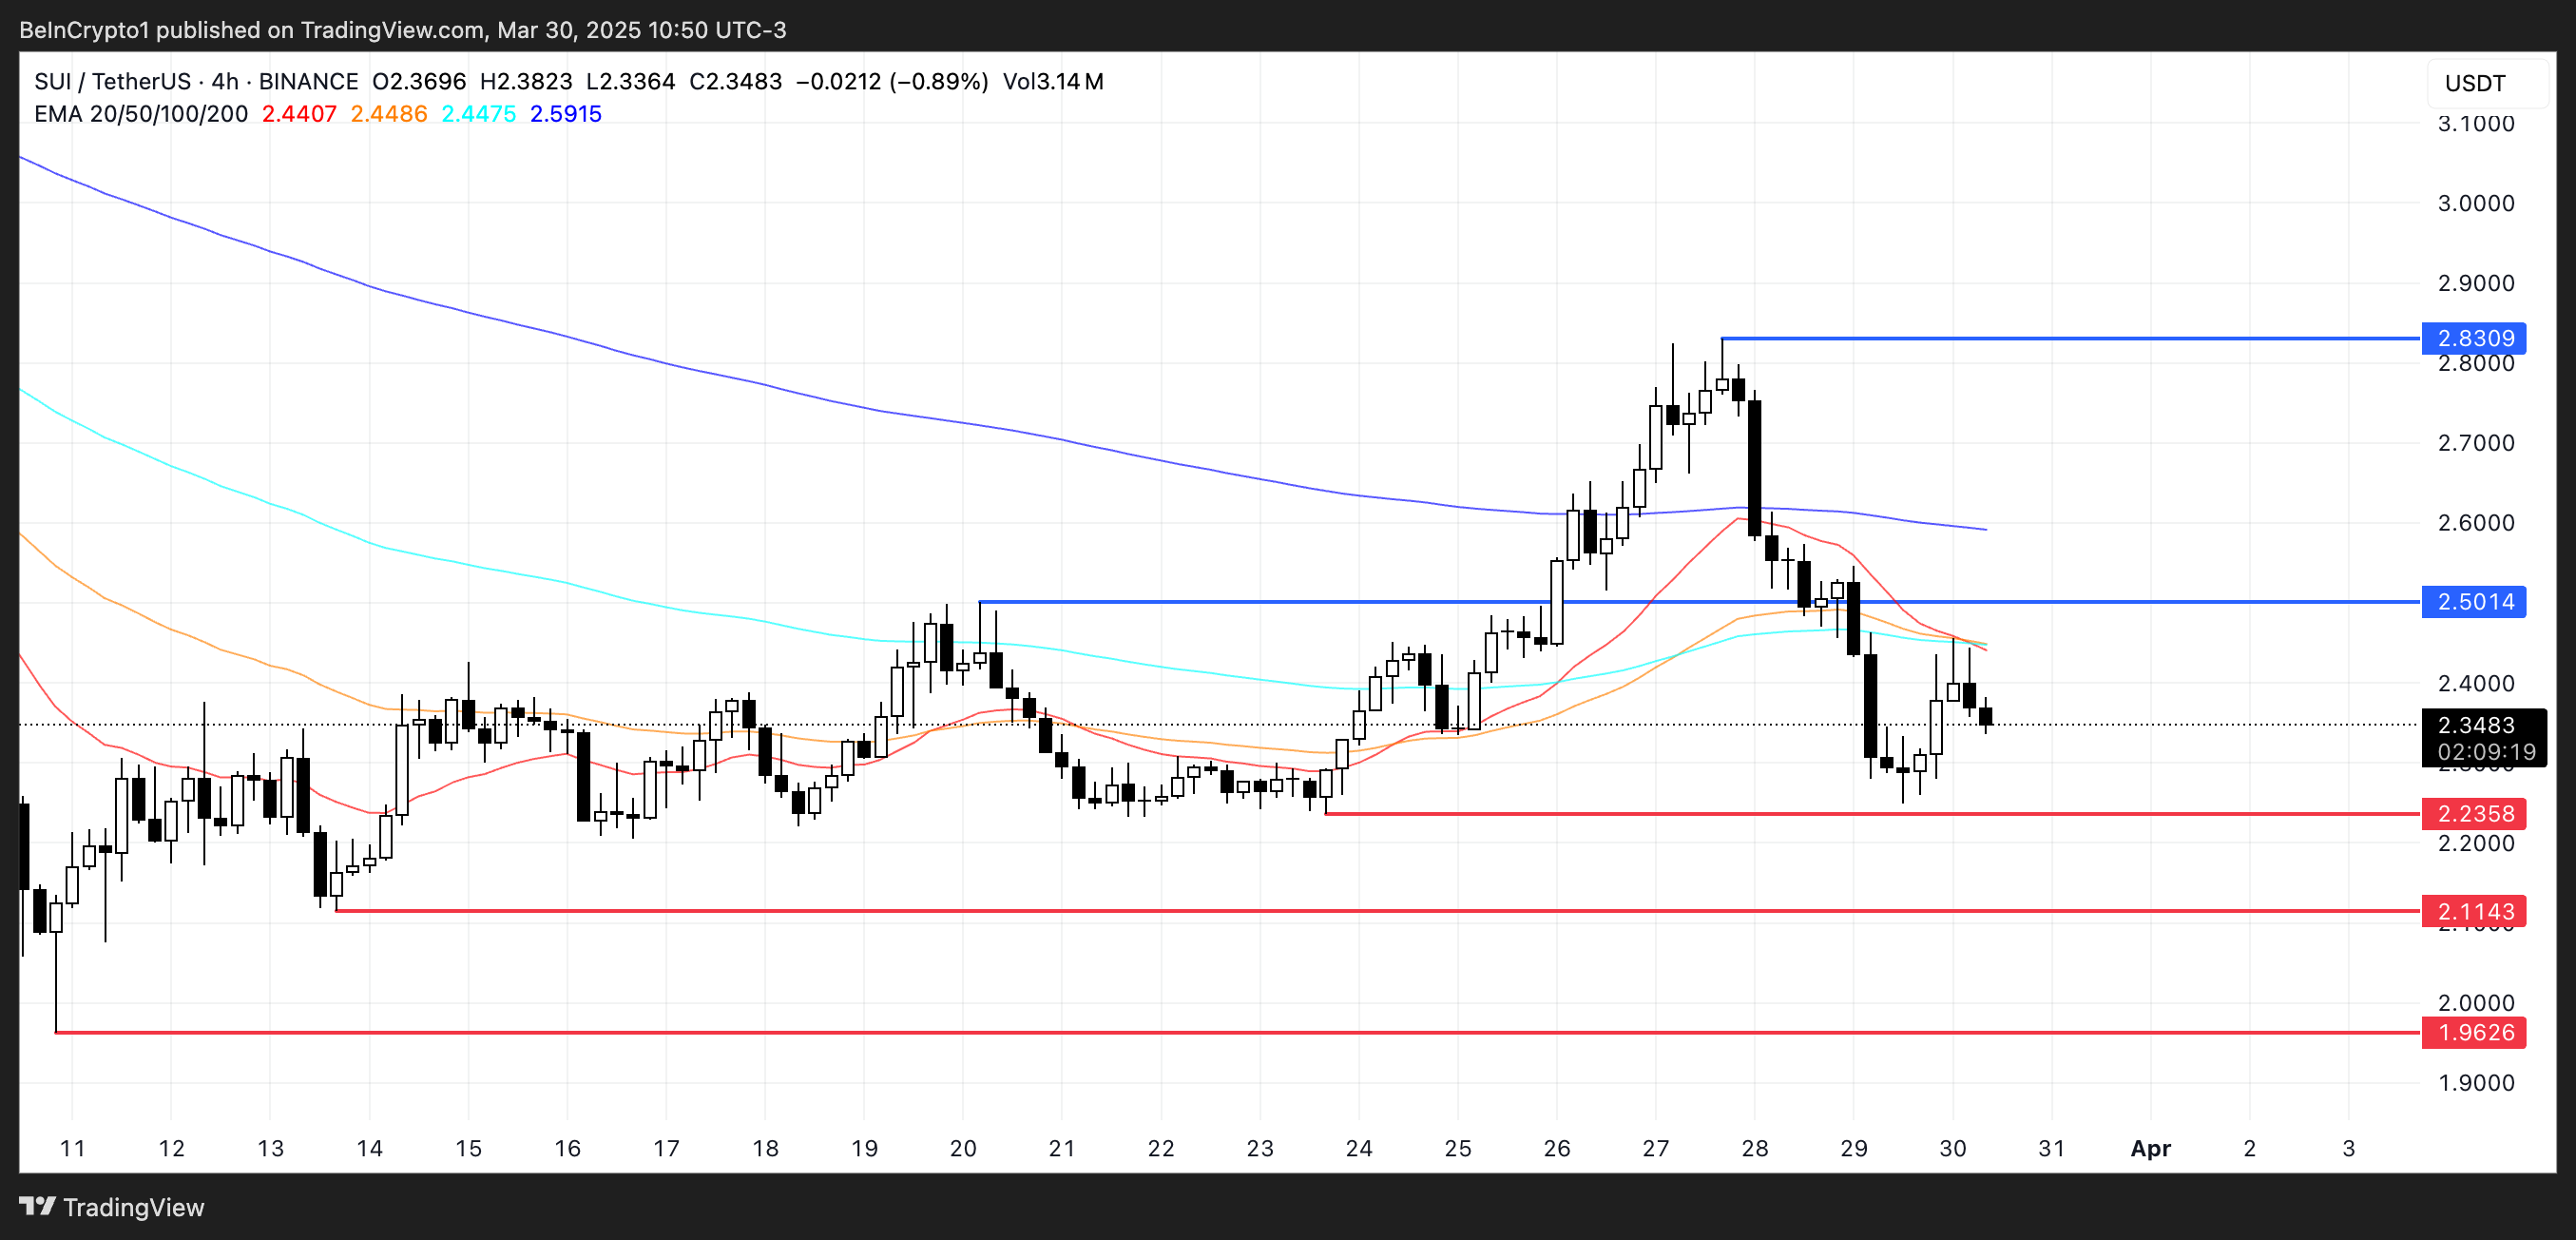
SUI’s EMA lines recently formed a death cross, hinting at a possible downtrend. If confirmed, the price could drop to $2.23, with further downside to $2.11 and $1.96.
If SUI manages to reverse the trend, it could climb toward $2.50. A breakout there would open the door to $2.83, nearly 20% higher from current levels.
Pi Network (PI)
Pi Network (PI) is the biggest loser among Made in USA cryptos this week, with its price down over 23% in the last seven days.
It has been trading below $1 throughout the entire week.

If sentiment shifts, PI could rebound toward resistance at $1.05. A breakout there might lead to a push-up to $1.23.
But if bearish pressure continues, PI could fall to test support at $0.718. A drop below that would send it to $0.62—its lowest level since February 21.
Disclaimer
In line with the Trust Project guidelines, this price analysis article is for informational purposes only and should not be considered financial or investment advice. BeInCrypto is committed to accurate, unbiased reporting, but market conditions are subject to change without notice. Always conduct your own research and consult with a professional before making any financial decisions. Please note that our Terms and Conditions, Privacy Policy, and Disclaimers have been updated.

Three major token unlocks involving PRCL, DBR, and SCR are set to take place in April. Parcl will unlock 161.7 million PRCL on April 16, followed by deBridge unlocking 1.11 billion DBR on April 17 and Scroll releasing 40 million SCR on April 22.
These events could significantly impact each token’s supply dynamics and short-term price action. With large allocations set aside for contributors, partners, and airdrops, these unlocks are worth watching closely.
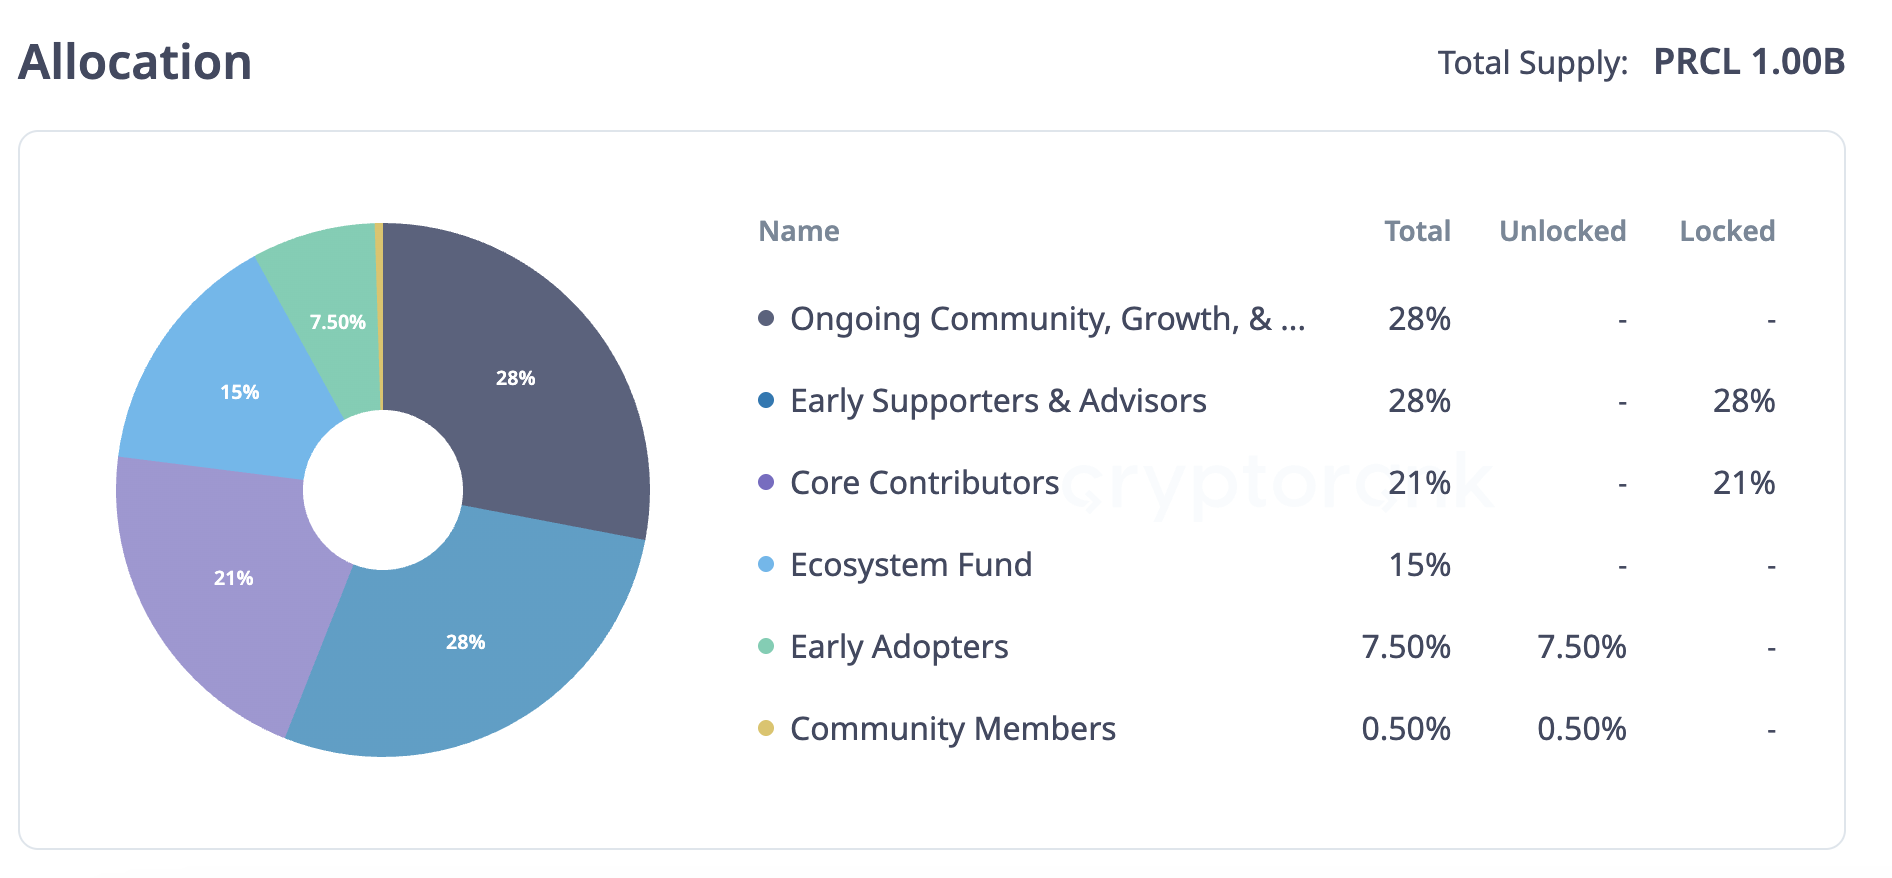
Parcl (PRCL)
Unlock Date: April 16
Number of Tokens to be Unlocked: 161.7 million PRCL (16.2% of Total Supply)
Current Circulating Supply: 270.8 million PRCL
Total supply: 1 Billion PRCL
Parcl is a decentralized exchange that lets users trade real estate price movements without owning property. The ecosystem—made up of Parcl, Parcl Labs, and Parcl Limited—governs the Parcl Protocol, which offers synthetic exposure to real-world real estate markets. It allows users to go long or short on property prices across different regions.
On April 16, 161.7 million PRCL tokens, worth roughly $15.56 million, will be unlocked. This could increase the token supply and lead to short-term market volatility.
The unlock includes 92.4 million tokens for early supporters and advisors, and 69.3 million for core contributors. PRCL price is down 33% in the last 30 days and trading below $0.1 since yesterday.
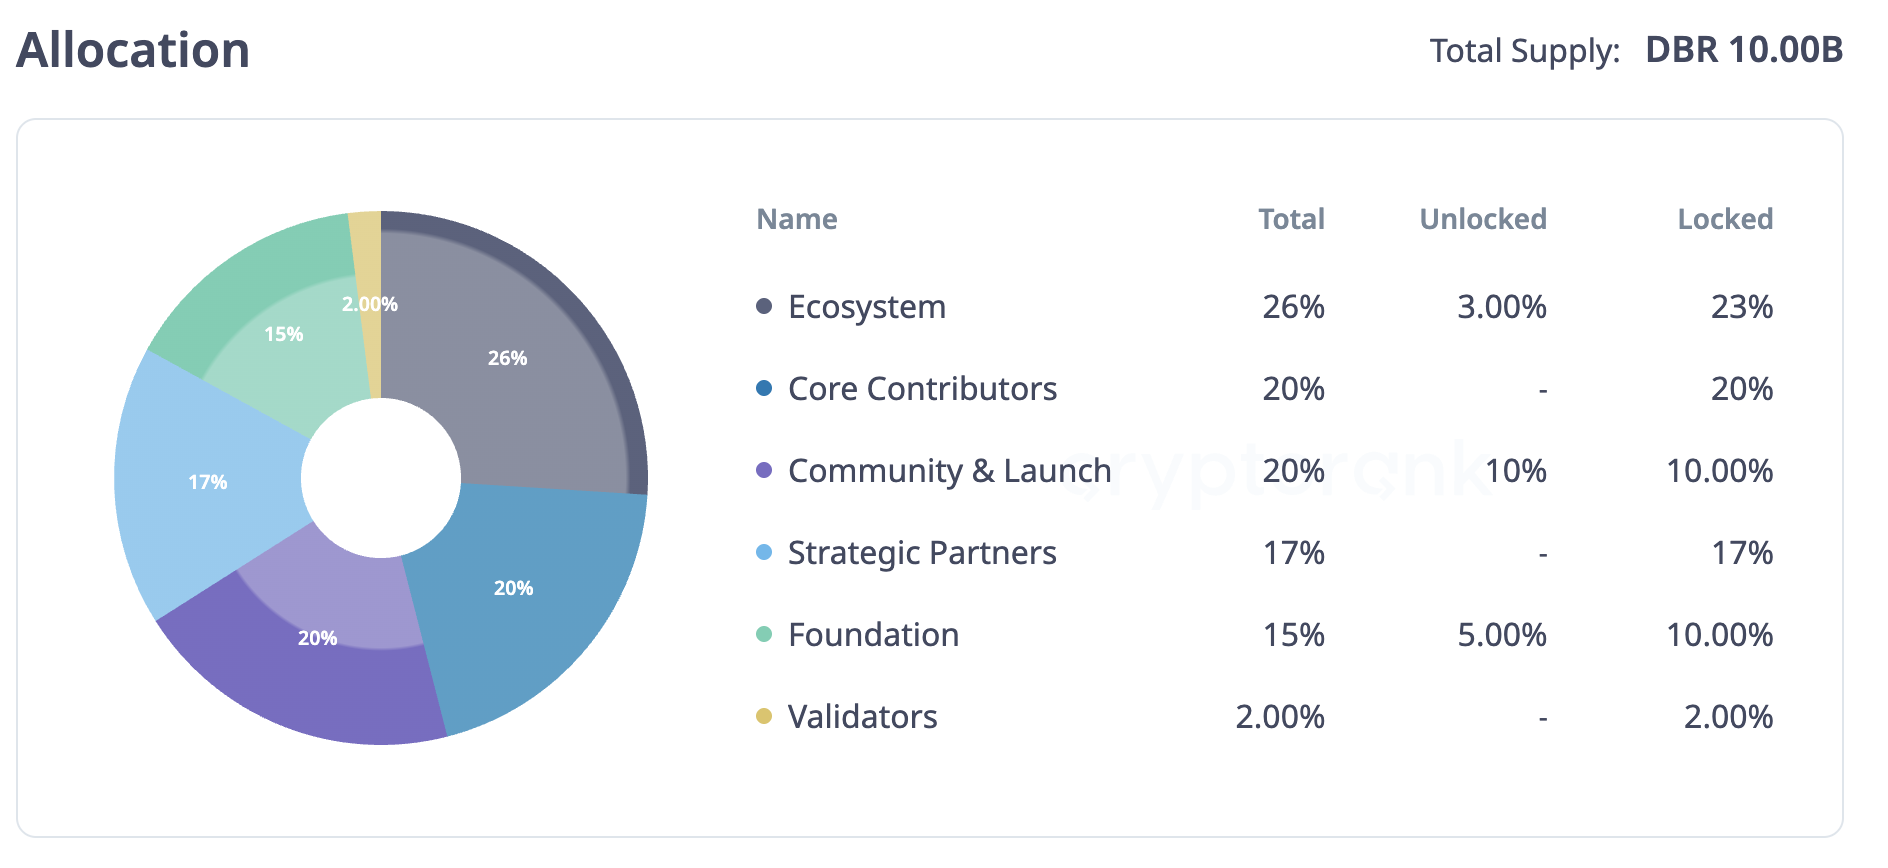
deBridge (DBR)
Unlock Date: April 17
Number of Tokens to be Unlocked: 1.11 billion DBR (11.1% of Total Supply)
Current Circulating Supply: 1.16 billion
Total supply: 10 Billion DBR
deBridge is a cross-chain protocol that allows users to transfer assets and data between different blockchains. It aims to simplify interoperability and make decentralized applications more connected and efficient.
On April 17, 1.11 billion BDR tokens, worth around $32.19 million, will be unlocked. This unlock will nearly double the current circulating supply, adding roughly 95% more tokens to the market.
The allocation includes 400 million for core contributors, 340 million for strategic partners, and 176.93 million for the ecosystem. The rest goes to the community, foundation, and validators. Despite the upcoming unlock, deBridge has gained nearly 38% in the past month, with its market cap now nearing $34 million.
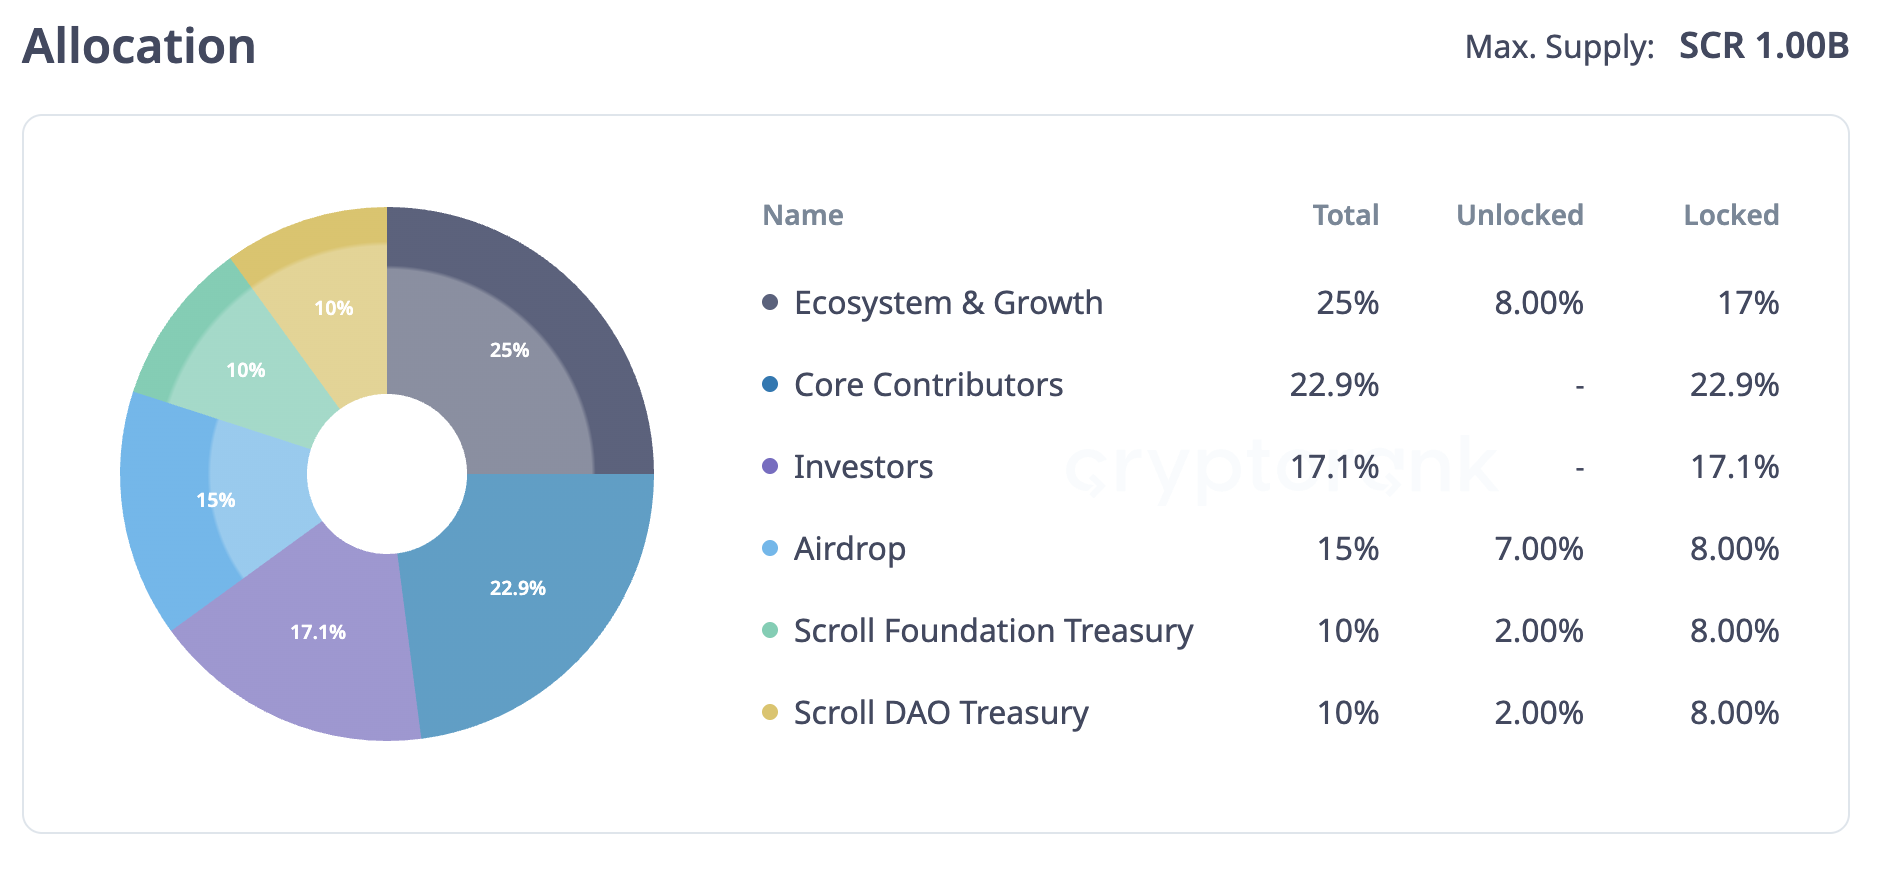
Unlock Date: April 22
Number of Tokens to be Unlocked: 40 million SCR (4% of Total Supply)
Current Circulating Supply: 190 million
Total supply: 1 Billion SCR
Scroll is a Layer 2 solution built to improve Ethereum’s scalability and efficiency. It uses zkRollup technology to lower transaction costs and increase throughput, helping ease issues like high gas fees and congestion.
On April 22, 40 million SCR tokens, valued at about $11.52 million, will be unlocked. This unlock could introduce added liquidity to the market and maybe renewed interest in Scroll. Its price is down roughly 46% in the last 30 days, with its market cap at $55 million, down from its peak of $265 in October 2024.
All 40 million tokens are allocated for airdrops.
Disclaimer
In line with the Trust Project guidelines, this price analysis article is for informational purposes only and should not be considered financial or investment advice. BeInCrypto is committed to accurate, unbiased reporting, but market conditions are subject to change without notice. Always conduct your own research and consult with a professional before making any financial decisions. Please note that our Terms and Conditions, Privacy Policy, and Disclaimers have been updated.

Cardano Price Eyes Massive Pump In May Following Cyclical Patern From 2024

Solana (SOL) Price Risks Dip Below $110 as Bears Gain Control

Top 3 Made in USA Coins to Watch This Week

Japan Set To Classify Cryptocurrencies As Financial Products, Here’s All

3 Token Unlocks for April: Parcl, deBridge, Scroll

Whales Accumulate 470,000 Ethereum In One Week – Bullish Momentum Ahead?

2.52 Million Altcoins Are Ruining Crypto’s Future

Animoca Brands Valuation Tanks 75% In Two Years, Here’s Why

Crypto exchange BingX hacked for $43 million

Are The Big Players Losing Interest?

Hong Kong’s Securities Association Tips Authorities On Crypto Self-Regulation

Coinbase cbBTC Set to go Live on Solana
2.52 Million Altcoins Are Ruining Crypto’s Future
Animoca Brands Valuation Tanks 75% In Two Years, Here’s Why
Crypto exchange BingX hacked for $43 million
Are The Big Players Losing Interest?
Hong Kong’s Securities Association Tips Authorities On Crypto Self-Regulation
Coinbase cbBTC Set to go Live on Solana
-

 Altcoin23 hours ago
Gemini Crypto Exchange Announces Rewards For XRP Users, Here’s How To Get In
-

 Ethereum15 hours ago
Ethereum MVRV Ratio Nears 160-Day MA Crossover – Accumulation Trend Ahead?
-

 Ethereum14 hours ago
Ethereum May Have Hit Cycle Bottom, But Pricing Bands Signal Strong Resistance At $2,300
-

 Market14 hours ago
Bitcoin (BTC) Whales Accumulate as Market Faces Uncertainty
-

 Ethereum13 hours ago
Ethereum Analyst Eyes $1,200-$1,300 Level As Potential Acquisition Zone – Details
-

 Bitcoin13 hours ago
Gold Keeps Outperforming Bitcoin Amid Trump’s Trade War Chaos
-

 Regulation20 hours ago
Kentucky Governor Signs Off On ‘Bitcoin Rights’ Bill, Strengthening Crypto Protections
-
 Altcoin12 hours ago
Analyst Reveals Why The XRP Price Can Hit ATH In The Next 90 To 120 Days