
Market
FET Price Crash Triggers Historic Losses, Yet Whales Accumulate

Artificial Superintelligence Alliance (FET) has recently experienced a sharp 34% price decline, marking its largest drop in months. This crash validated a three-month-old pattern, which predicted such a correction.
While investors are suffering historic losses, whales seem to be capitalizing on the lower prices, indicating potential confidence in a future recovery.
Artificial Superintelligence Alliance Investors Are Spooked
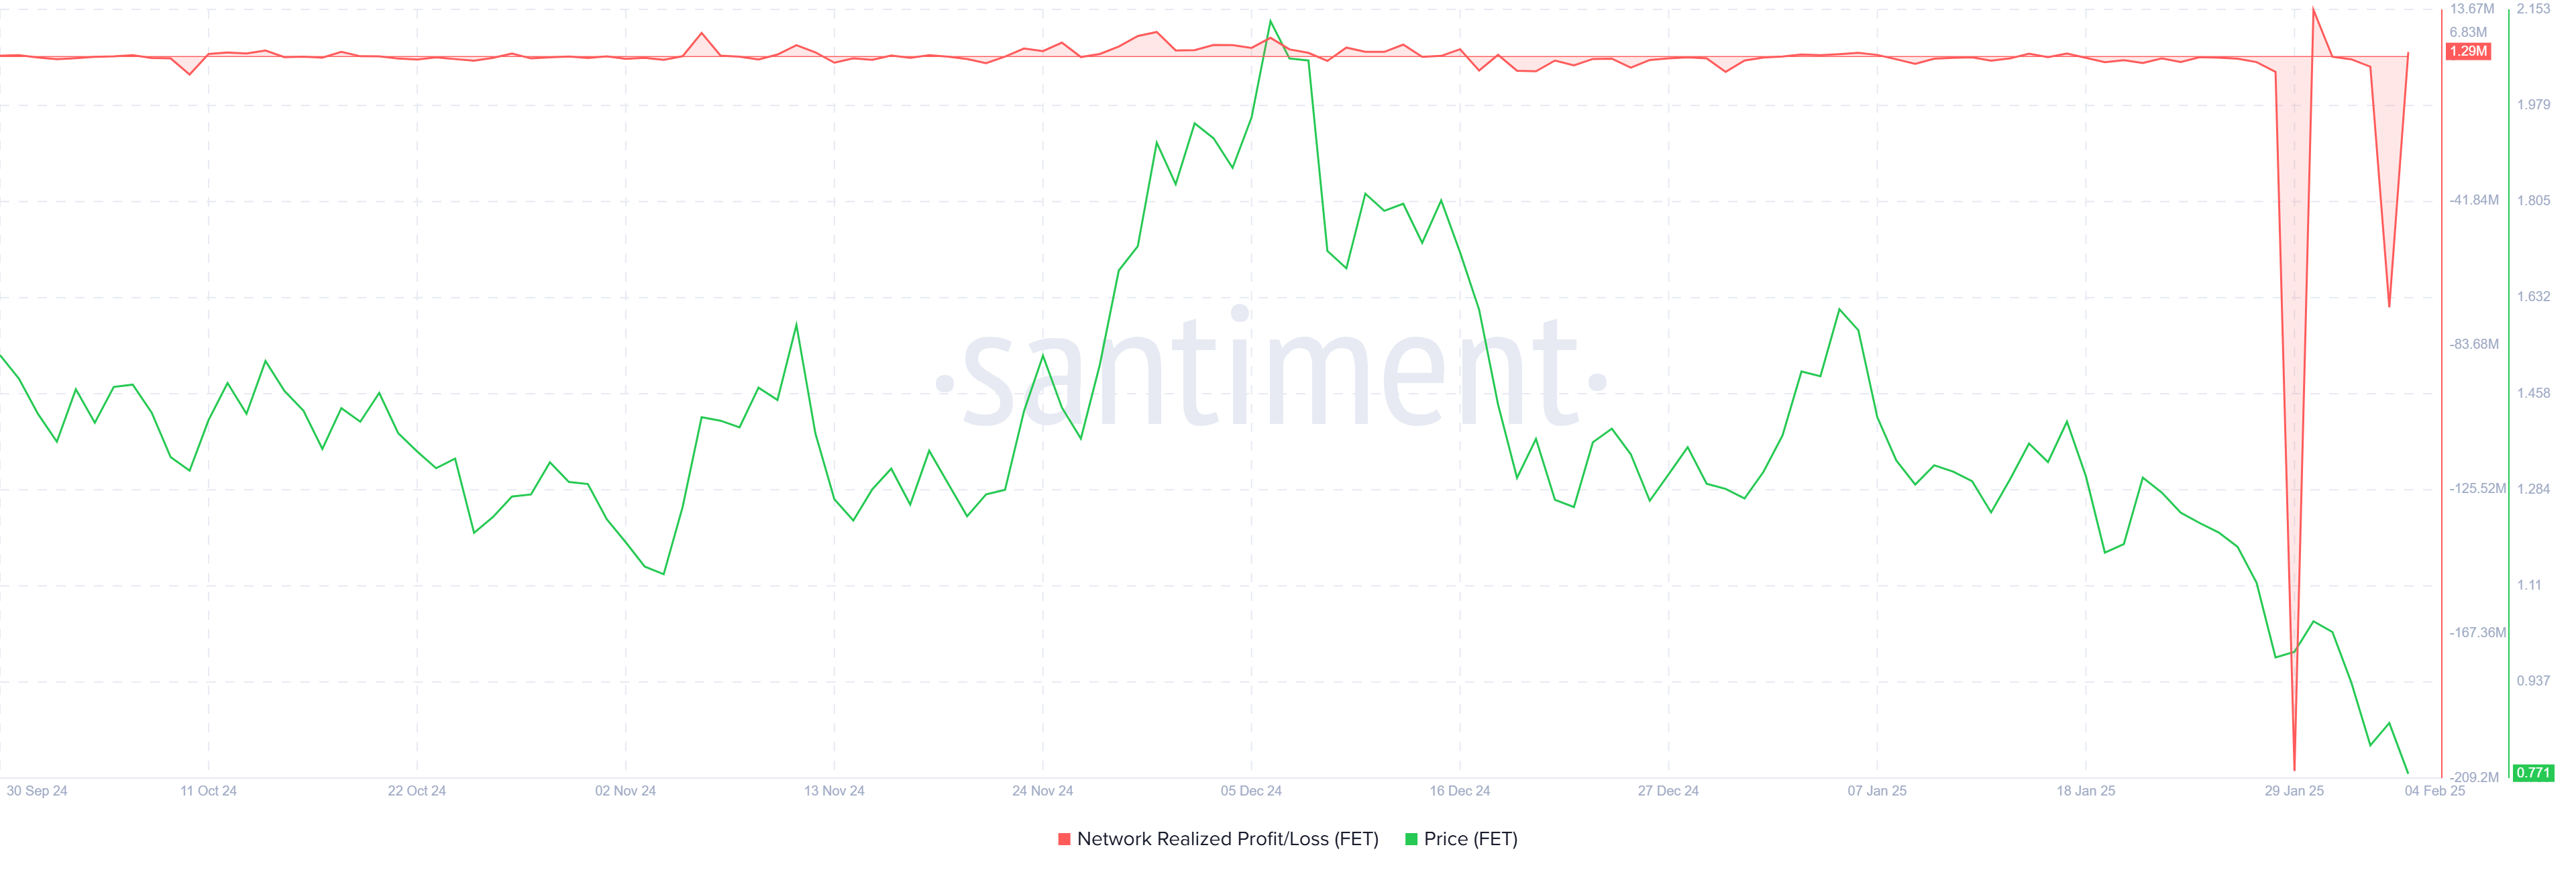
Realized losses for FET holders have reached their highest levels in the altcoin’s history. This is a result of many investors selling off their holdings earlier this week to prevent further losses. As a result, the general market sentiment remains highly bearish.
Many retail investors are hesitant to make moves, reflecting the pessimistic outlook within the market.
This sell-off has led to heightened caution among the investor base, with traders refraining from significant action in the face of market volatility. The fear of additional losses is currently overpowering the desire to accumulate, causing many to stay on the sidelines.
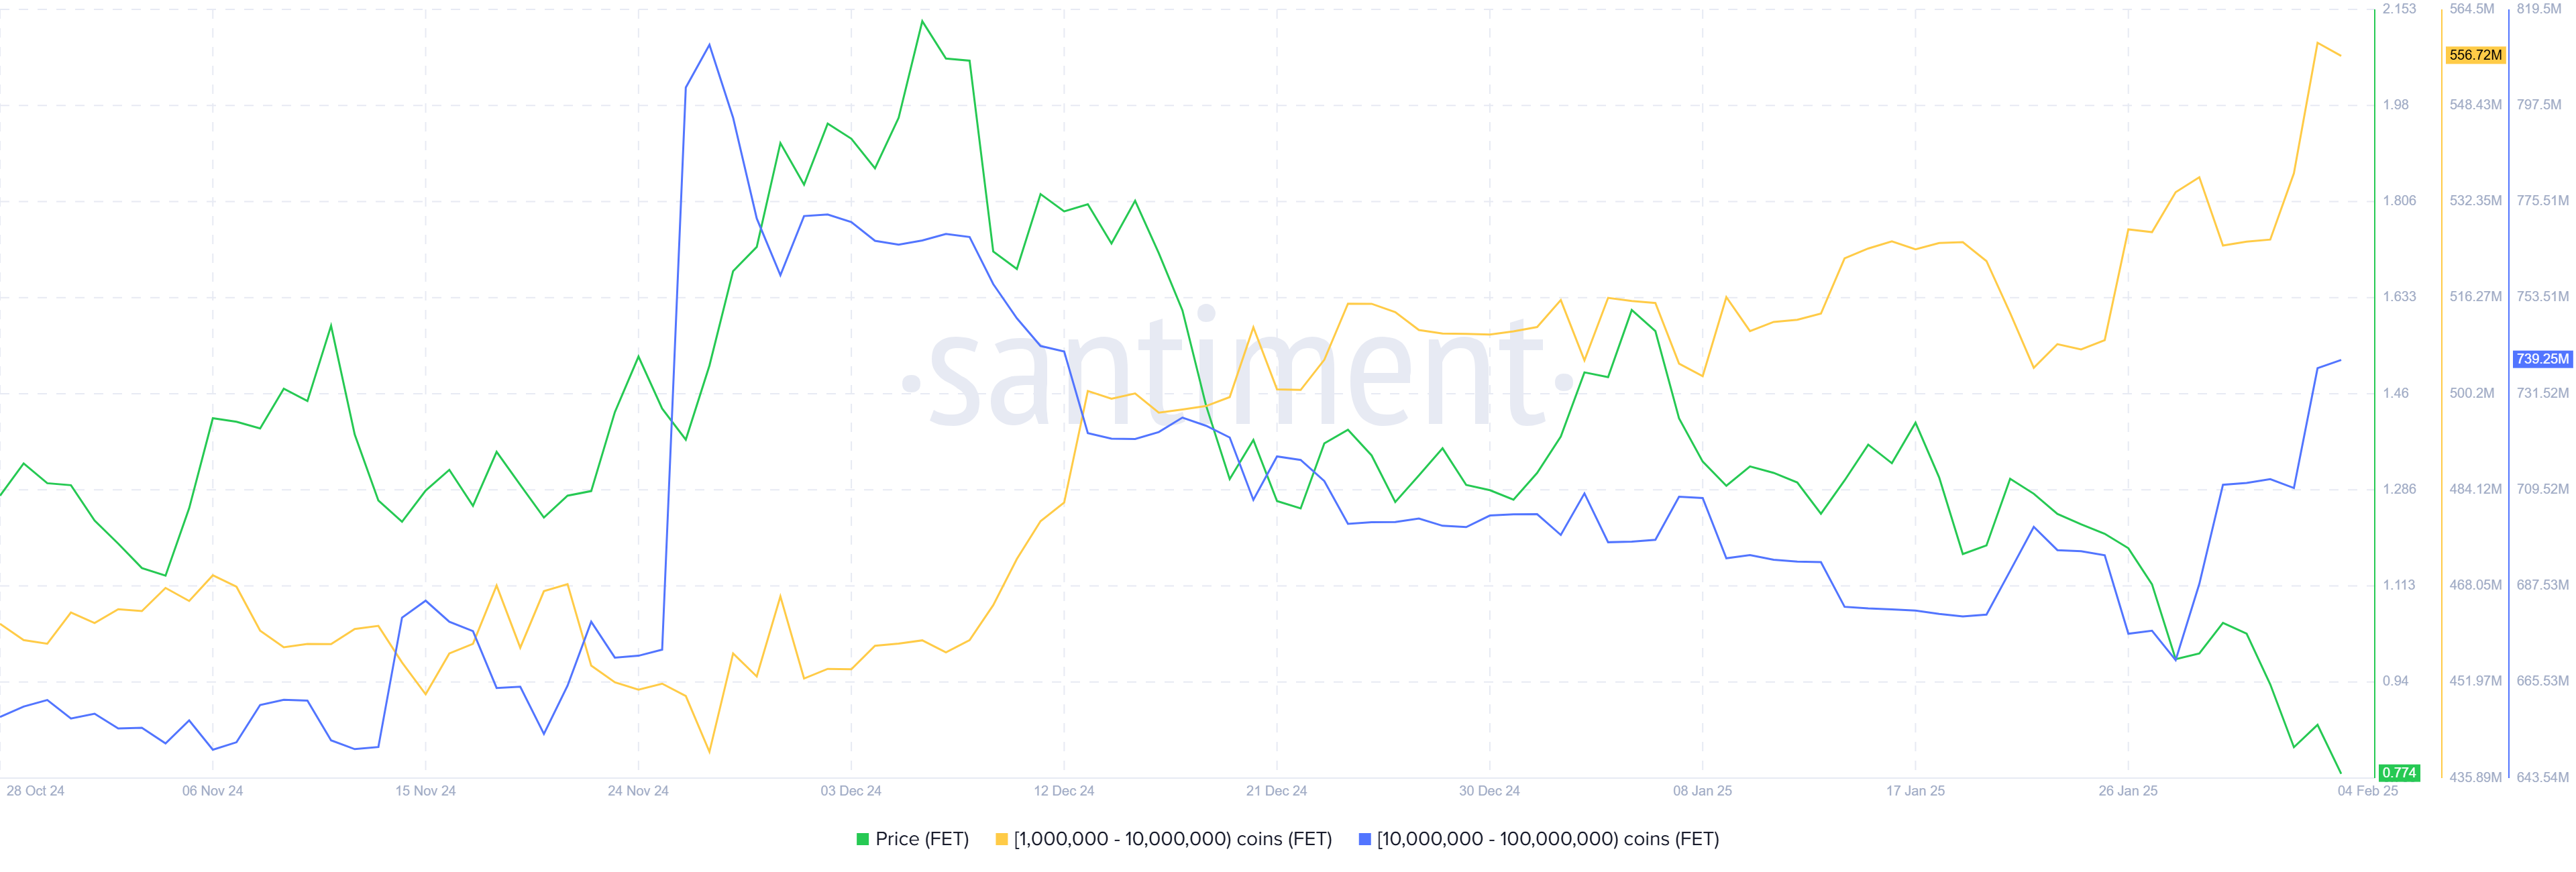
Despite the widespread losses, whale activity has been notably bullish. Addresses holding between 1 million and 100 million FET have added approximately 92 million FET to their holdings over the past week, valued at $70.8 million. This accumulation at lower price levels signals that whales are positioning themselves for a potential recovery, showing confidence in FET’s long-term potential.
This whale accumulation is a key sign of optimism despite the current market downturn. Whales are often viewed as the more experienced market participants, and their ability to buy during periods of significant price decline may indicate their belief in an eventual recovery.
FET Price Prediction: Bouncing Off The Support
FET’s price broke through the key support level of $1.19, falling to $0.77 at the time of writing. This decline confirms the validity of the head and shoulder pattern, which predicted a 43.6% drop to $0.73. The market seems to be experiencing a sharp correction, as expected, leading to this significant pullback.
Currently, FET is holding above the support of $0.76, suggesting it may have reached its market bottom. If this support is sufficient, the altcoin will have a chance to recover its recent losses. However, for a successful recovery, FET must flip $1.04 into support, signaling the end of the correction phase.
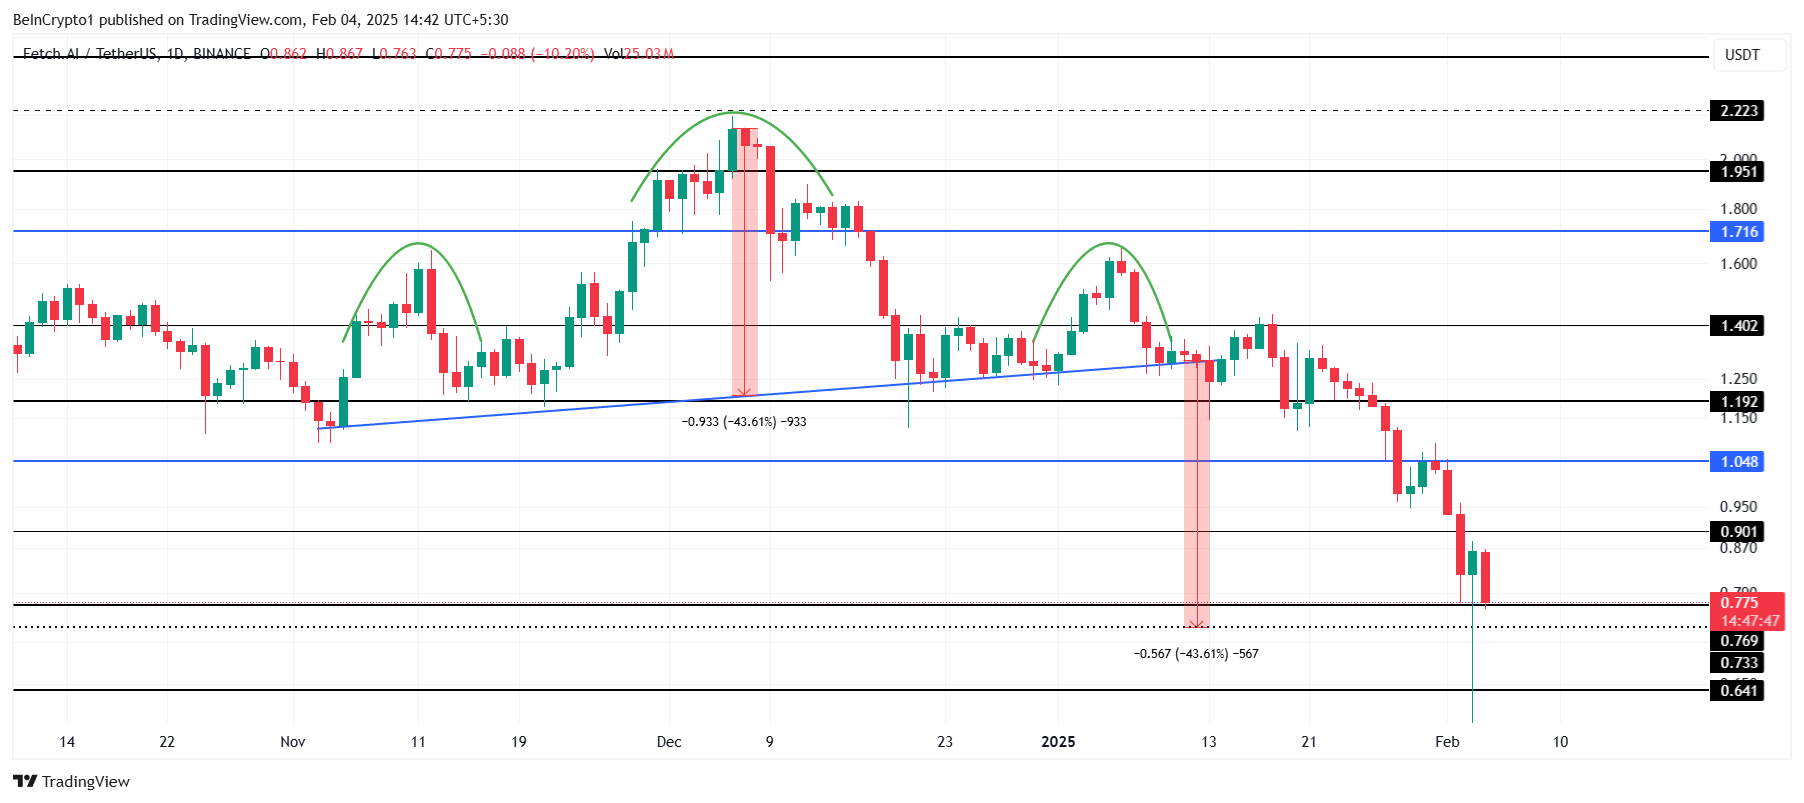
On the other hand, if FET loses the $0.76 support level, it could fall further. The next potential target is $0.73, and a drop below this level could see the price approaching $0.64, which would invalidate the bullish outlook and lead to further losses.
Disclaimer
In line with the Trust Project guidelines, this price analysis article is for informational purposes only and should not be considered financial or investment advice. BeInCrypto is committed to accurate, unbiased reporting, but market conditions are subject to change without notice. Always conduct your own research and consult with a professional before making any financial decisions. Please note that our Terms and Conditions, Privacy Policy, and Disclaimers have been updated.


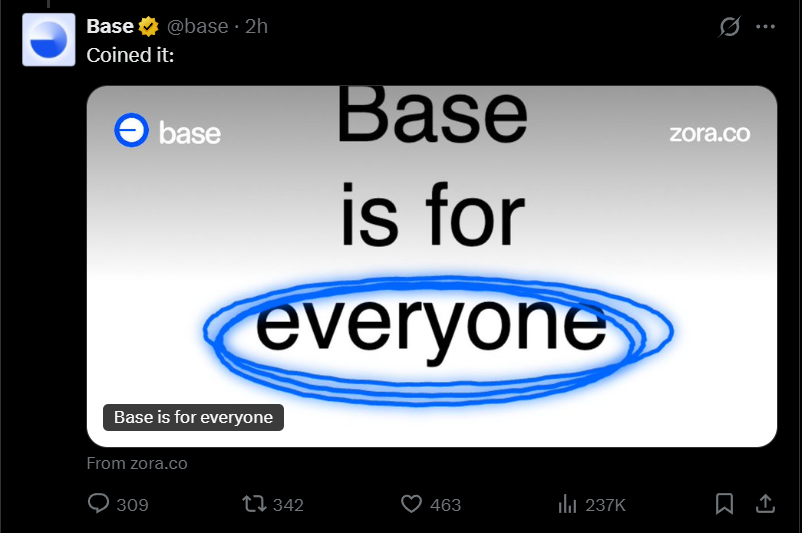
Coinbase’s Layer 2 network, Base, is facing intense scrutiny after what appears to be a major pump and dump—one that it inadvertently helped fuel. The project’s official Twitter account publicly promoted a meme coin titled “Base is for everyone.”
This triggered a speculative surge, driving the token’s market cap to an estimated $15 to $20 million within hours of launch. The token quickly plummeted near zero in mutes.
Did Base Just Help Fuel a Pump and Dump?
Base’s tweet, which featured promotional imagery and direct links to the meme coin on Zora, created the perception of legitimacy.
Traders piled in, and price charts reflected an explosive rally—followed by an equally sharp collapse.
Within one 4-hour trading window, a green candle representing millions in inflow was immediately reversed by a red candle of equal size, marking a total loss of liquidity and confirming a textbook pump and dump.
The token’s value fell by more than 99%, and trading volumes on Uniswap surged past $13 million during the brief window of activity.
There is massive ongoing outrage against both Coinbase and Base. Crypto influencers have called the incident a failure of due diligence and communications strategy.
Accusations of incompetence and poor risk oversight are spreading fast on social media, while memes mocking the network’s “Base is for everyone” slogan are everywhere.
Base is yet to provide an official response to the incident.
Disclaimer
In adherence to the Trust Project guidelines, BeInCrypto is committed to unbiased, transparent reporting. This news article aims to provide accurate, timely information. However, readers are advised to verify facts independently and consult with a professional before making any decisions based on this content. Please note that our Terms and Conditions, Privacy Policy, and Disclaimers have been updated.

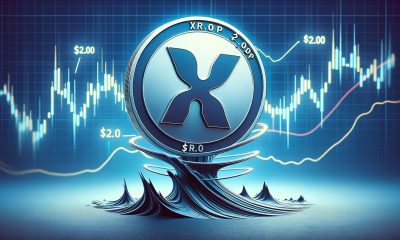
XRP is back trading above, $2, and bullish momentum is gradually creeping back compared to its price action at the end of March and beginning of April. Crypto analyst EGRAG CRYPTO believes this week could highlight a turning point for a full flip into bullish momentum, and how the XRP price closes out the week will be very important.
According to the analyst’s outlook, which was posted on social media platform X, the current XRP candle on the weekly timeframe is hovering just above both $2.10 and the 21-week Exponential Moving Average (EMA). However, he noted that the real confirmation lies with if XRP can manage to close the week with a full-bodied candle above $2.25.
Why Is $2.25 Important For XRP’s Price?
The $2.25 level has now become more than just another short-term resistance. It is what EGRAG considers the final barrier to validating the recovery structure forming after March and April’s sharp retracement. His weekly chart shows XRP climbing out from a significant low after bouncing off the 0.888 Fib extension level and now stabilizing above the yellow 21-week EMA line.
The alignment of XRP’s price above both the $2.10 price level and this moving average adds credibility to the potential of a bullish continuation, but EGRAG makes it clear that a weekly close above $2.25 is the “lock-in” point. From a technical standpoint, this would mark the first full-bodied weekly candle above the 21W EMA since the past four weeks. If achieved, this can be interpreted confirmation that bulls have regained dominance and that a bottom was established on April 7.

Furthermore, it suggests that the April 7 bottom will continue to hold as support going forward. The chart also outlines close price targets at $2.51 and $2.60, with Fibonacci extension levels projecting even higher zones at $2.69 on the way to crossing back above $3.
Failing To Close Above $2.25 Could Reintroduce Unwanted Narratives
EGRAG also issued a cautionary note in case there isn’t a clean breakout. Should XRP fail to close the weekly candle above $2.25, he warned it could trigger a return of bearish narratives, including what he referred to as a possible “tariff issue.” This is referring to the recent tariff back-and-forth between the US and China in the past month, which has unbalanced the investment markets.
A strong rejection could see the XRP price pull back toward the $1.96 Fibonacci level or even lower into the broader support band of around $1.58 to $1.30. The white box region on the chart above would then become the primary battleground for bulls and bears if a close above $2.25 is not secured by the end of the week.


Mayer Mizrachi, the mayor of Panama City, Panama, announced today that the city government will accept payments in crypto. It will accept Bitcoin, Ethereum, and two stablecoins for taxes, permits, fees, etc.
However, Mizrachi clarified that the municipal government has a legal requirement to accept these funds only in USD. It will exchange cryptoassets for cash with a partnered bank, presenting a severe limit to potential crypto adoption.
Is Panama City Accepting Crypto?
In the last few months, a tide of pro-crypto regulation has swept over many of the world’s jurisdictions. This obviously includes the United States at the federal and state levels, but many other countries are rising to the occasion.
Case in point, the mayor of Panama’s capital city just announced that the municipal government will accept payments in crypto.
“Panama City council has just voted in favor of becoming the first public institution of government to accept payments in crypto. Citizens will now be able to pay taxes, fees, tickets and permits entirely in crypto starting with BTC, ETH, USDC, USDT,” claimed Mayer Mizrachi, the mayor of Panama City.
Mizrachi went on to explain some previous efforts to accept crypto payments in Panama. Four years ago, a legislative initiative tried to enable crypto payments all over the country.
It got some traction but eventually stalled out in 2022. In 2023, the Supreme Court ruled the bill “unenforceable.” Since then, it doesn’t seem like any other serious efforts have made progress.
Panama City’s municipal government is circumventing the legislature to accept crypto payments, but the strategy has significant drawbacks. Mizrachi explained that public institutions must receive funds in US dollars, and he couldn’t circumvent this requirement.
In other words, any crypto payments will actually go to a partnered bank. The bank will actually custody (or dispose of) these assets, while the city only holds USD. Mizrachi’s effort avoids a contentious legislative battle, but its actual impact might be severely limited.
Although Panama has its own currency, the balboa, the US dollar has more legal standing in a few different ways. It’s a legal tender; public institutions have to accept it, and the balboa is actually pegged to the dollar anyway.
This is a very similar situation to what made El Salvador accept Bitcoin as a currency, as it also had to use the US dollar as its sole currency.
Mizrachi explained that this short workaround will increase “the free flow of crypto” through Panama’s economy, but it may not be that simple. Depending on the agreement between the city government and partnered banks, it could just dump its cryptoassets on the international market.
If Panama wants to actually adopt cryptocurrency, it may need more sustainable measures integrated to the local economy.
Disclaimer
In adherence to the Trust Project guidelines, BeInCrypto is committed to unbiased, transparent reporting. This news article aims to provide accurate, timely information. However, readers are advised to verify facts independently and consult with a professional before making any decisions based on this content. Please note that our Terms and Conditions, Privacy Policy, and Disclaimers have been updated.

Base Meme Coin Wipes $15 Million After Official Promotion

ETF Issuers Bring Stability to Bitcoin Despite Tariff Chaos

Here’s What Happens If The XRP Price Closes Out This Week Above $2.25

Over 1.9M Ethereum Positioned Between $1,457 And $1,598 – Can Bulls Hold Support?

Bitcoin and Ethereum Now Accepted by Panama City Government

Ripple and the SEC Receive 60-Day Pause to Reach Settlement

2.52 Million Altcoins Are Ruining Crypto’s Future

Animoca Brands Valuation Tanks 75% In Two Years, Here’s Why

Crypto exchange BingX hacked for $43 million

Are The Big Players Losing Interest?

Hong Kong’s Securities Association Tips Authorities On Crypto Self-Regulation

Coinbase cbBTC Set to go Live on Solana
2.52 Million Altcoins Are Ruining Crypto’s Future
Animoca Brands Valuation Tanks 75% In Two Years, Here’s Why
Crypto exchange BingX hacked for $43 million
Are The Big Players Losing Interest?
Hong Kong’s Securities Association Tips Authorities On Crypto Self-Regulation
Coinbase cbBTC Set to go Live on Solana
-

 Market23 hours ago
Hedera Under Pressure as Volume Drops, Death Cross Nears
-

 Market21 hours ago
3 US Crypto Stocks to Watch Today: CORZ, MSTR, and COIN
-

 Market20 hours ago
Bitcoin Price on The Brink? Signs Point to Renewed Decline
-

 Market22 hours ago
Ethena Labs Leaves EU Market Over MiCA Compliance
-
 Market18 hours ago
XRP Price Pulls Back: Healthy Correction or Start of a Fresh Downtrend?
-
 Altcoin18 hours ago
Ripple Whale Moves $273M As Analyst Predicts XRP Price Crash To $1.90
-
 Market19 hours ago
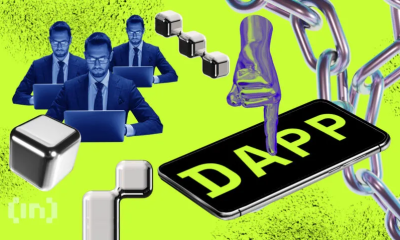
Ethereum Leads Q1 2025 DApp Fees With $1.02 Billion
-

 Market17 hours ago
Arbitrum RWA Market Soars – But ARB Still Struggles
