
Market
Expect Lower Prices as Correction Persists

The Ethereum (ETH) price is currently undergoing a correction, with the price approaching significant Fibonacci support levels. Whether Ethereum will break this support bearishly or not remains uncertain.
The possibility of Ethereum reaching a new annual low largely depends on market dynamics and investor sentiment. While there’s always the possibility of further downside, it’s also plausible that Ethereum could reverse its trend and move upward again in the near future.
Ethereum’s Price Trend: Ongoing Correction Continues
The Ethereum price has experienced a decline of approximately 31.3% since reaching a recent peak of around $4,094 the month before last. This substantial corrective movement has coincided with a bearish trend in the Moving Average Convergence/Divergence (MACD) histogram since last month.
Despite these bearish indicators, the MACD lines are currently still crossed in a bullish manner, while the Relative Strength Index (RSI) remains neutral. Ethereum is presently encountering significant Fibonacci support at approximately $2,866.
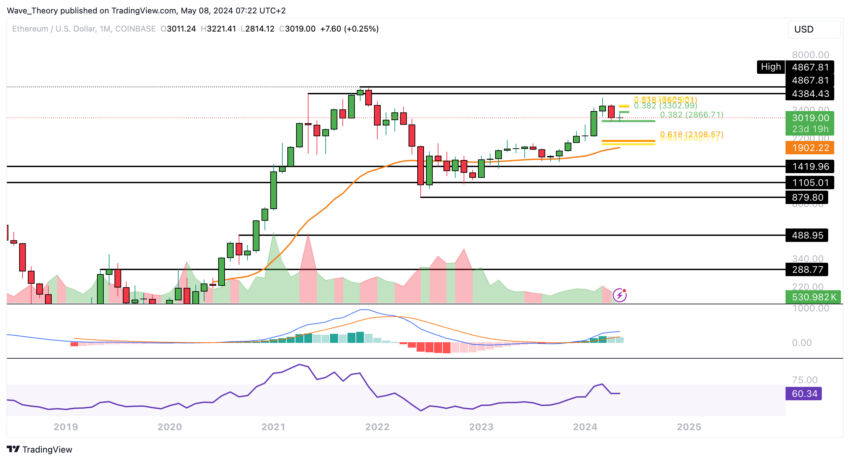
Should Ethereum break below this support level, the subsequent significant Fibonacci support is expected around $2,100. However, maintaining a position above this level would likely sustain the bullish momentum in the medium term.
Read More: Ethereum ETF Explained: What It Is and How It Works
Additionally, the 50-month EMA at around $1,900 provides supplementary support to the Ethereum price.
Ethereum’s Weekly Outlook: MACD Shows Bearish Signals
If Ethereum were to break below the current Fibonacci support level, the subsequent significant support is anticipated at the 50-week EMA around $2,520. Notably, the MACD exhibits a clear bearish trend in the weekly chart.
This is evidenced by the MACD histogram, which has been steadily declining in a bearish manner over the past few weeks. Moreover, the MACD lines have crossed bearishly.
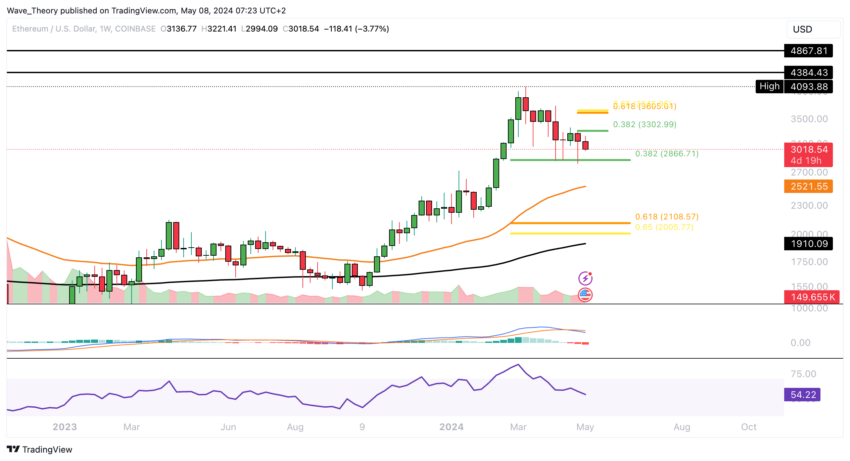
In contrast, the RSI remains neutral, and the EMAs continue to maintain a golden crossover, indicative of a bullish trend in the medium term.
Will Ethereum Retrace to $2,866? Analyzing the 0.382 Fib Level
Ethereum seems poised to revisit the .382 Fibonacci support level at approximately $2,866, with further support anticipated around the 200-day EMA at roughly $2,814.
Observing the MACD, the lines are approaching a potential bearish crossover, while the MACD histogram has displayed a downward trend over recent days, indicative of bearish sentiment.
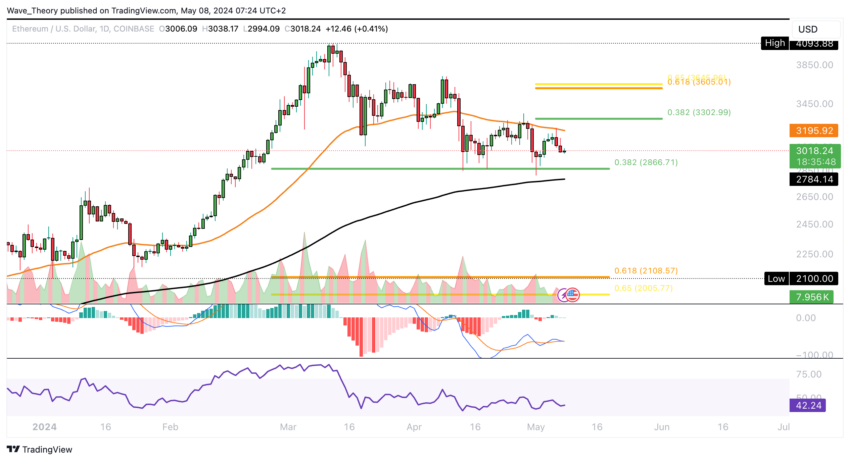
In contrast, the RSI remains neutral, offering no clear indications of bullish or bearish momentum. At the same time, the EMAs maintain a golden crossover, signaling a bullish trend in the short to medium term. Thus, the corrective phase appears to persist at present.
Can Ethereum Invalidate Its Current Correction?
To nullify the ongoing corrective phase, Ethereum’s price must surpass the 0.382 Fibonacci resistance level at approximately $3,303, followed by the golden ratio at around $3,700, signaling a return to the upward trajectory. However, the indicators on the 4-hour chart predominantly exhibit bearish signals.
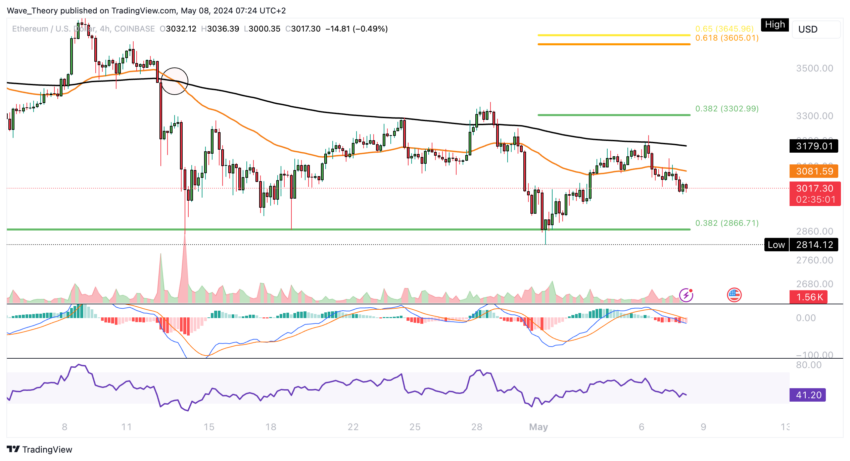
The EMAs have formed a death cross, affirming the current bearish trend in the short term. Furthermore, the MACD lines crossed bearishly, accompanied by a downward trend in the MACD histogram, while the RSI maintained a neutral stance.
Ethereum vs. Bitcoin: ETH Continues Its Downward Trend
Ethereum’s downward trajectory against BTC persists, with Ethereum encountering substantial support at approximately 0.043 BTC, a level it is in close proximity to. The MACD lines have crossed into bearish territory, with the histogram displaying a downward trend since the previous week. Despite this, the RSI remains neutral.
Read more: Ethereum (ETH) Price Prediction 2024 / 2025 / 2030
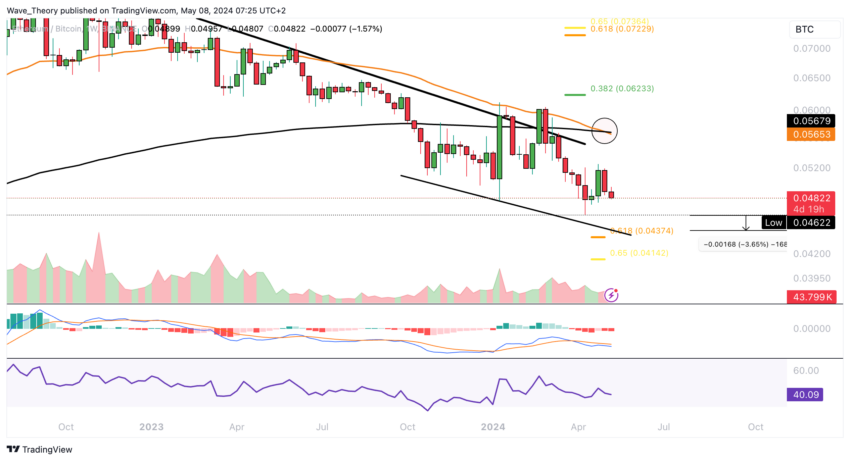
Moreover, the EMAs are on the verge of forming a bearish crossover, signaling a potentially prolonged bearish trend in the medium term. Ethereum’s stance against BTC evidently leans bearish.
Disclaimer
In line with the Trust Project guidelines, this price analysis article is for informational purposes only and should not be considered financial or investment advice. BeInCrypto is committed to accurate, unbiased reporting, but market conditions are subject to change without notice. Always conduct your own research and consult with a professional before making any financial decisions. Please note that our Terms and Conditions, Privacy Policy, and Disclaimers have been updated.


Veteran market analyst Peter Brandt has issued a gloomy year-end forecast for XRP, suggesting the asset may struggle to maintain its momentum despite recent gains.
On April 18, Brandt shared his updated analysis on X (formerly Twitter), projecting two possible scenarios for XRP’s market capitalization by year’s end.
Cautionary Outlook for XRP Despite Recent Surge
The first scenario places XRP’s market cap around $116.67 billion, while the second offers a more bearish outlook of just above $60 billion.
Essentially, both figures imply a decline from XRP’s current valuation of roughly $2.09 per token at a market capitalization of $121 billion.
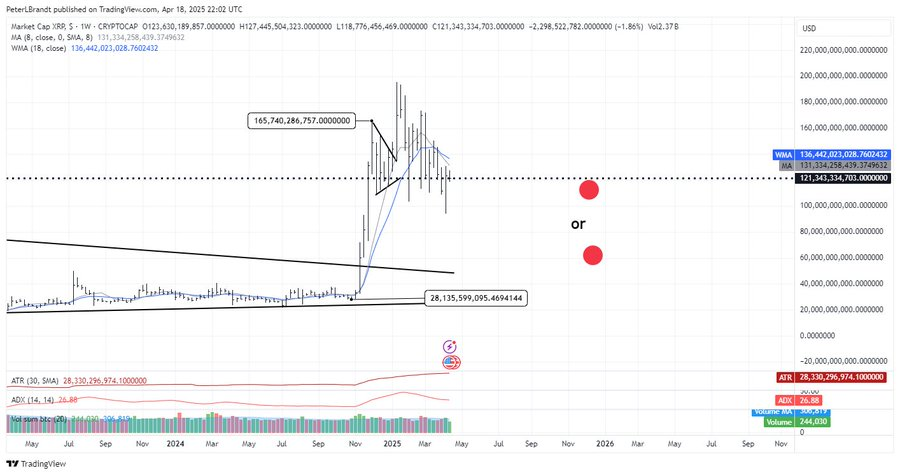
Brandt’s analysis is based on a technical pattern he previously identified on XRP’s price chart.
According to him, the formation resembles a classic head-and-shoulders setup—a pattern that often signals a trend reversal. If this plays out, XRP could fall as low as $1.07.
He added then that a move below $1.90 would confirm the pattern and likely trigger a steep correction of more than 50%. However, a break above $3 could invalidate the bearish outlook.
“XRP is forming a textbook H&S pattern. So, we are now range bound. Above 3.000 I would not want to be short. Below 1.9 I would not want to own it,” Brandt explained.
This cautious forecast follows a remarkable surge in XRP’s price since late 2024.
Following Donald Trump’s return to the White House, the token rallied over 300%, reaching a high of $3.28 before pulling back to its current level.
This price performance has led many investors to believe that the Trump administration’s friendlier stance toward digital assets could help the asset continue its rally.
One major catalyst was the Securities and Exchange Commission’s (SEC) decision to drop several lawsuits against crypto companies, including Ripple.
That shift reduced regulatory uncertainty and sparked renewed interest in XRP, culminating in the launch of exchange-traded funds (ETFs) focused on the product.
Adding to the momentum, Ripple launched its own stablecoin, RLUSD, aiming to tap into a growing segment of the digital asset market.
Still, Brandt’s warning suggests that XRP’s recent rally may not be sustainable if bearish pressure intensifies.
Ripple Not Rushing Into IPO Despite Industry Trend
Amid renewed attention on XRP’s performance, Ripple CEO Brad Garlinghouse has addressed growing speculation about the company going public.
In a recent video shared on X, Garlinghouse made it clear that Ripple does not plan to file for an IPO in 2025.
He emphasized that the company is not actively seeking external funding because it remains financially stable and is prioritizing product development and business expansion.
“Will we IPO in 2025? I think that’s a definitive no…We’ve said there’s no imminent plans to go public,” Garlinghouse stated.
While the company isn’t moving forward with an IPO this year, Garlinghouse didn’t completely close the door.
He noted that Ripple is evaluating whether going public would benefit the business in the long run. However, such a move isn’t a current priority.
“You have to ask yourself, okay, how does Ripple benefit from being a public company? And is it a high priority for us?” he said.
Moreover, Garlinghouse also hinted that the regulatory landscape—especially under new leadership at the SEC—could influence Ripple’s future decisions.
His comments come as several crypto firms, including Kraken and Ciecle, reportedly prepare for IPOs. For now, though, Ripple appears comfortable staying private until conditions become more favorable.
Disclaimer
In adherence to the Trust Project guidelines, BeInCrypto is committed to unbiased, transparent reporting. This news article aims to provide accurate, timely information. However, readers are advised to verify facts independently and consult with a professional before making any decisions based on this content. Please note that our Terms and Conditions, Privacy Policy, and Disclaimers have been updated.

SUI blockchain has been gaining traction in recent weeks, and its market cap is now approaching $7 billion. Fueled by meme coin activity and rising DeFi engagement, the network has seen a notable jump in DEX volume and technical momentum.
While indicators like RSI and EMA lines show early signs of a potential trend shift, overall strength remains mixed. SUI sits at a key crossroads—supported by short-term excitement but still needing stronger confirmation to challenge top-tier chains.
SUI Surges to 5th in DEX Volume, But Still Trails Top Chains
SUI’s recent surge in DEX activity has grabbed attention, largely fueled by growing interest in meme coins and speculative trading on its ecosystem. Over the past seven days, SUI’s DEX volume hit $2.1 billion, marking a 4.49% increase and continuing its steady upward trend.
This momentum has helped SUI outperform other ecosystems, most notably surpassing Arbitrum in the past 24 hours to become the fifth-largest chain by DEX volume.
However, despite the short-term gains, SUI still trails well behind top-tier networks like Base, BNB Chain, Ethereum, and Solana in total DEX activity.

These established ecosystems continue to dominate in terms of liquidity, user base, and overall transaction volume.
While SUI’s rise is notable, especially given its relatively new position in the DeFi ecosystem, it will need to sustain this growth and diversify beyond meme coin hype to truly challenge the leading players.
For now, it remains an exciting underdog with momentum—but not yet a major contender.
SUI Momentum Rebuilds, But Trend Remains Weak
SUI’s RSI is now at 51.86, up from 35.22 just three days ago. This suggests buying pressure has returned after a short-term dip, helping stabilize price action.
The Relative Strength Index (RSI) measures momentum on a scale from 0 to 100. Readings above 70 are considered overbought, while those below 30 indicate oversold conditions.

Sitting near the midpoint, SUI’s RSI points to neutral momentum. It hasn’t crossed above 70 in almost a month, showing that bullish strength has remained limited.
Meanwhile, SUI’s DMI (Directional Movement Index) shows that its ADX is down to 9 from 14.79 just two days ago. The ADX measures trend strength, and anything below 20 signals a weak or nonexistent trend.

The +DI is at 15.83 while the -DI is at 13.15, meaning buyers have a slight edge—but the low ADX suggests that edge isn’t strong. There’s no clear trend dominating the market right now.
Together, the RSI and DMI suggest that SUI is in a consolidation phase. Buyers are showing some activity, but not enough to build a strong, sustained trend—at least for now.
EMA Setup Still Bearish, But SUI Bulls Show Signs of Life
SUI’s EMA lines are still showing a bearish setup, with short-term averages sitting below the long-term ones. However, the gap between them has narrowed, and a potential golden cross may be forming.
A golden cross occurs when a short-term EMA crosses above a long-term one, often seen as a bullish signal. If this plays out, SUI could gain momentum and push toward the $2.28 resistance level.

Breaking above that could open the path toward $2.41 and $2.54. If bullish momentum builds further, SUI blockchain could even test the $2.83 level—its highest since early March.
But if the market fails to hold current levels and selling pressure returns, a correction could begin. In that case, it might fall back to test the $2.02 support.
Losing that support could bring deeper downside, potentially pushing SUI toward $1.71. For now, price action is at a critical point, with both breakout and breakdown scenarios on the table.
Disclaimer
In line with the Trust Project guidelines, this price analysis article is for informational purposes only and should not be considered financial or investment advice. BeInCrypto is committed to accurate, unbiased reporting, but market conditions are subject to change without notice. Always conduct your own research and consult with a professional before making any financial decisions. Please note that our Terms and Conditions, Privacy Policy, and Disclaimers have been updated.

The collapse of the MANTRA (OM) token has left investors reeling, with many facing significant losses. As analysts comb through the causes of the collapse, many questions remain.
BeInCrypto consulted industry experts to identify five critical red flags behind MANTRA’s downfall and reveal strategies investors can adopt to steer clear of similar pitfalls in the future.
MANTRA (OM) Crash: What Investors Missed and How to Avoid Future Losses
On April 13, BeInCrypto broke the news of OM’s 90% crash. The collapse raised several concerns, with investors accusing the team of orchestrating a pump-and-dump scheme. Experts believe that there were many early signs of trouble.
Yet, many overlooked the risks associated with the project.
1. MANTRA Red Flag: OM Tokenomics
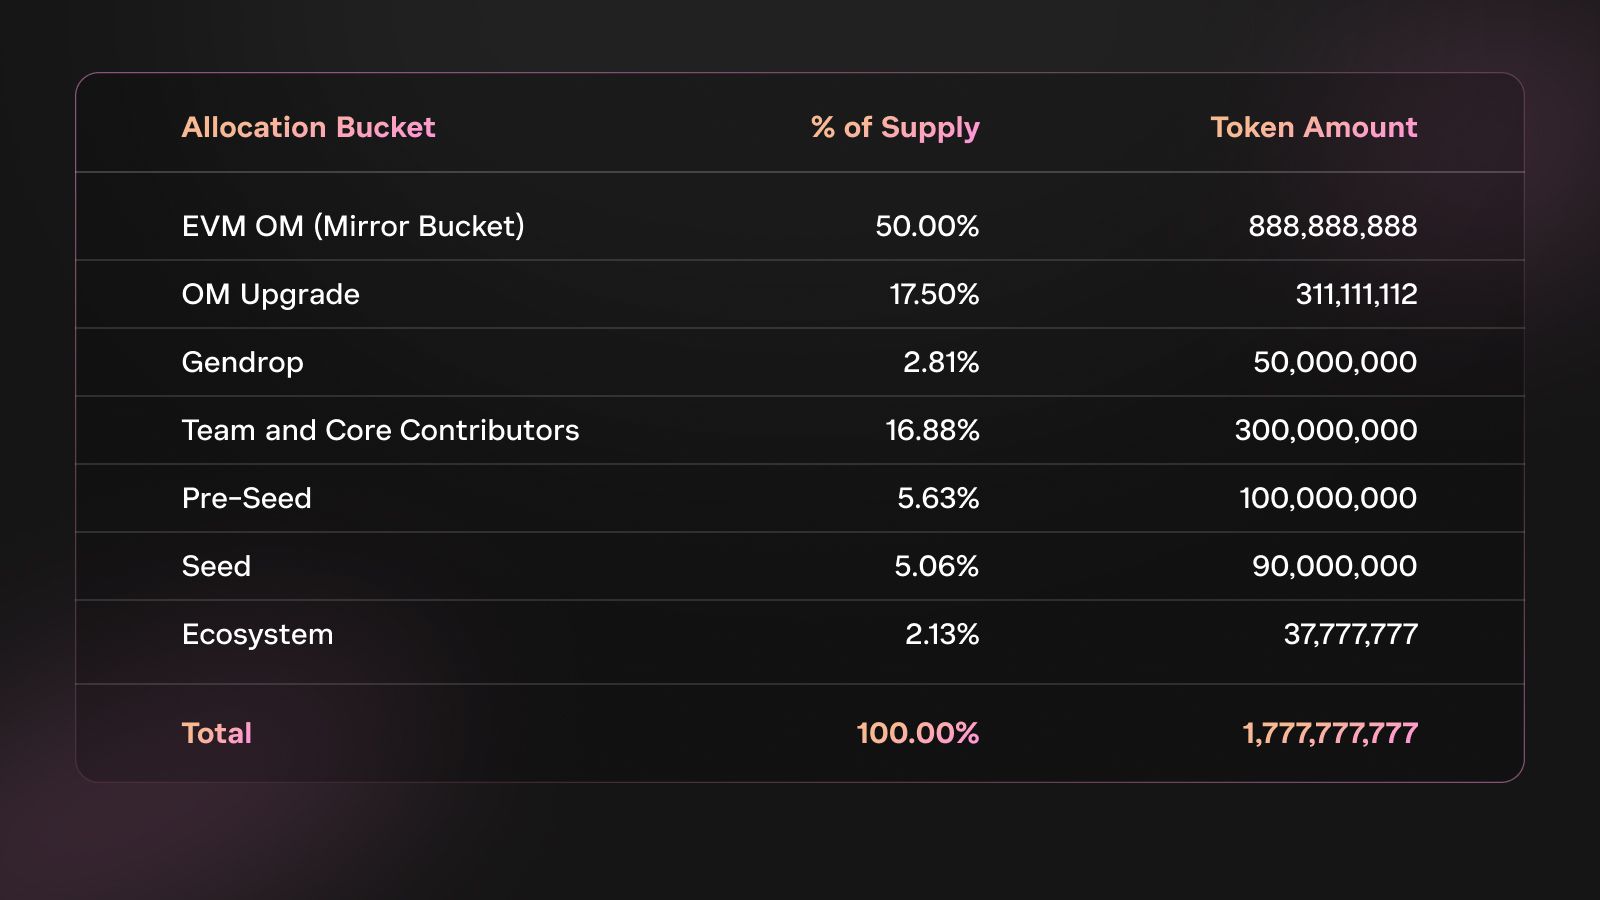
In 2024, the team changed OM’s tokenomics after a community vote in October. The token migrated from an ERC20 token to the native L1 staking coin for the MANTRA Chain.
In addition, the project adopted an inflationary tokenomic model with an uncapped supply, replacing the previous hard cap. As part of this transition, the total token supply was also increased to 1.7 billion.
However, the move wasn’t without drawbacks. According to Jean Rausis, co-founder of SMARDEX, tokenomics was a point of concern in the OM collapse.
“The project doubled its token supply to 1.77 billion in 2024 and shifted to an inflationary model, which diluted its original holders. Complex vesting favored insiders, while low circulating supply and massive FDV fueled hype and price manipulation,” Jean Rausis told BeInCrypto.
Moreover, the team’s control over the OM supply also raised centralization concerns. Experts believe this was also a factor that could have led to the alleged price manipulation.
“About 90% of OM tokens were held by the team, indicating a high level of centralization that could potentially lead to manipulation. The team also maintained control over governance, which undermined the project’s decentralized nature,” said Phil Fogel, co-founder of Cork.
Strategies to Protect Yourself
Phil Fogel acknowledged that a concentrated token supply isn’t always a red flag. However, it’s crucial for investors to know who holds large amounts, their lock-up terms, and whether their involvement aligns with the project’s decentralization goals.
Moreover, Ming Wu, the founder of RabbitX, also argued that analyzing this data is essential to uncover any potential risks that could undermine the project in the long term.
“Tools like bubble maps can help identify potential risks related to token distribution,” Wu advised.
2. OM Price Action
2025 has been marked as the year of significant market volatility. The broader macroeconomic pressures have weighed heavily on the market, with the majority of the coins experiencing steep losses. Yet, OM’s price action was relatively stable until the latest crash.
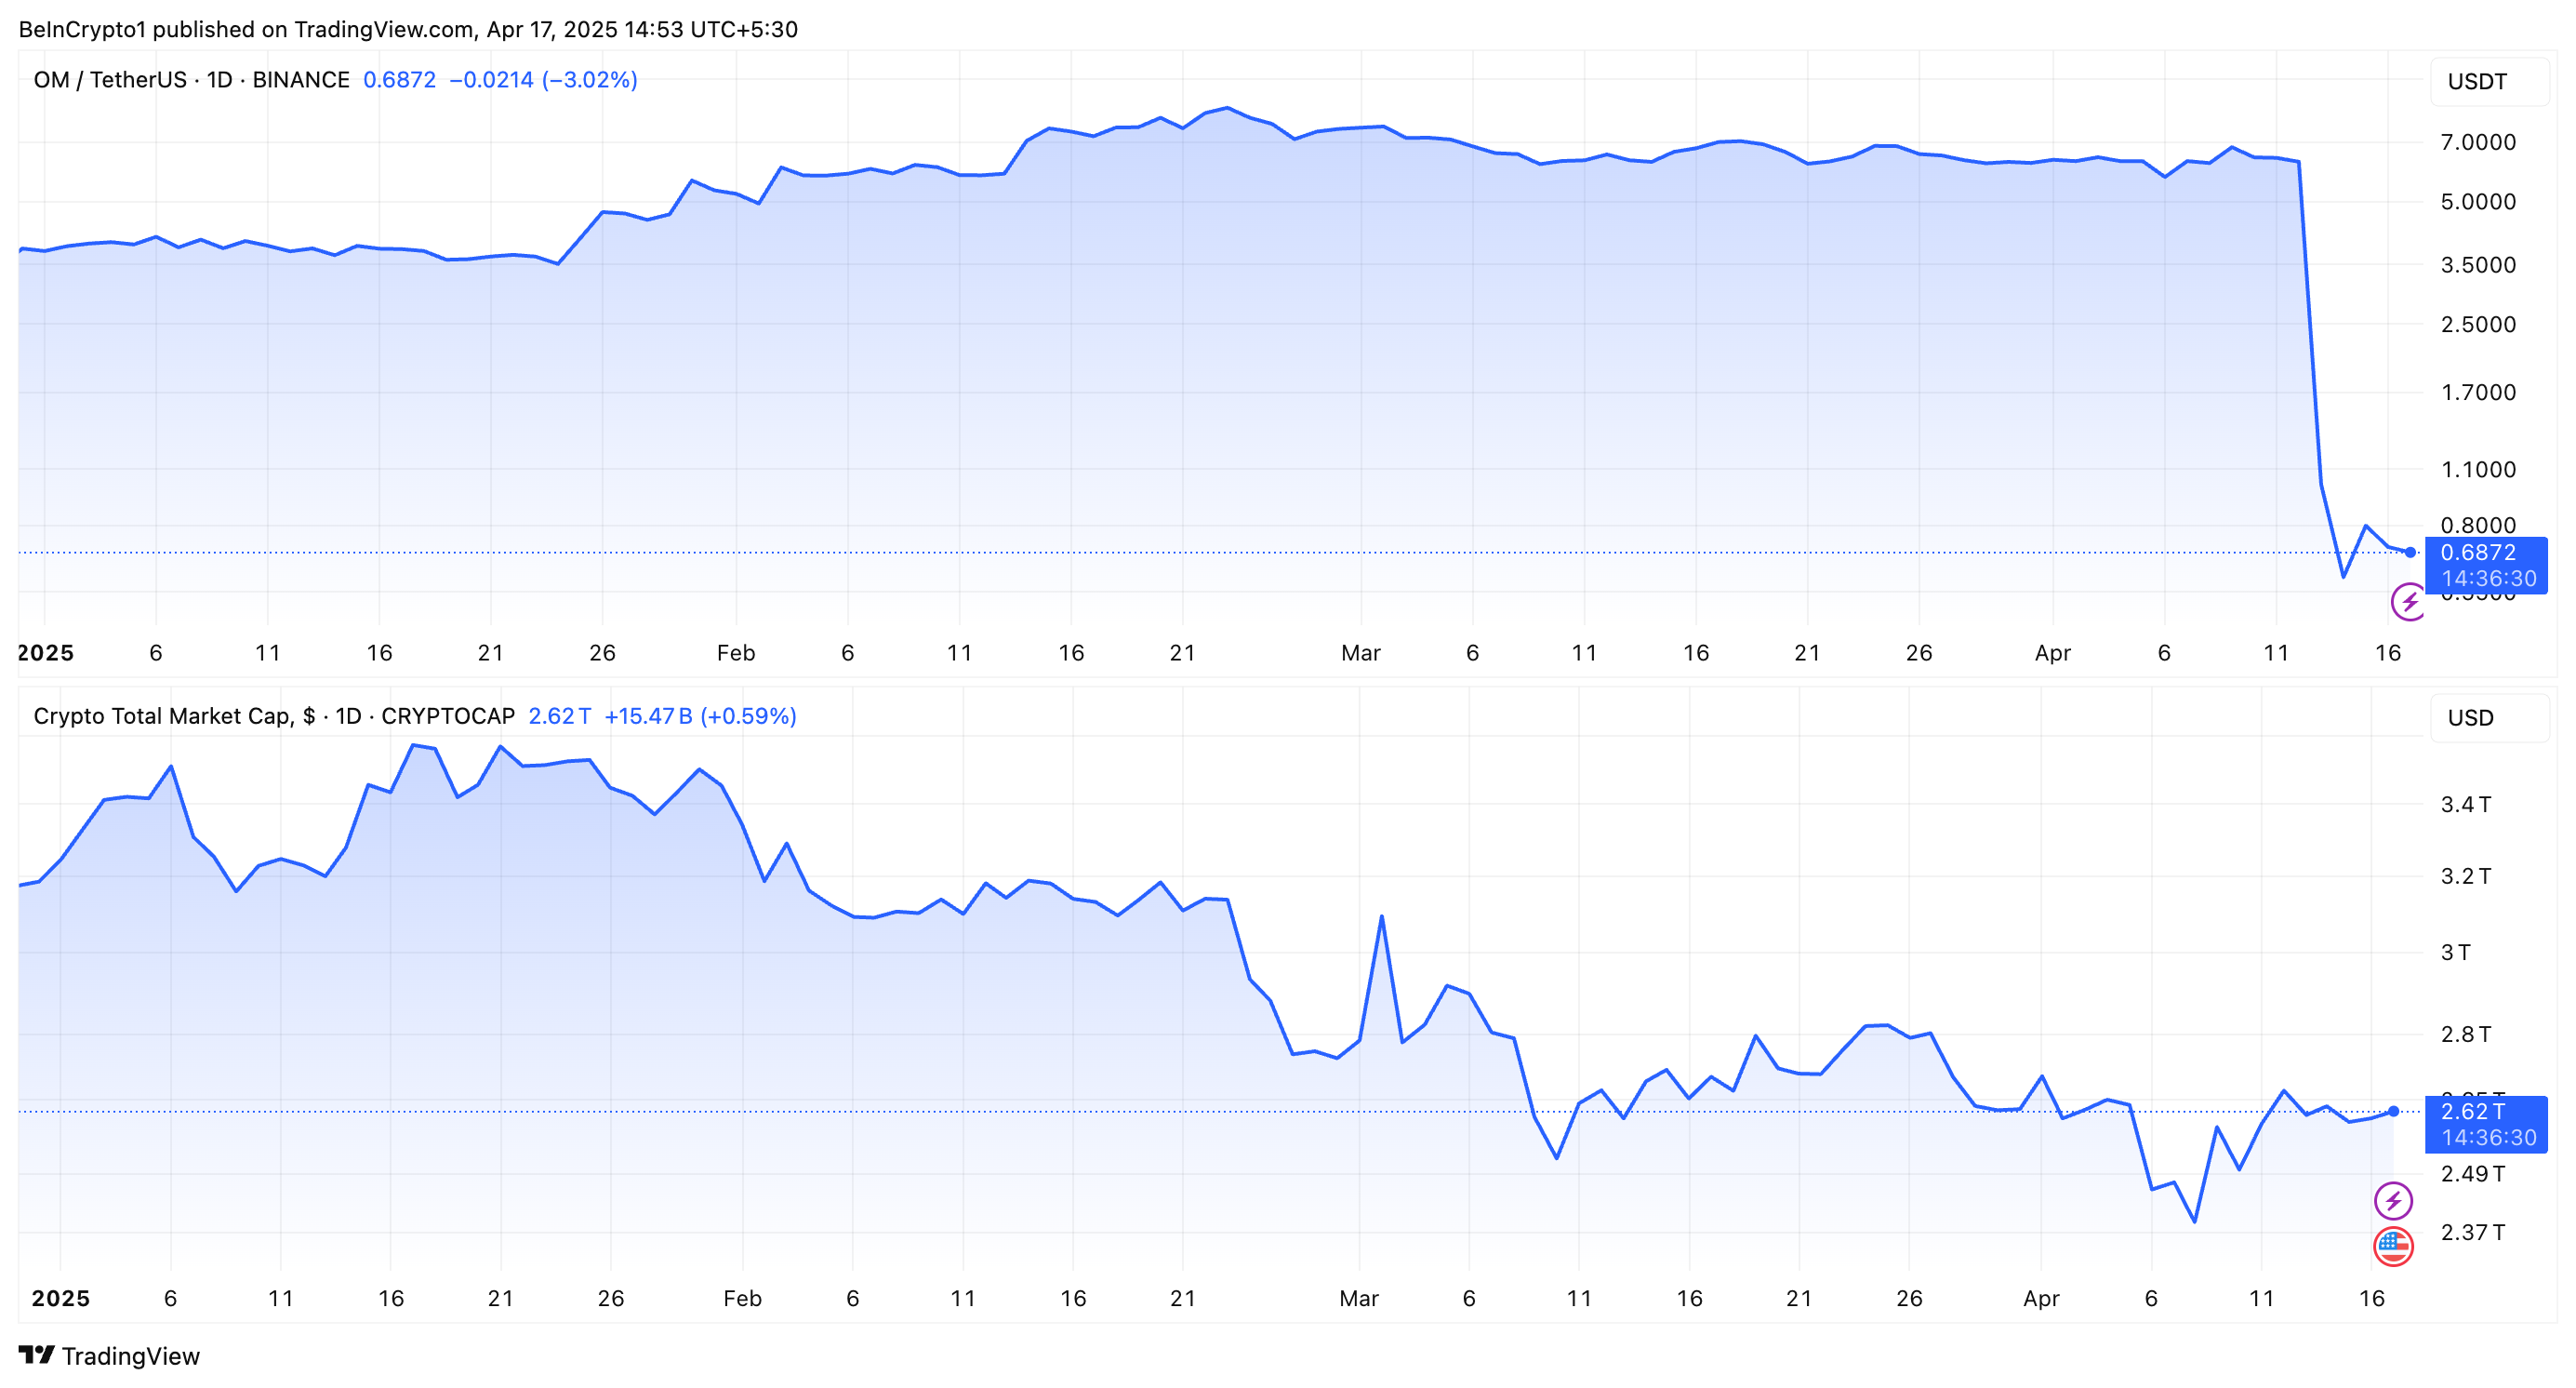
“The biggest red flag was simply the price action. The whole market was going down, and nobody cared about MANTRA, and yet its token price somehow kept pumping in unnatural patterns – pump, flat, pump, flat again,” Jean Rausis disclosed.
He added that this was a clear sign of a potential issue or problem with the project. Nevertheless, he noted that identifying the differentiating price action would require some technical analysis know-how. Thus, investors lacking the knowledge would have easily missed it.
Despite this, Rausis highlighted that even the untrained eye could find other signs that something was off, ultimately leading to the crash.
Strategies to Protect Yourself
While investors remained optimistic about OM’s resilience amid a market downturn, this ended up costing them millions. Eric He, LBank’s Community Angel Officer, and Risk Control Adviser emphasized the importance of proactive risk management to avoid OM-style collapses.
“First, diversification is key—spreading capital across projects limits single-token exposure. Stop-loss triggers (e.g., 10-20% below buy price) can automate damage control in volatile conditions,” Eric shared with BeInCrypto.
Ming Wu had a similar perspective, emphasizing the importance of avoiding over-allocation to a single token. The executive explained that a diversified investment strategy helps mitigate risk and enhances overall portfolio stability.
“Investors can use perpetual futures as a risk management tool to hedge against potential price declines in their holdings,” Wu remarked.
Meanwhile, Phil Fogel advised focusing on a token’s liquidity. Key factors include the float size, price sensitivity to sell orders, and who can significantly impact the market.
3. Project Fundamentals
Experts also highlighted major discrepancies in MANTRA’s TVL. Eric He pointed out a significant gap between the token’s fully diluted valuation (FDV) and the TVL. OM’s FDV reached $9.5 billion, while its TVL was only $13 million, indicating a potential overvaluation.
“A $9.5 billion valuation against $13 million TVL, screamed instability,” Forest Bai, co-founder of Foresight Ventures, stated.
Notably, several issues were also raised regarding the airdrop. Jean Rausis called the airdrop a “mess.” He cited many issues, including delays, frequent changes to eligibility rules, and the disqualification of half the participants. Meanwhile, suspected bots were not removed.
“The airdrop disproportionately favored insiders while excluding genuine supporters, reflecting a lack of fairness,” Phil Fogel reiterated.
The criticism expanded further as Fogel pointed out the team’s alleged associations with questionable entities and ties to questionable initial coin offerings (ICOs), raising doubts about the project’s credibility. Eric He also suggested that MANTRA was allegedly tied to gambling platforms in the past.
Strategies to Protect Yourself
Forest Bai underscored the importance of verifying the project team’s credentials, reviewing the project roadmap, and monitoring on-chain activity to ensure transparency. He also advised investors to assess community engagement and regulatory compliance to gauge the project’s long-term viability.
Ming Wu also stressed distinguishing between real growth and artificially inflated metrics.
“It’s important to differentiate real growth from activity that’s artificially inflated through incentives or airdrops, unsustainable tactics like ‘selling a dollar for 90 cents’ may generate short-term metrics but don’t reflect actual engagement,” Wu informed BeInCrypto.
Finally, Wu recommended researching the background of the project’s team members to uncover any history of fraudulent activity or involvement in questionable ventures. This would ensure that investors are well-informed before committing to any project.
4. Whale Movements
As BeInCrypto reported earlier, before the crash, a whale wallet reportedly associated with the MANTRA team deposited 3.9 million OM tokens into the OKX exchange. Experts highlighted that this wasn’t an isolated incident.
“Large OM transfers (43.6 million tokens, ~$227 million) to exchanges days prior were a major warning of potential sell-offs,” Forest Bai conveyed to BeInCrypto.
Ming Wu also explained that investors should pay close attention to such large transfers, which often act as warning signals. Moreover, analysts at CryptoQuant also outlined what investors should look out for.
“OM transfers into exchanges amounted to as much as $35 million in just an hour. This represented an alert sign as: Transfers into exchanges are below $8 million in a typical hour (excluding transfers into Binance, which are typically large given the size of the exchange). Transfers into exchanges represented more than a third of the total OM transferred, which indicates a high transfer volume into exchanges,” CryptoQuant informed BeInCrypto.
Strategies to Protect Yourself
CryptoQuant stated that investors need to monitor the flows of any token into exchanges, as it could indicate increasing price volatility in the near future.
Meanwhile, Risk Control Adviser Eric He outlined four strategies to stay up-to-date when it comes to large transfers.
- Chain Sleuthing: Tools like Arkham and Nansen allow investors to track large transfers and monitor wallet activity.
- Set Alerts: Platforms like Etherscan and Glassnode notify investors of unusual market movements.
- Track Exchange Flows: Users need to track large flows into centralized exchanges.
- Check Lockups: Dune Analytics helps investors determine if team tokens are being released earlier than expected.
He also recommended focusing on the market structure.
“OM’s crash proved market depth is non-negotiable: Kaiko data showed 1% order book depth collapsed 74% before the fall. Always check liquidity metrics on platforms like Kaiko; if 1% depth is below $500,000, that’s a red flag,” Eric revealed to BeInCrypto.
Additionally, Phil Fogel underlined the importance of monitoring platforms like X (formerly Twitter) for any rumors or discussions about possible dumps. He stressed the need to analyze liquidity to assess whether a token can handle sell pressure without causing a significant price drop.
5. Centralized Exchange Involvement
After the crash, MANTRA CEO JP Mullin was quick to blame centralized exchanges (CEXs). He said the crash was triggered by “reckless forced closures” during low-liquidity hours, alleging negligence or intentional positioning. Yet Binance pointed to cross-exchange liquidations.
Interestingly, experts were slightly divided on how CEXs contributed to OM’s crash. Forest Bai claimed that CEX liquidations during low-liquidity hours worsened the crash by triggering cascading sell-offs. Eric He corroborated this sentiment.
“CEX liquidations played a major role in the OM crash, acting as an accelerant. With thin liquidity—1% depth falling from $600,000 to $147,000—forced closures triggered cascading liquidations. Over $74.7 million was wiped in 24 hours,” he mentioned.
Yet, Ming Wu called Mullin’s explanation “just an excuse.”
“Analyzing the open interest in the OM derivatives market reveals that it was less than 0.1% of OM’s market capitalization. However, what’s particularly interesting is that during the market collapse, open interest in OM derivatives actually increased by 90%,” Wu expressed to BeInCrypto.
According to the executive, this challenges the idea that liquidations or forced closures caused the price drop. Instead, it indicates that traders and investors increased their short positions as the price fell.
Strategies to Protect Yourself
While the involvement of CEXs remains debatable, the experts did address the key point of investor protection.
“Investors can limit leverage to avoid forced liquidations, choose platforms with transparent risk policies, monitor open interest for liquidation risks, and hold tokens in self-custody wallets to reduce CEX exposure,” Forest Bai recommended.
Eric He also advised that investors should mitigate risks by adjusting leverage dynamically based on volatility. If tools like ATR or Bollinger Bands signal turbulence, exposure should be reduced.
He also recommended avoiding trading during low-liquidity periods, such as midnight UTC, when slippage risks are highest.
The MANTRA (OM) collapse is a powerful reminder of the importance of due diligence and risk management in cryptocurrency investments. Investors can minimize the risk of falling into similar traps by carefully assessing tokenomics, monitoring on-chain data, and diversifying investments.
With expert insights, these strategies will help guide investors toward smarter, more secure decisions in the crypto market.
Disclaimer
In adherence to the Trust Project guidelines, BeInCrypto is committed to unbiased, transparent reporting. This news article aims to provide accurate, timely information. However, readers are advised to verify facts independently and consult with a professional before making any decisions based on this content. Please note that our Terms and Conditions, Privacy Policy, and Disclaimers have been updated.

What’s Up With BTC, XRP, ETH?

Uniswap Founder Urges Ethereum To Pursue Layer 2 Scaling To Compete With Solana

Expert Reveals Why Consensus 2025 Will Be Pivotal For Pi Network

Analyst Says Bitcoin Price Might Be Gearing Up For Next Big Move — What To Know

Ripple Expands In Asia With Debut XRP Investment Tool

Cardano Bulls Secure Most Important Signal To Drive Price Rally

2.52 Million Altcoins Are Ruining Crypto’s Future

Animoca Brands Valuation Tanks 75% In Two Years, Here’s Why

Crypto exchange BingX hacked for $43 million

Are The Big Players Losing Interest?

Hong Kong’s Securities Association Tips Authorities On Crypto Self-Regulation

Coinbase cbBTC Set to go Live on Solana
2.52 Million Altcoins Are Ruining Crypto’s Future
Animoca Brands Valuation Tanks 75% In Two Years, Here’s Why
Crypto exchange BingX hacked for $43 million
Are The Big Players Losing Interest?
Hong Kong’s Securities Association Tips Authorities On Crypto Self-Regulation
Coinbase cbBTC Set to go Live on Solana
-
 Market19 hours ago
Cardano (ADA) Moves Sideways, But Bullish Shift May Be Brewing
-

 Market22 hours ago
XRP Consolidation About To Reach A Bottom, Wave 5 Says $5.85 Is Coming
-
 Altcoin14 hours ago
Analyst Reveals Dogecoin Price Can Reach New ATH In 55 Days If This Happens
-
Altcoin17 hours ago
Pi Coin Price Soars As Pi Network Reveals Massive Community Reward Plans.
-
 Altcoin24 hours ago
Chainlink Price To Hit $26 If LINK Breaks Past This Crucial Level
-

 Market21 hours ago
Canary Capital Aims to Launch TRON-Focused ETF
-
 Altcoin9 hours ago
Cardano Bulls Secure Most Important Signal To Drive Price Rally
-

 Market14 hours ago
Binance Mandates KYC Re-Verification For India Users