
Market
Europe Crypto News: Zondacrypto Launches Educational Center


BeInCrypto’s comprehensive Europe Crypto Roundup covers the latest news and trends shaping the continent’s crypto landscape. With reporters across key markets like Germany, France, and the UK, we provide in-depth insights into evolving regulatory environment, adoption rates, major industry events, and market movements.
This week’s roundup covers the launch of Zondacrypto’s education center in Poland, Telefónica’s integration with Polygon’s identity solution Privado ID, and other stories.
Zondacrypto Launches Poland’s First Cryptocurrency Education Center
Zondacrypto, a cryptocurrency exchange, is launching Poland’s first physical Education Center in Katowice, located at 21 Staromiejska Street. The center will offer free education on cryptocurrencies and safe investments to the public. The goal is to make cryptocurrencies and investments more accessible, even to those unfamiliar with the field.
This initiative marks a big step for the Katowice-based platform, which aims to promote crypto education in Europe. The center will operate from Monday to Friday, providing expert guidance to both beginners and experienced investors. Posts from the company’s X account hinted at the event but kept details under wraps until recently.
Agata Fit, Head of Community Relations & Skills, explained that the center was created to meet the growing demand for education on cryptocurrencies.
“We want to realize our mission and brand vision, which is to popularize cryptocurrencies in an accessible way. Also bring them closer to those who have never dealt with them before or know little about digital currency, but would like to learn more,” she said.
Read more: 4 Best Crypto Learn and Earn Platforms in 2024
Fit also highlighted the center’s role in fostering a closer relationship with Zondacrypto users and people interested in safe investments. Katowice is just the start, with plans for more locations in the future.
Greece Plans New $330 Million Data Center to Boost AI Expansion
Paris-based Data4 is planning to invest around $330 million to build a major AI data center hub in Greece. This project aims to improve the country’s digital infrastructure and economy.
On September 12, Data4 announced that the new data center would be located in Paiania, near Athens. According to Bloomberg, the company’s CEO, Olivier Micheli, mentioned that they are negotiating with existing lenders and local Greek banks. He added that the site would greatly benefit the local economy and digital ecosystem.
Data4 operates several data centers across six European countries, and aims to invest €7 billion in expanding its operations. In addition, the company plans to build two more data centers at the Greek site for an extra €200 million.
Telefónica Tech Joins Polygon’s Privado ID as System Integrator
Spanish telecom giant Telefónica has become a system integrator for Polygon’s identity solution, Privado ID. On September 10, Telefónica Tech announced it will integrate Privado ID’s tools into its managed blockchain service, TrustOS. This collaboration aims to develop proof-of-concept projects for various digital identity applications, including age verification and e-signature solutions.
“This will allow users to automatically issue accreditations — such as training diplomas, academic qualifications, or attendance at seminars — as verifiable credentials, which can then be loaded into digital wallets,” said the companies.
Read more: Decentralized Identity and the Future of Web3: What To Know
The move comes as the EU prepares to introduce the European Digital Identity Regulation, a framework designed to provide citizens, residents, and businesses with a universally recognized digital identity for accessing public services and conducting transactions.
Privado ID relies on zero-knowledge (ZK) cryptography, a technology that allows users to verify information without disclosing additional personal data. This approach will strengthen privacy within the European digital ID wallet system.
“The regulation aims to create a more secure and standardized framework for electronic identification and trust services across Europe, making it essential for businesses and individuals to adopt compliant and innovative identity solutions,” the companies stated.
Polygon recently spun off its digital ID service and tested it through proofs-of-concept with several financial institutions, including Deutsche Bank.
Ireland Investigates Google’s AI Model for Data Protection Compliance
The Irish Data Protection Commission (DPC) has launched a cross-border investigation into Google Ireland Limited to assess whether the company complied with EU data protection laws during the development of its artificial intelligence model, Pathways Language Model 2 (PaLM2).
Announced on September 12, the DPC will examine whether Google used EU citizens’ personal data while training PaLM2, which was introduced on May 10, 2023. PaLM2 is an advanced language model known for its multilingual, reasoning, and coding capabilities.
The DPC emphasized the importance of a Data Protection Impact Assessment to ensure individuals’ rights are considered and protected, especially when processing personal data that poses a high risk. The inquiry is part of a broader initiative by the DPC and other EU/EEA regulators to oversee AI development and data usage.
“This statutory inquiry forms part of the wider efforts of the DPC, working in conjunction with its EU/EEA (European Economic Area) peer regulators, in regulating the processing of the personal data of EU/EEA data subjects in the development of AI models and systems,” DPC stated.
Read more: How To Invest in Artificial Intelligence (AI) Cryptocurrencies?
Google’s PaLM2 is available in four sizes — Gecko, Otter, Bison, and Unicorn — designed for various use cases, with Gecko optimized for mobile devices, even offline. Google has plans to release updated versions as the model integrates into more products.
This investigation follows the DPC’s recent conclusion of a probe into the social media platform X, which complied with EU data protection regulations.
Disclaimer
In adherence to the Trust Project guidelines, BeInCrypto is committed to unbiased, transparent reporting. This news article aims to provide accurate, timely information. However, readers are advised to verify facts independently and consult with a professional before making any decisions based on this content. Please note that our Terms and Conditions, Privacy Policy, and Disclaimers have been updated.


Aayush Jindal, a luminary in the world of financial markets, whose expertise spans over 15 illustrious years in the realms of Forex and cryptocurrency trading. Renowned for his unparalleled proficiency in providing technical analysis, Aayush is a trusted advisor and senior market expert to investors worldwide, guiding them through the intricate landscapes of modern finance with his keen insights and astute chart analysis.
From a young age, Aayush exhibited a natural aptitude for deciphering complex systems and unraveling patterns. Fueled by an insatiable curiosity for understanding market dynamics, he embarked on a journey that would lead him to become one of the foremost authorities in the fields of Forex and crypto trading. With a meticulous eye for detail and an unwavering commitment to excellence, Aayush honed his craft over the years, mastering the art of technical analysis and chart interpretation.
As a software engineer, Aayush harnesses the power of technology to optimize trading strategies and develop innovative solutions for navigating the volatile waters of financial markets. His background in software engineering has equipped him with a unique skill set, enabling him to leverage cutting-edge tools and algorithms to gain a competitive edge in an ever-evolving landscape.
In addition to his roles in finance and technology, Aayush serves as the director of a prestigious IT company, where he spearheads initiatives aimed at driving digital innovation and transformation. Under his visionary leadership, the company has flourished, cementing its position as a leader in the tech industry and paving the way for groundbreaking advancements in software development and IT solutions.
Despite his demanding professional commitments, Aayush is a firm believer in the importance of work-life balance. An avid traveler and adventurer, he finds solace in exploring new destinations, immersing himself in different cultures, and forging lasting memories along the way. Whether he’s trekking through the Himalayas, diving in the azure waters of the Maldives, or experiencing the vibrant energy of bustling metropolises, Aayush embraces every opportunity to broaden his horizons and create unforgettable experiences.
Aayush’s journey to success is marked by a relentless pursuit of excellence and a steadfast commitment to continuous learning and growth. His academic achievements are a testament to his dedication and passion for excellence, having completed his software engineering with honors and excelling in every department.
At his core, Aayush is driven by a profound passion for analyzing markets and uncovering profitable opportunities amidst volatility. Whether he’s poring over price charts, identifying key support and resistance levels, or providing insightful analysis to his clients and followers, Aayush’s unwavering dedication to his craft sets him apart as a true industry leader and a beacon of inspiration to aspiring traders around the globe.
In a world where uncertainty reigns supreme, Aayush Jindal stands as a guiding light, illuminating the path to financial success with his unparalleled expertise, unwavering integrity, and boundless enthusiasm for the markets.

The Solana-based meme coin FARTCOIN has once again claimed its spot as the market’s top gainer, surging to a two-month high of $0.73.
It has seen an impressive 39% price increase over the past 24 hours, reflecting a notable uptick amid an otherwise declining market.
FARTCOIN Defies the Odds, Soars to Two-Month High
FARTCOIN plunged to a year-to-date low of $0.19 on March 10. This presented a buying opportunity for the meme coin holders, who have since increased their buy orders for the token. Trading at a two-month high of $0.72 as of this writing, FARTCOIN’s value has since soared by 279% in the past month.
On the daily chart, FARTCOIN’s triple-digit rally has pushed its price above the Leading Span A (green line) of its Ichimoku Cloud. The strengthening bullish momentum is now driving the altcoin toward the Leading Span B (red line) of this indicator, a breakout of which would further validate FARTCOIN’s current bull run.
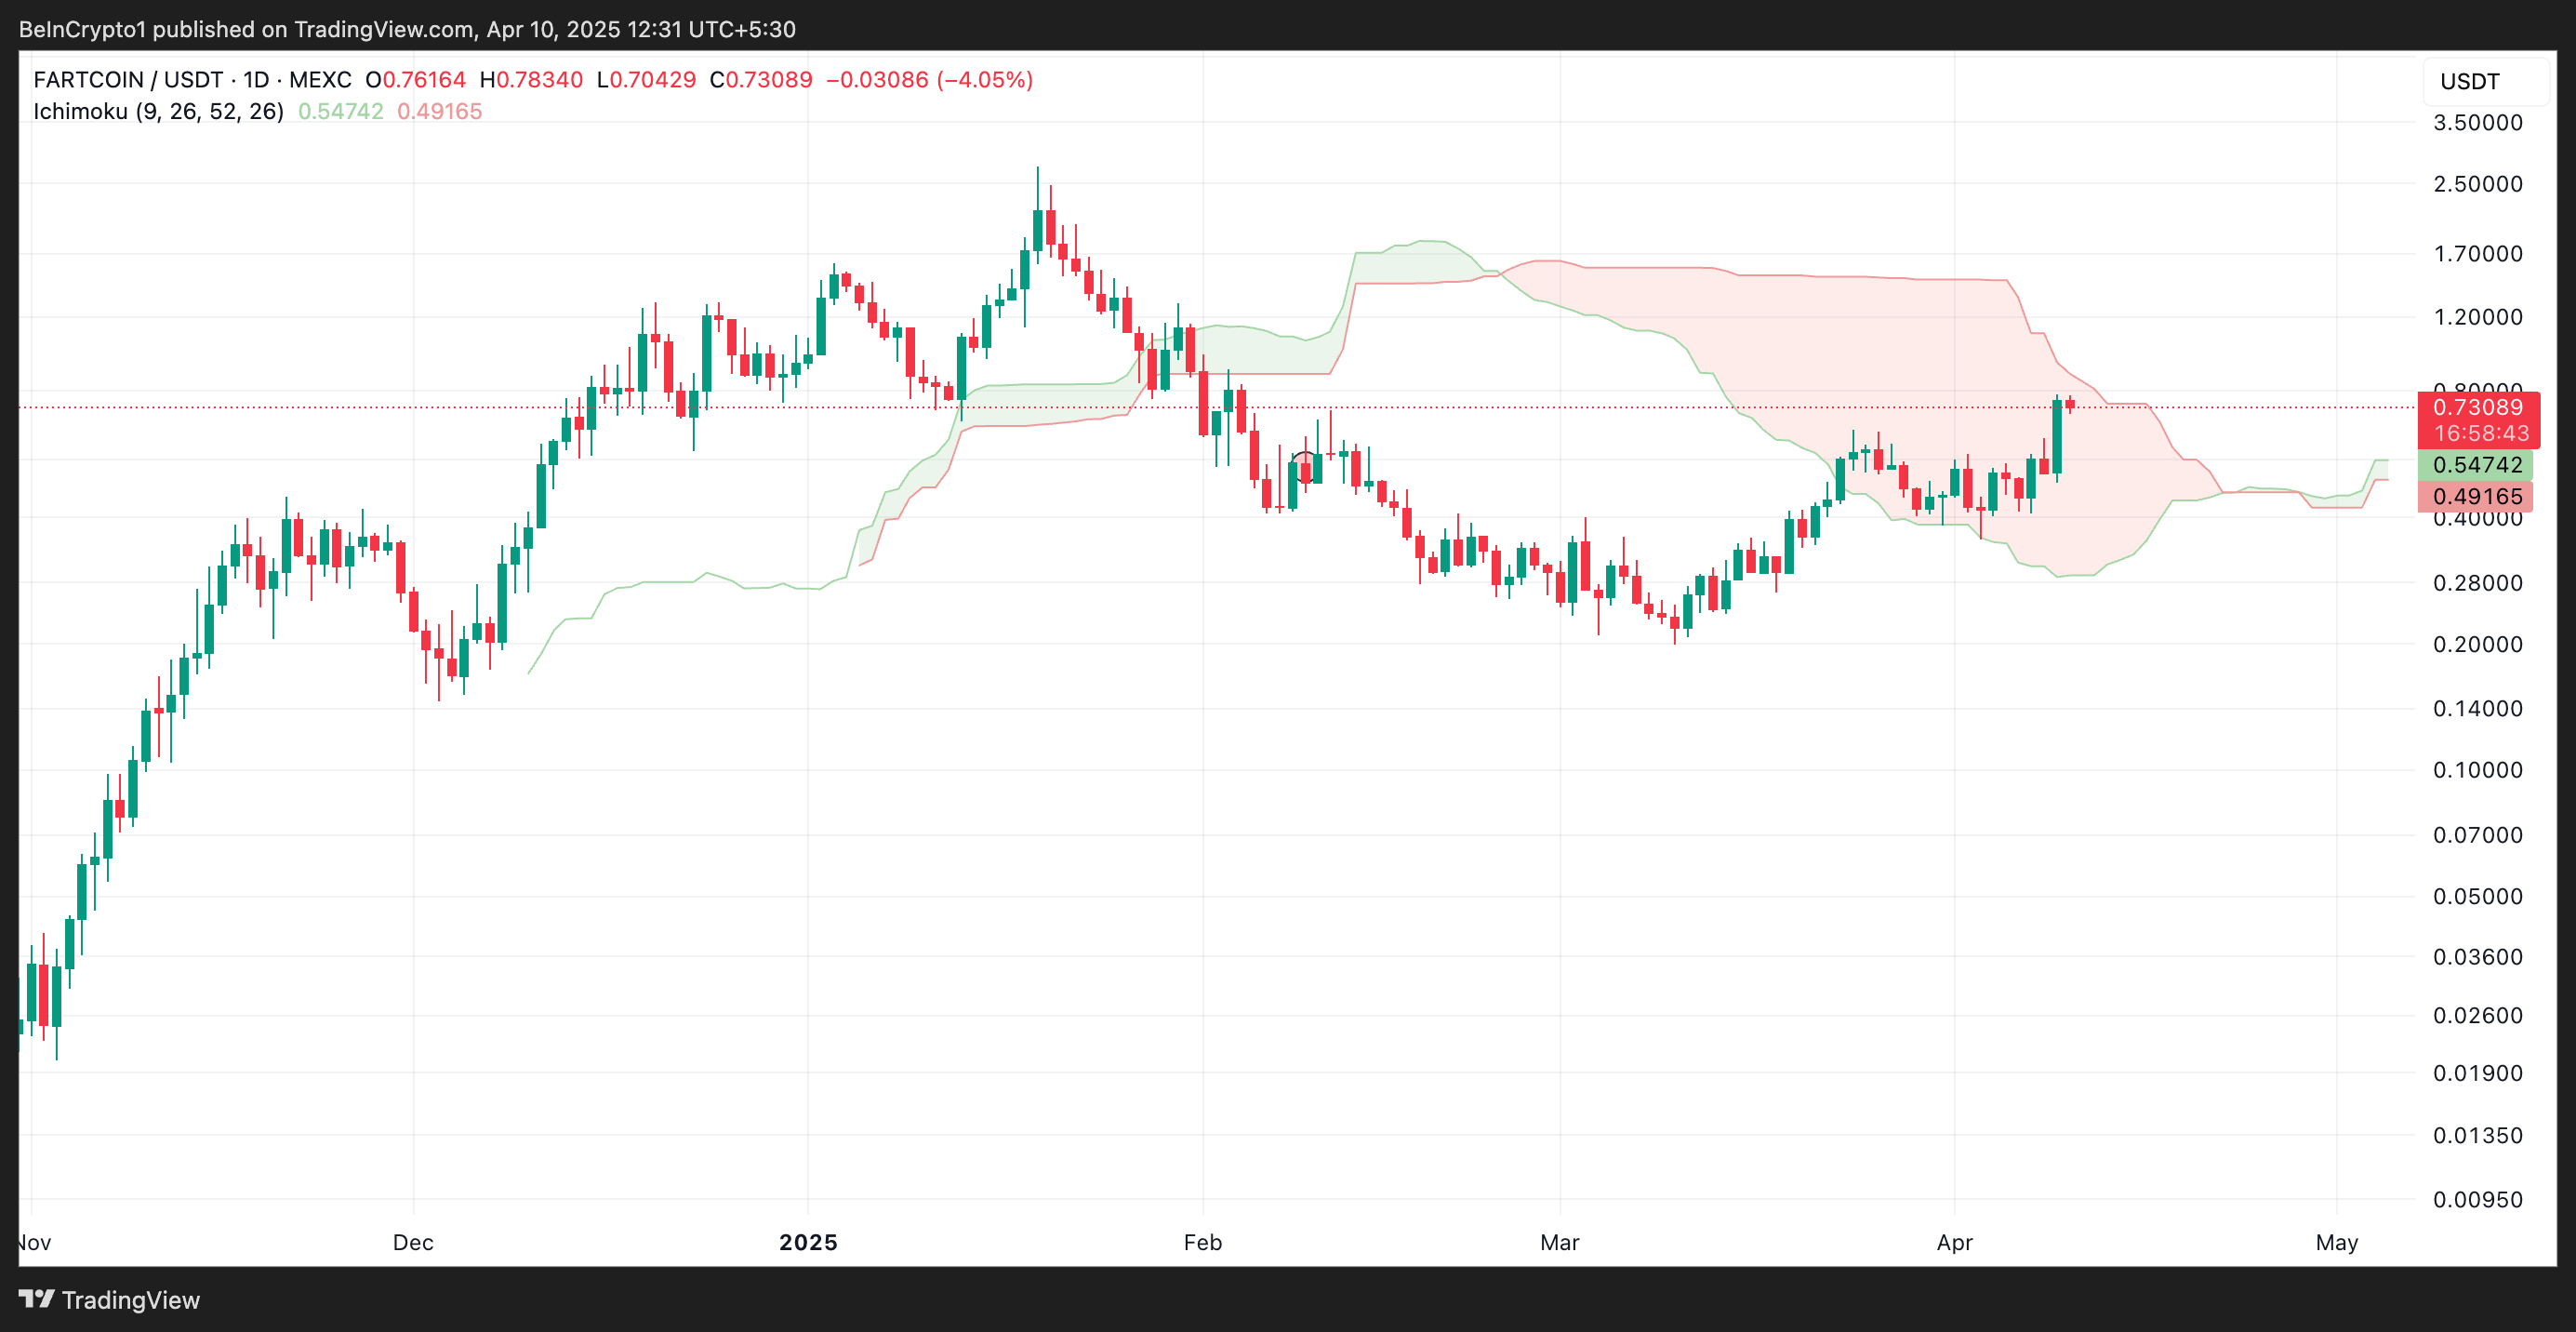
The Ichimoku Cloud tracks the momentum of an asset’s market trends and identifies potential support/resistance levels.
When an asset’s price breaks above Leading Span A and is poised to break above Leading Span B, it signals a strengthening bullish trend. This hints at the potential for further upward movement as FARTCOIN moves into a more favorable market position.
Further, the altcoin’s Chaikin Money Flow (CMF) remains above the zero line, confirming the preference for FARTCOIN accumulation over selloffs. At press time, this momentum indicator, which measures how money flows into and out of an asset, is at 0.13.
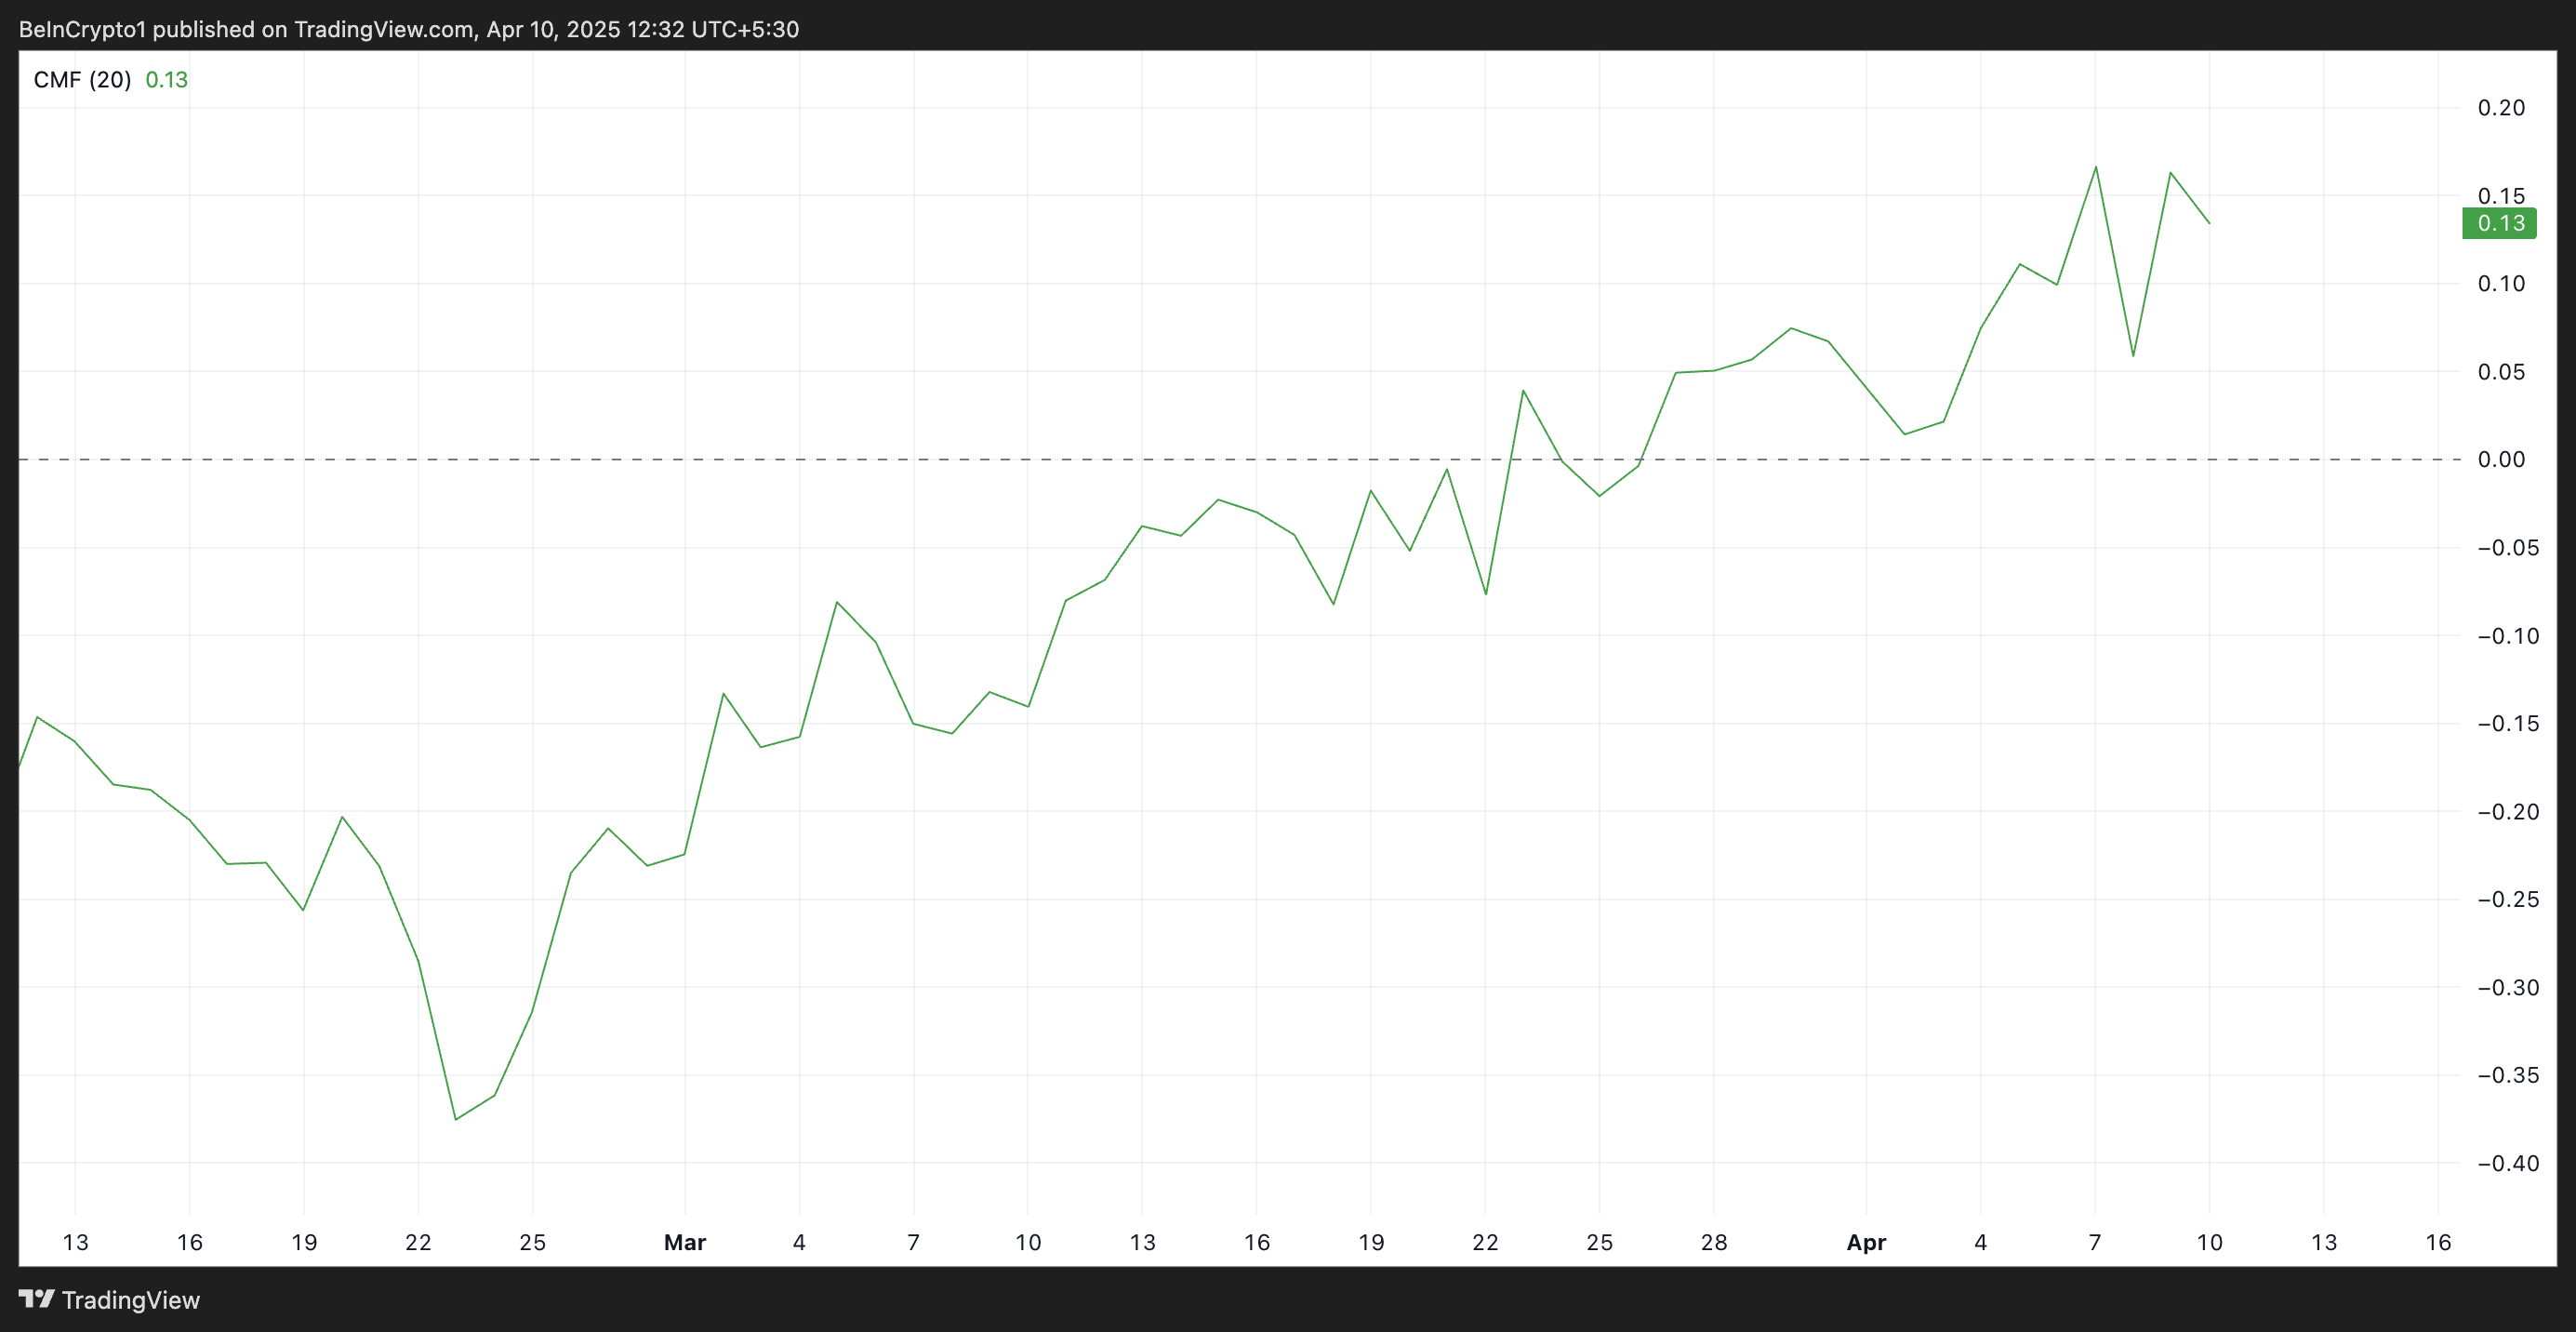
A positive CMF reading during a rally like this indicates strong buying pressure and market participation, as the volume of buy orders outweighs sell orders. This suggests that FARTCOIN’s rally is supported by solid demand, reinforcing the sustainability of the upward movement.
FARTCOIN is on Track for $1
Since its rally began on March 10, FARTCOIN has traded within an ascending parallel channel. This bullish pattern confirms the growing demand for the meme coin.
If buying pressure strengthens, FARTCOIN could extend its gains. In that case, its price could break above the Leading Span B, which currently forms a dynamic resistance above its price. A successful break above this level could propel the token toward $1.
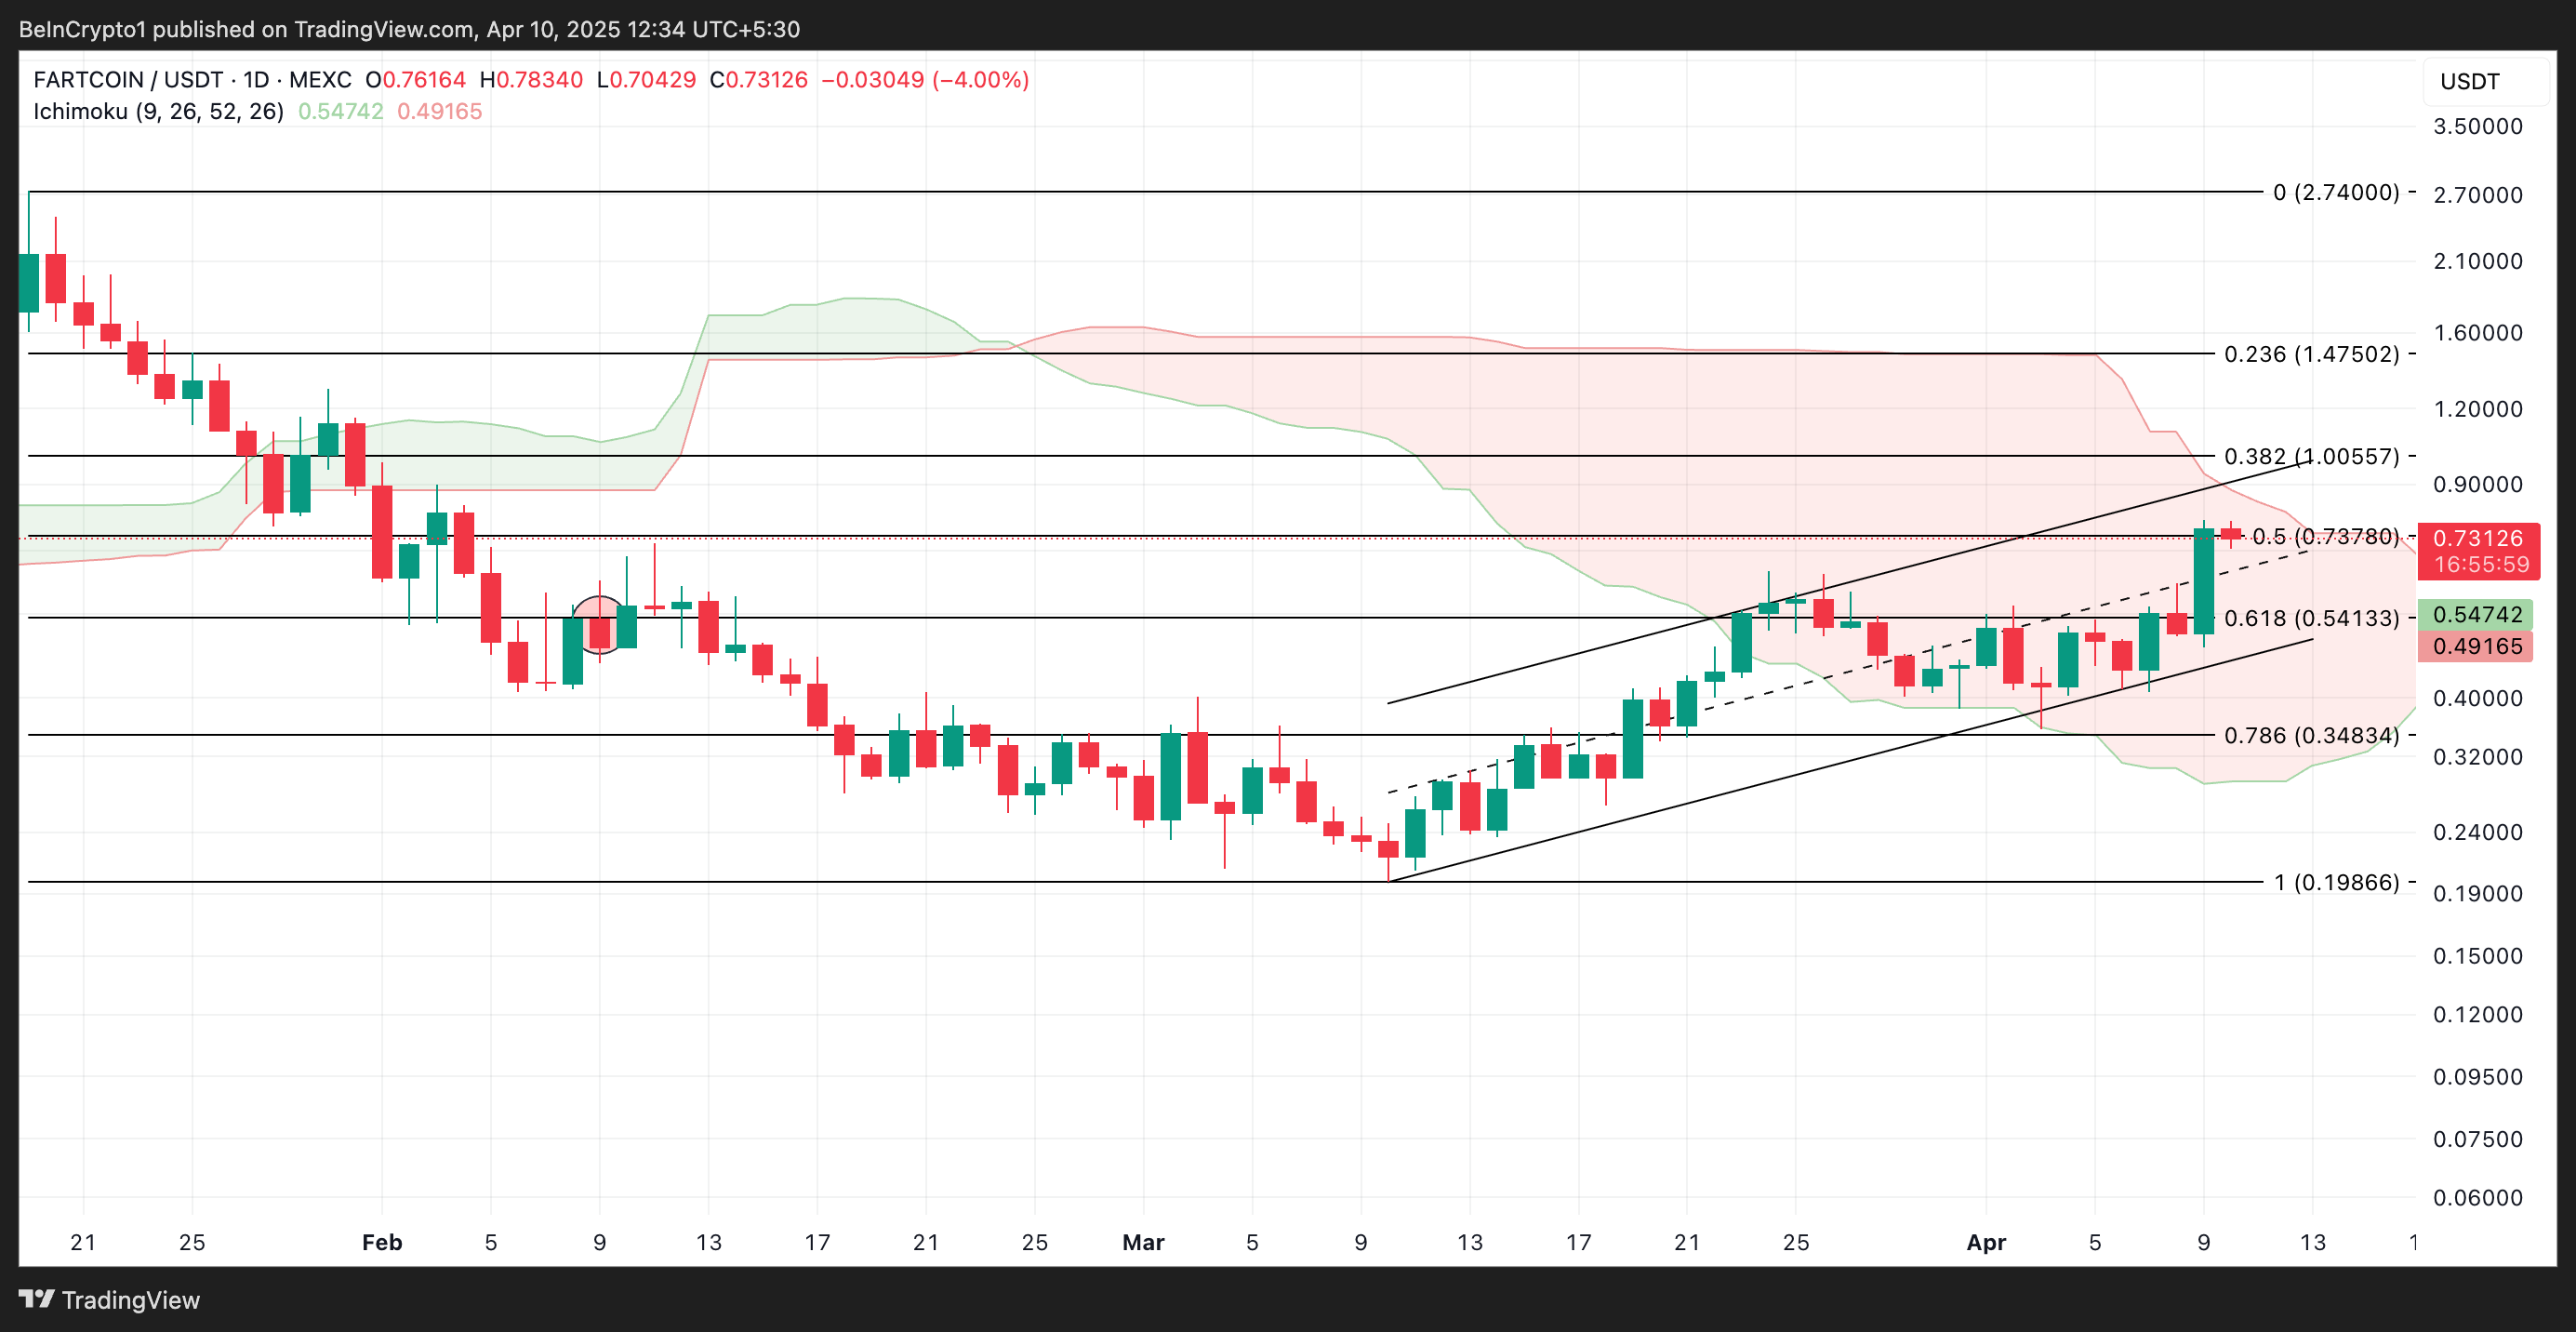
However, if profit-taking resumes, this bullish projection will be invalidated. In that scenario, meme coin FARTCOIN’s price could dip to $0.54.
Disclaimer
In line with the Trust Project guidelines, this price analysis article is for informational purposes only and should not be considered financial or investment advice. BeInCrypto is committed to accurate, unbiased reporting, but market conditions are subject to change without notice. Always conduct your own research and consult with a professional before making any financial decisions. Please note that our Terms and Conditions, Privacy Policy, and Disclaimers have been updated.

Despite breaking above $3 earlier this year, the XRP price has since gone on to disappoint investors with multiple crashes that have rocked the altcoin. This has seen the cryptocurrency lose almost 50% of its acquired value between late 2024 and early 2025. Nevertheless, this has failed to erode bullish sentiment, with predictions for higher prices dominating the community.
Time To Go Long On The XRP Price?
A crypto analyst on X (formerly Twitter) has renewed bullish hope after identifying an important formation on the XRP price chart. The analysis pointed out that the XRP Price is still moving within a descending channel, a formation that usually signals a bearish move.
However, the downtrend has pushed the altcoin’s price to the point where it is now testing the bottom trend line. This bottom trend line has been known to act as strong support previously and is expected to do so this time around.
With the support forming, it is likely that the XRP Price is gearing up for a bounce from this level. Furthermore, the crypto analyst points out that XRP is also forming a rounded bottom inside this descending channel. Such a rounded bottom could signal an end to the downtrend from here.
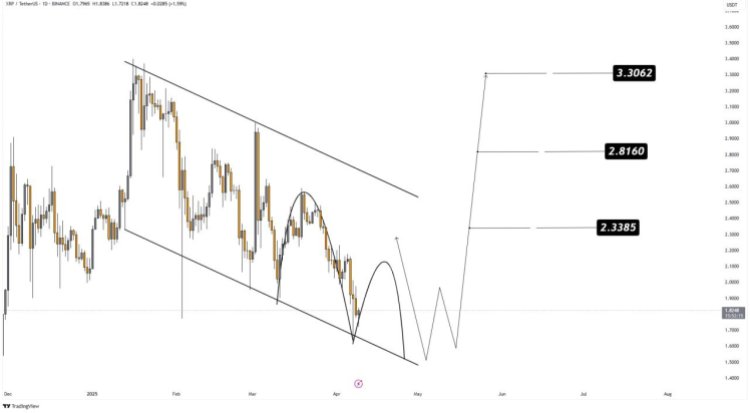
As the formation grows, the main level of support is now sitting at $1.6. So far, this level has held up quite nicely and bulls have been using it as a bounce-off point for recovery. Given this, the crypto analyst advises that entries for the XRP price are best at around $1.70 to $1.85.
This is not the only good news for the XRP price with support forming. If it holds and the altcoin does indeed bounce from this level toward $2, then the next important levels lie between $2 and $2.2. These serve as the levels for the bulls to beat to confirm a bullish continuation toward a possible all-time high.
If the bulls are successful, then three profit targets are placed by the crypto analyst. These include $2.3385, $2.8160, and $3.3062, pushing it toward January 2025 highs.
The Bearish Case
While the analysis is inherently bullish, there is still the possibility of invalidation that could send the XRP price tumbling further. As the analyst points out, the major support currently lies at $1.6. This means that bulls must hold this level. Otherwise, there is the risk of a much deeper correction as a liquidity sweep could send support further down to $1.3.
Nevertheless, with buy sentiments building once again, it is likely that XRP will follow the bullish scenario in this case.
Chart from TradingView.com

Solana (SOL) Jumps But Smacks Into $120 Resistance Wall—Can It Break Through?
Bullish Signal for Bitcoin in 2025?
Analyst Reveals How XRP Price Can Hit $22 If BTC Rallies To This Level

Meme Coin FARTCOIN Hits Two-Month High, Could It Reach $1?

Will Q2 2025 Mark the Return of Altcoin Season?

XRP Price Forms Rounded Bottom Within Descending Channel, Target Set Above $3

2.52 Million Altcoins Are Ruining Crypto’s Future

Animoca Brands Valuation Tanks 75% In Two Years, Here’s Why

Crypto exchange BingX hacked for $43 million

Are The Big Players Losing Interest?

Hong Kong’s Securities Association Tips Authorities On Crypto Self-Regulation

Coinbase cbBTC Set to go Live on Solana
2.52 Million Altcoins Are Ruining Crypto’s Future
Animoca Brands Valuation Tanks 75% In Two Years, Here’s Why
Crypto exchange BingX hacked for $43 million
Are The Big Players Losing Interest?
Hong Kong’s Securities Association Tips Authorities On Crypto Self-Regulation
Coinbase cbBTC Set to go Live on Solana
-
 Bitcoin13 hours ago
MicroStrategy Bitcoin Dump Rumors Circulate After SEC Filing
-

 Altcoin17 hours ago
NFT Drama Ends For Shaquille O’Neal With Hefty $11 Million Settlement
-
 Altcoin16 hours ago
Is Dogecoin Price Levels About To Bounce Back?
-

 Market13 hours ago
XRP Primed for a Comeback as Key Technical Signal Hints at Explosive Move
-
 Altcoin24 hours ago
Pepe Coin Whales Offload Over 1 Trillion PEPE
-

 Market14 hours ago
SEC Approves Ethereum ETF Options Trading After Delays
-
 Regulation13 hours ago
US Senate Confirms Pro-Crypto Paul Atkins As SEC Chair
-

 Market17 hours ago
FARTCOIN Jumps 160% in 30 Days but Momentum Fades