
Market
Ethereum Rebounds After Bybit Hack

Ethereum (ETH) has shown signs of recovery after a sharp decline caused by the Bybit hack, which impacted its price. Despite this bounce back, ETH is still down nearly 18% over the past 30 days, reflecting continued volatility.
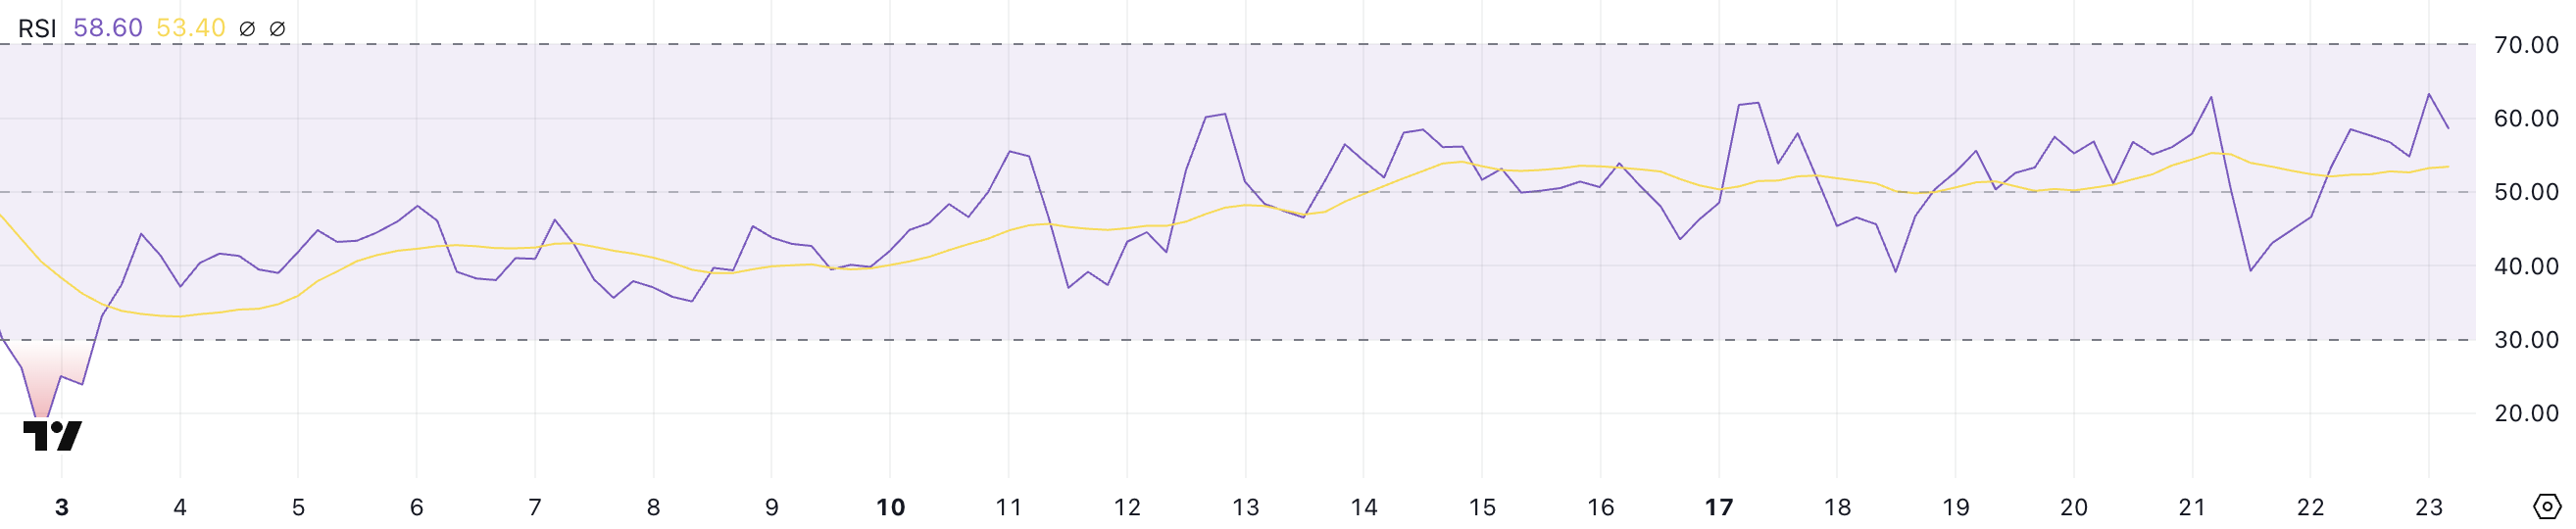
Notably, ETH’s RSI has rebounded to 58.6 from a low of 39.2 during the sell-off, indicating renewed buying pressure. This recovery in RSI suggests that market sentiment is gradually improving, potentially setting the stage for further price gains if momentum persists.
ETH RSI Has Recovered From the Recent Dip
ETH’s RSI is currently at 58.6, a notable increase from the 39.2 level it reached after the Bybit hack significantly impacted its price.
The recovery in RSI reflects the buying momentum ETH has gained since the sharp decline.
This upward movement in RSI suggests that buying pressure has returned, helping Ethereum price stabilize and potentially paving the way for further price gains if momentum continues.
RSI, or Relative Strength Index, is a momentum oscillator that measures the speed and change of price movements. It ranges from 0 to 100, with thresholds at 30 and 70.
An RSI below 30 is generally considered oversold, indicating potential buying opportunities, while an RSI above 70 is considered overbought, signaling a possible price correction.
ETH’s RSI is currently at 58.6, positioned in a neutral zone but leaning towards bullish momentum. This level suggests Ethereum still has room to grow before reaching overbought territory, potentially leading to continued price appreciation as buying interest remains steady.
Ethereum Whales Accumulated After Bybit Hack
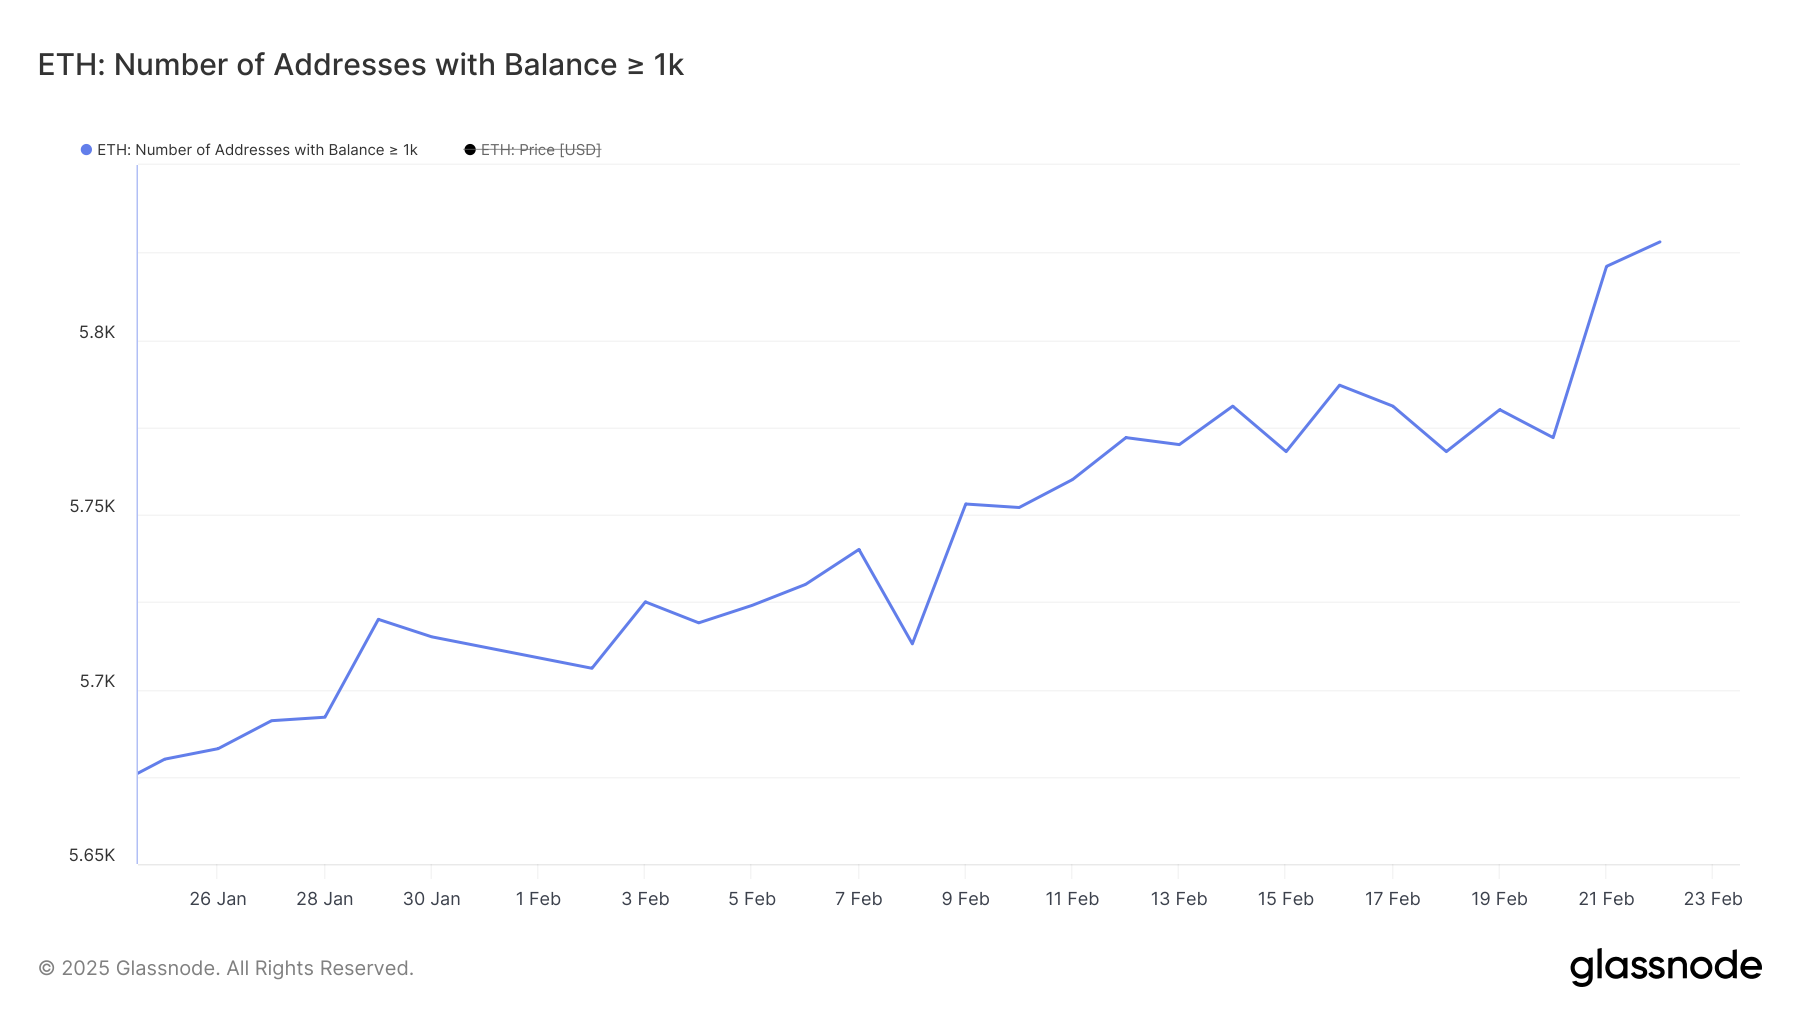
The number of Ethereum whales – addresses holding at least 1,000 ETH – has been rising steadily over the past month, increasing from 5,680 on January 25 to 5,828 on February 22.
This marks the highest level since December 2023, signaling renewed interest and accumulation among large holders. The increase in whale addresses suggests that institutional investors or high-net-worth individuals are building positions, potentially anticipating future price gains, especially between February 21 and February 22, when ETH prices decreased following the Bybit hack.
This growing accumulation could provide a solid foundation for ETH’s price to rise.
Tracking Ethereum whales is crucial because their buying and selling behavior can significantly impact the market.
When whales accumulate, it reduces the circulating supply, potentially driving prices up as demand meets reduced availability. Conversely, when they sell, it can create significant downward pressure on prices.
Currently, the rise in whale addresses indicates growing confidence and a bullish sentiment among large investors.
Although this is the highest level since December 2023, it is still relatively low compared to historical data. This suggests there is room for more accumulation. If this trend continues, it could lead to a sustained upward movement in ETH price as demand outpaces supply.
Will Ethereum Finally Rise Back Above $2,900?
Ethereum’s EMA lines suggest that a golden cross could form soon. A golden cross typically signals a bullish trend and potential upward momentum.
If this occurs, Ethereum could first test a price level near its long-term line (the blue line in the chart) around $2,876. Breaking this resistance could open the door for a move to $3,020.
If the uptrend continues with strong momentum, ETH could even reach as high as $3,442.
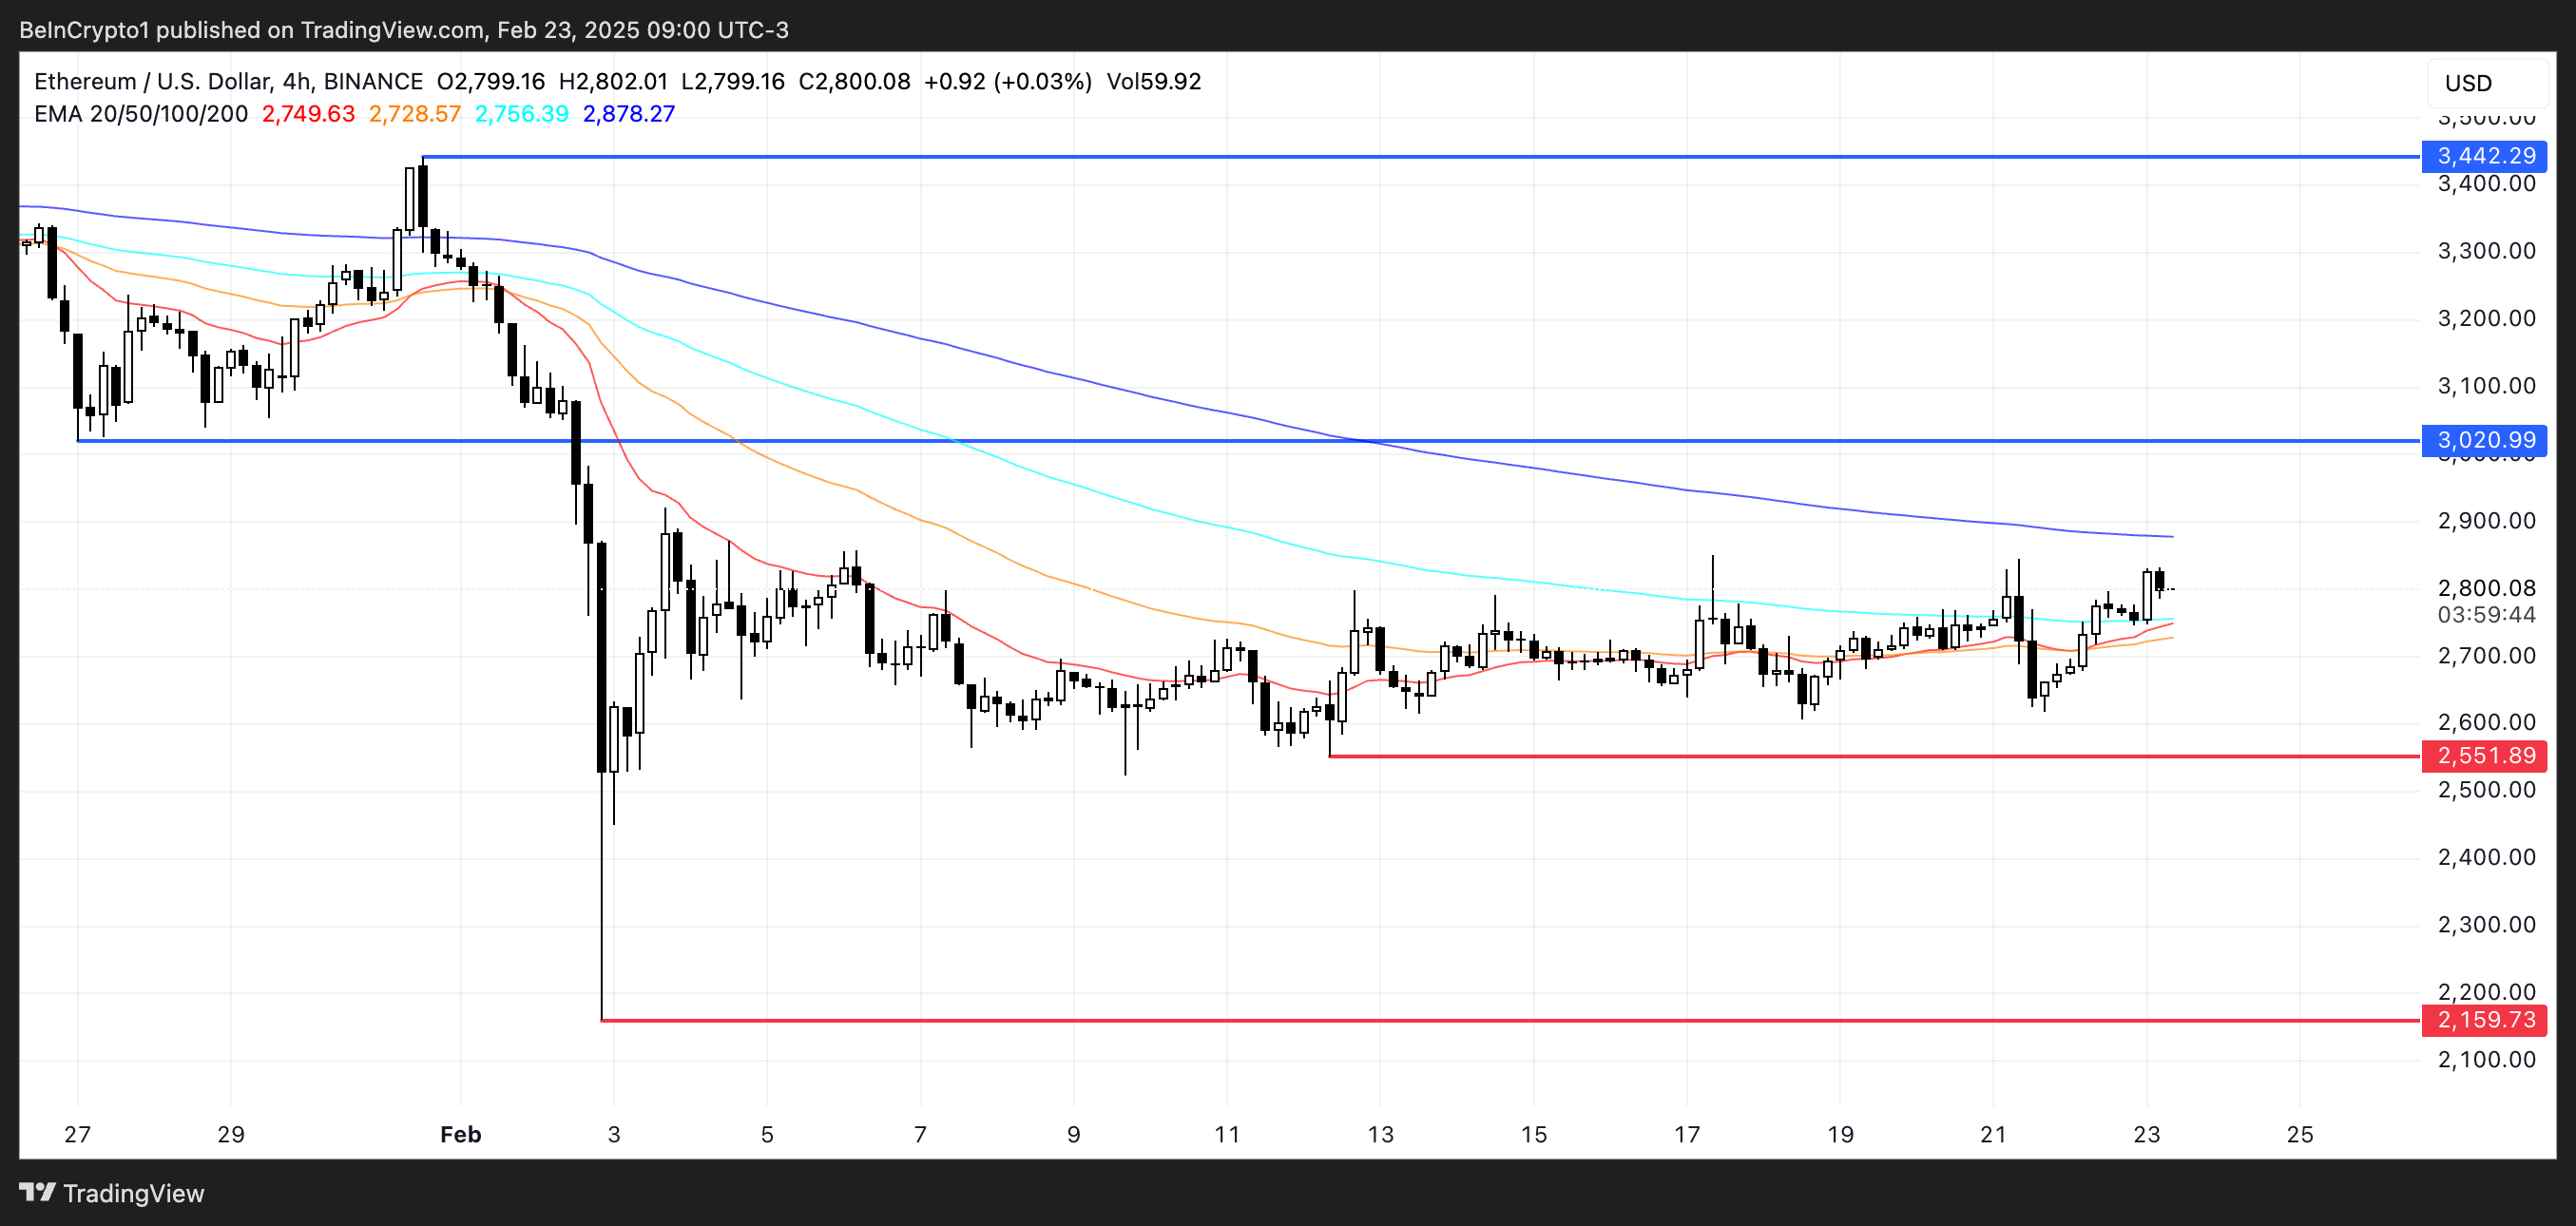
However, ETH has struggled to reclaim levels above $2,900 in recent attempts, signaling possible resistance and market hesitation.
If it fails to break through once more and a downtrend begins, ETH price could test the $2,551 support level. Losing this support could result in a sharper decline, potentially falling to $2,159.
Disclaimer
In line with the Trust Project guidelines, this price analysis article is for informational purposes only and should not be considered financial or investment advice. BeInCrypto is committed to accurate, unbiased reporting, but market conditions are subject to change without notice. Always conduct your own research and consult with a professional before making any financial decisions. Please note that our Terms and Conditions, Privacy Policy, and Disclaimers have been updated.


Reason to trust
![]()
Strict editorial policy that focuses on accuracy, relevance, and impartiality
Created by industry experts and meticulously reviewed
The highest standards in reporting and publishing
Strict editorial policy that focuses on accuracy, relevance, and impartiality
Morbi pretium leo et nisl aliquam mollis. Quisque arcu lorem, ultricies quis pellentesque nec, ullamcorper eu odio.
The XRP price is gearing up for another bullish move upward, as a crypto analyst has predicted a 20% surge in the near future. This optimistic forecast is backed by the formation of a key technical pattern called the Golden Pocket and indicators including strong support levels and a critical resistance zone.
Golden Pocket Signals XRP Price Surge
According to TradingView analyst TehThomas, the XRP price is currently trading within a well-defined Ascending Channel, setting the stage for a potential 20% move upwards. In the 4-hour time frame, XRP has continued to respect this Ascending Channel, forming higher highs and higher lows — a key indicator of a sustained uptrend.
Related Reading
Interestingly, the most notable development in XRP’s price action is the appearance of a Golden Pocket on its chart. A Golden Pocket is a key Fibonacci retracement area that is often used to identify potential support and resistance levels. It represents a complete trend reversal for a cryptocurrency and a possibility of an aggressive uptrend.
The TradingView analyst has revealed that XRP’s current Golden Pocket aligns with an imbalance zone, an area of unfilled liquidity where prices typically revisit before resuming movement.
In the chart, XRP’s Golden Pocket sits between the 0.618 – 0.65 Fibonacci retracement level — a well-known area where the price usually finds strong support before continuing the trend. Historically, XRP has reacted twice from this key level, indicating that buyers have been actively defending this area.
TehThomas has predicted that as long as the XRP price can hold above the key Fibonacci retracement level, which also acts as a critical resistance, the cryptocurrency’s bullish structure will remain unchanged. Additionally, XRP could be primed for a massive rally toward the 0.618 Fibonacci extension level, which corresponds with the upper boundary of the Ascending Channel.
If this bullish momentum continues, it means that the analyst expects the XRP price to see a rally to a target between the $2.8 to – $2.9 range. This represents a 29% price increase from XRP’s current price of $2.2.
Short-Term Resistance Could Trigger Decline
TehThomas’s bullish outlook for the XRP price, the TradingView analyst noted that the 1-hour time frame presents short-term resistance, which could lead to a significant pullback before the next leg up. XRP recently faced a rejection at the imbalance zone, indicating that sellers are increasing activity at this level.
Related Reading
Previously, when the price struggled to break the imbalance zone, it highlighted a lack of liquidity to sustain a continued uptrend. A repeat of this could result in a retracement toward the Golden Pocket in the 4-hour timeframe.
Notably, a confirmed breakout from the 1-hour imbalance timeframe could reinforce XRP’s bullish momentum, supporting its projected move toward upper levels of the Ascending Channel. However, a failure could shift this bullish structure, leading to a deeper correction toward lower support levels.
Featured image from iStock, chart from Tradingview.com

Cronos (CRO) has been gaining serious momentum in recent weeks after Trump Media announced a partnership with Crypto.com. The news helped drive CRO’s price above the $0.10 mark for the first time since early February, triggering a wave of bullish technical signals.
Indicators like RSI, BBTrend, and EMA alignment all point toward strong upward momentum, with CRO even becoming the top-performing altcoin in the past 24 hours. As traders eye key resistance and support levels, the question now is whether this rally has enough fuel to carry CRO toward $0.20.
CRO RSI Is Back To Neutral After Reaching Its Highest Levels In Years
Cronos has captured market attention in recent weeks, especially following the announcement of a partnership between Trump Media and Crypto.com.
This surge in interest drove CRO’s Relative Strength Index (RSI) to a peak of 89.64 just three days ago—its highest level in over a year—signaling intense buying pressure.
Since then, the RSI has cooled down to 61.2, as the price consolidates after its strong rally. Despite the slight RSI drop, Cronos remains the top-performing altcoin in the past 24 hours, with a 7% price increase, showing that momentum is still in its favor.
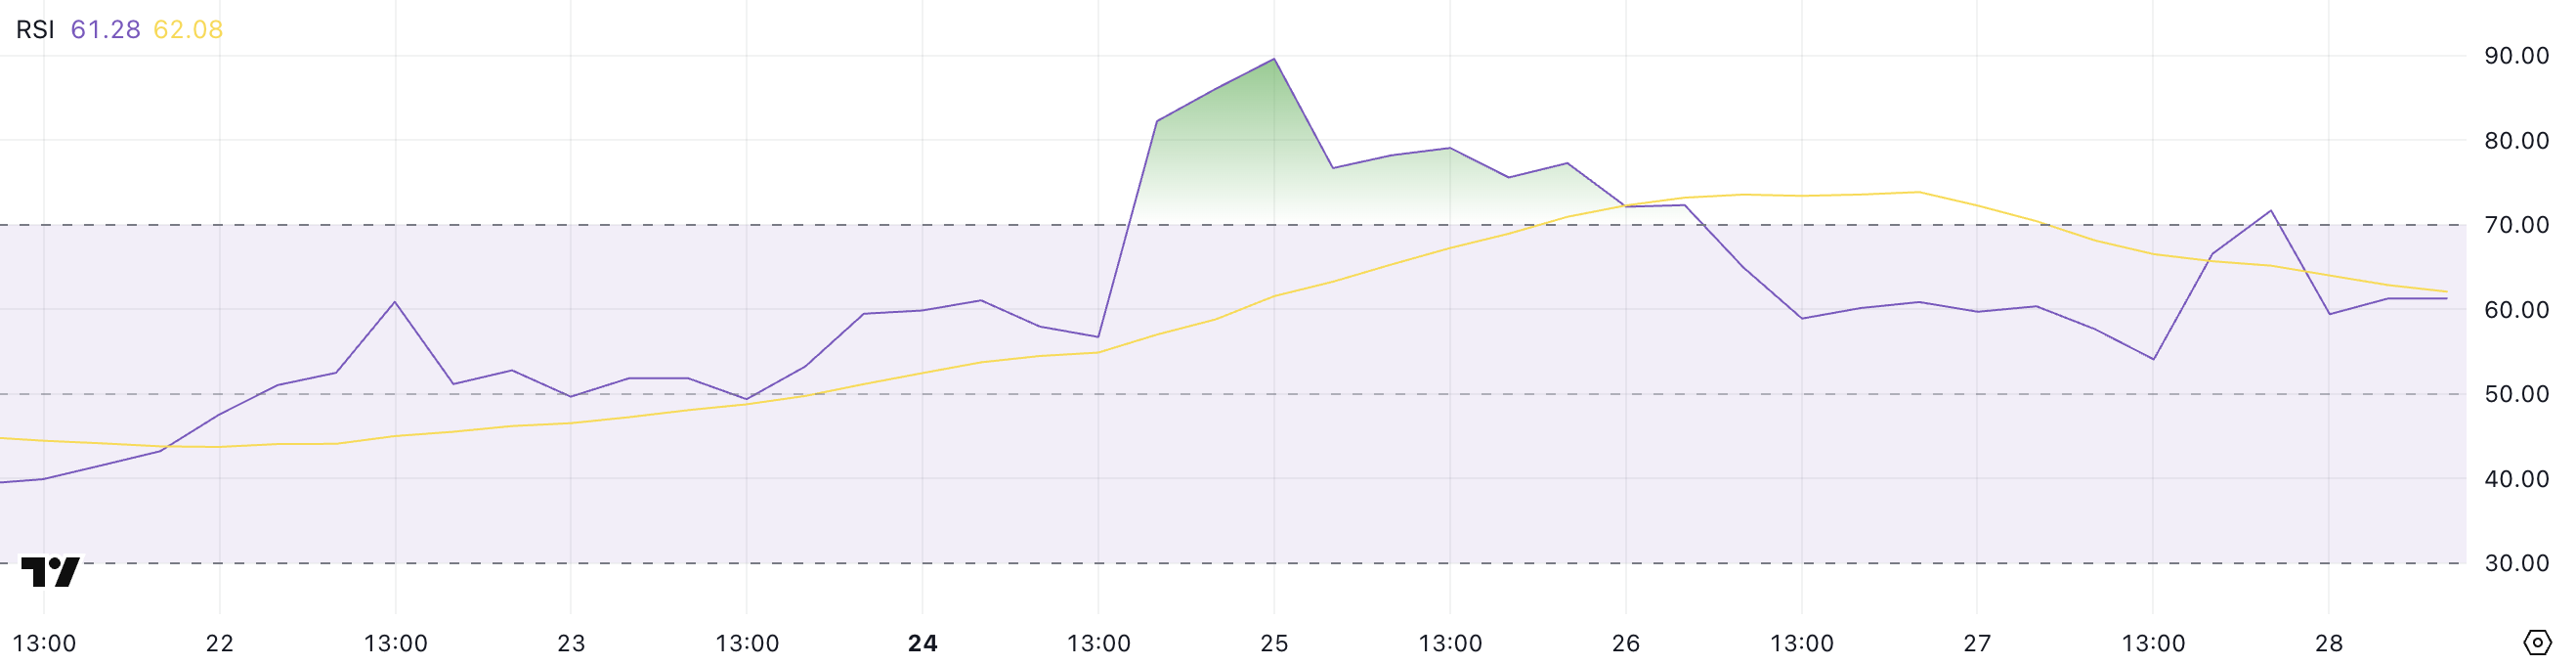
The RSI (Relative Strength Index) is a momentum indicator used to assess whether an asset is overbought or oversold. It ranges from 0 to 100, with levels above 70 typically suggesting overbought conditions, and levels below 30 indicating oversold territory.
With CRO’s RSI now at 61.2, the asset is no longer in an overbought state but still shows healthy bullish momentum. This suggests the price could continue climbing, especially if renewed interest or news catalysts emerge.
At the same time, the cooldown from extreme RSI levels may be giving the market room to build a more sustainable rally.
Cronos BBTrend Is Still Very Positive, But Down From The Recent Peak
Cronos has recently flipped its BBTrend indicator back into positive territory, currently sitting at 25.05—down slightly from a recent peak of 26.56 reached just yesterday.
This shift comes after five consecutive days of negative BBTrend values, suggesting a notable change in market momentum.
The move into positive territory indicates that bullish pressure has returned, aligning with the broader uptick in price and sentiment surrounding CRO following its recent surge in visibility and trading activity.
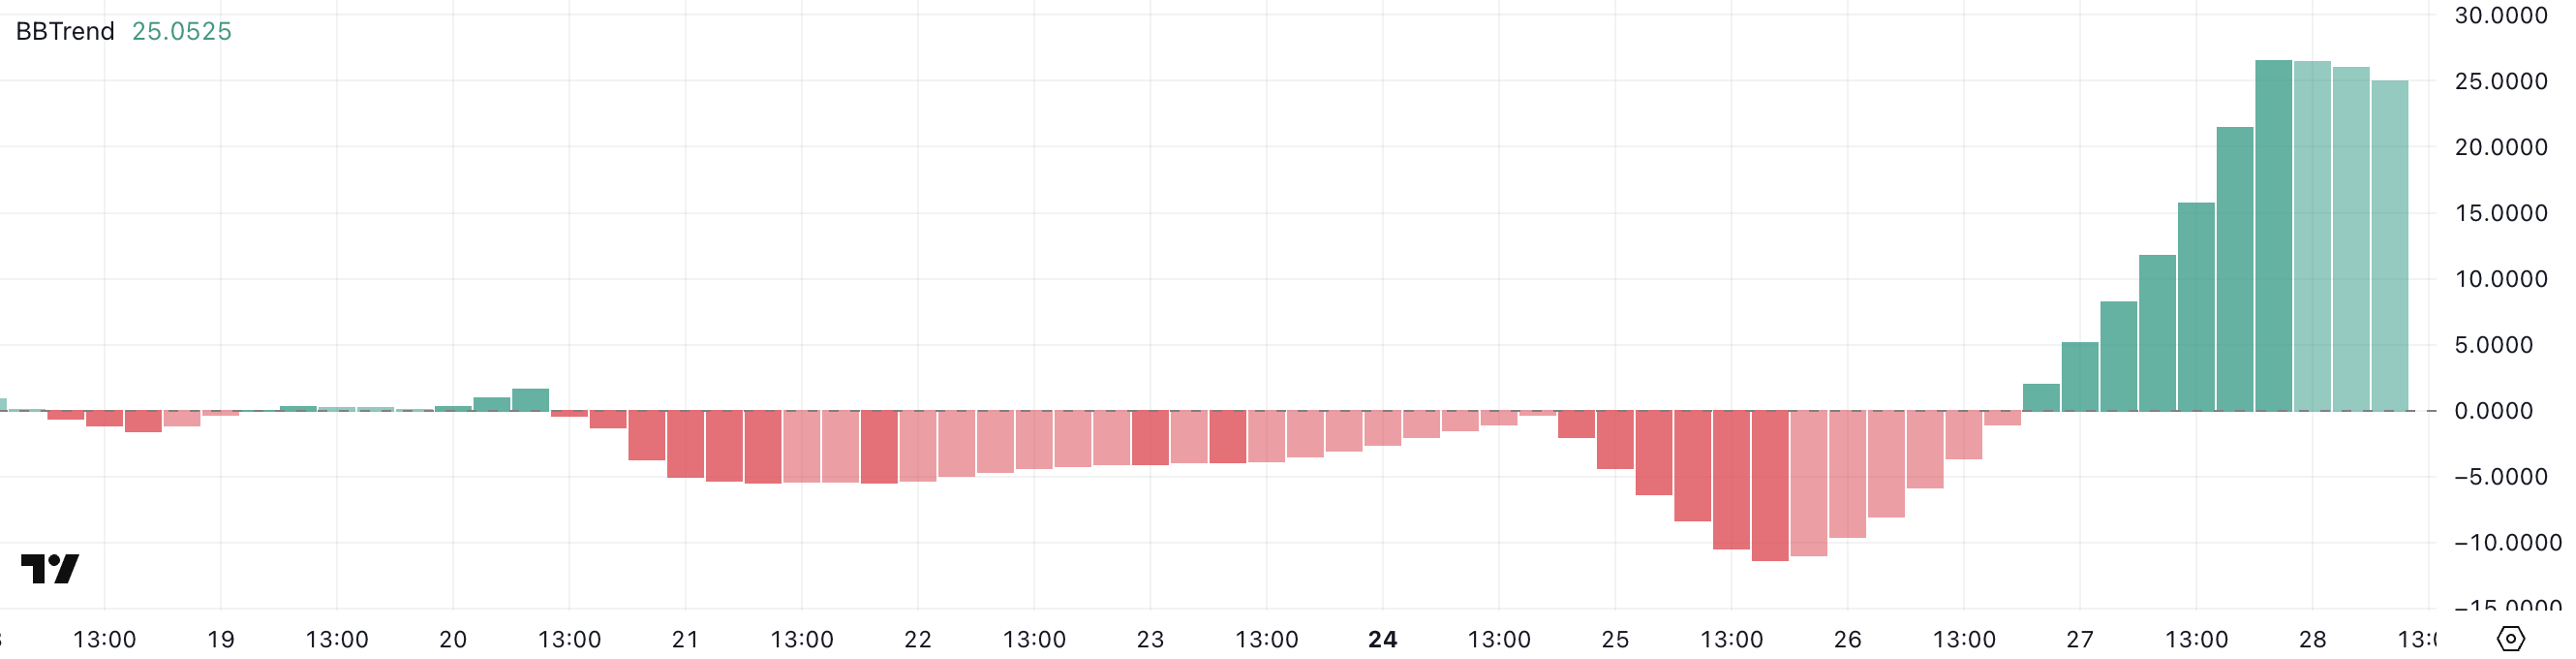
BBTrend, or Bollinger Band Trend, is a momentum indicator that helps identify whether an asset is trending upwards, downwards, or moving sideways.
A positive BBTrend value generally indicates bullish momentum, while a negative value points to bearish sentiment. The higher the value, the stronger the trend.
With CRO’s BBTrend at 25.05, the asset is showing strong bullish momentum, though the slight drop from yesterday’s peak could signal early signs of a cooldown or brief consolidation.
However, as long as the BBTrend stays above zero, the upward bias remains intact, supporting the possibility of further CRO price appreciation.
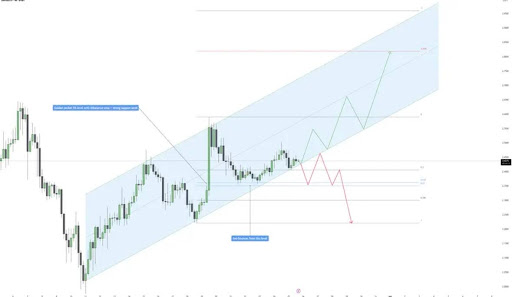
Can Cronos Rise 100% In The Next Weeks?
Cronos price recently climbed above the $0.10 mark for the first time since early February.
The EMA (Exponential Moving Average) indicators are painting a bullish picture, with short-term EMAs positioned above the long-term ones and maintaining a healthy distance between them—often a sign of strong upward momentum.
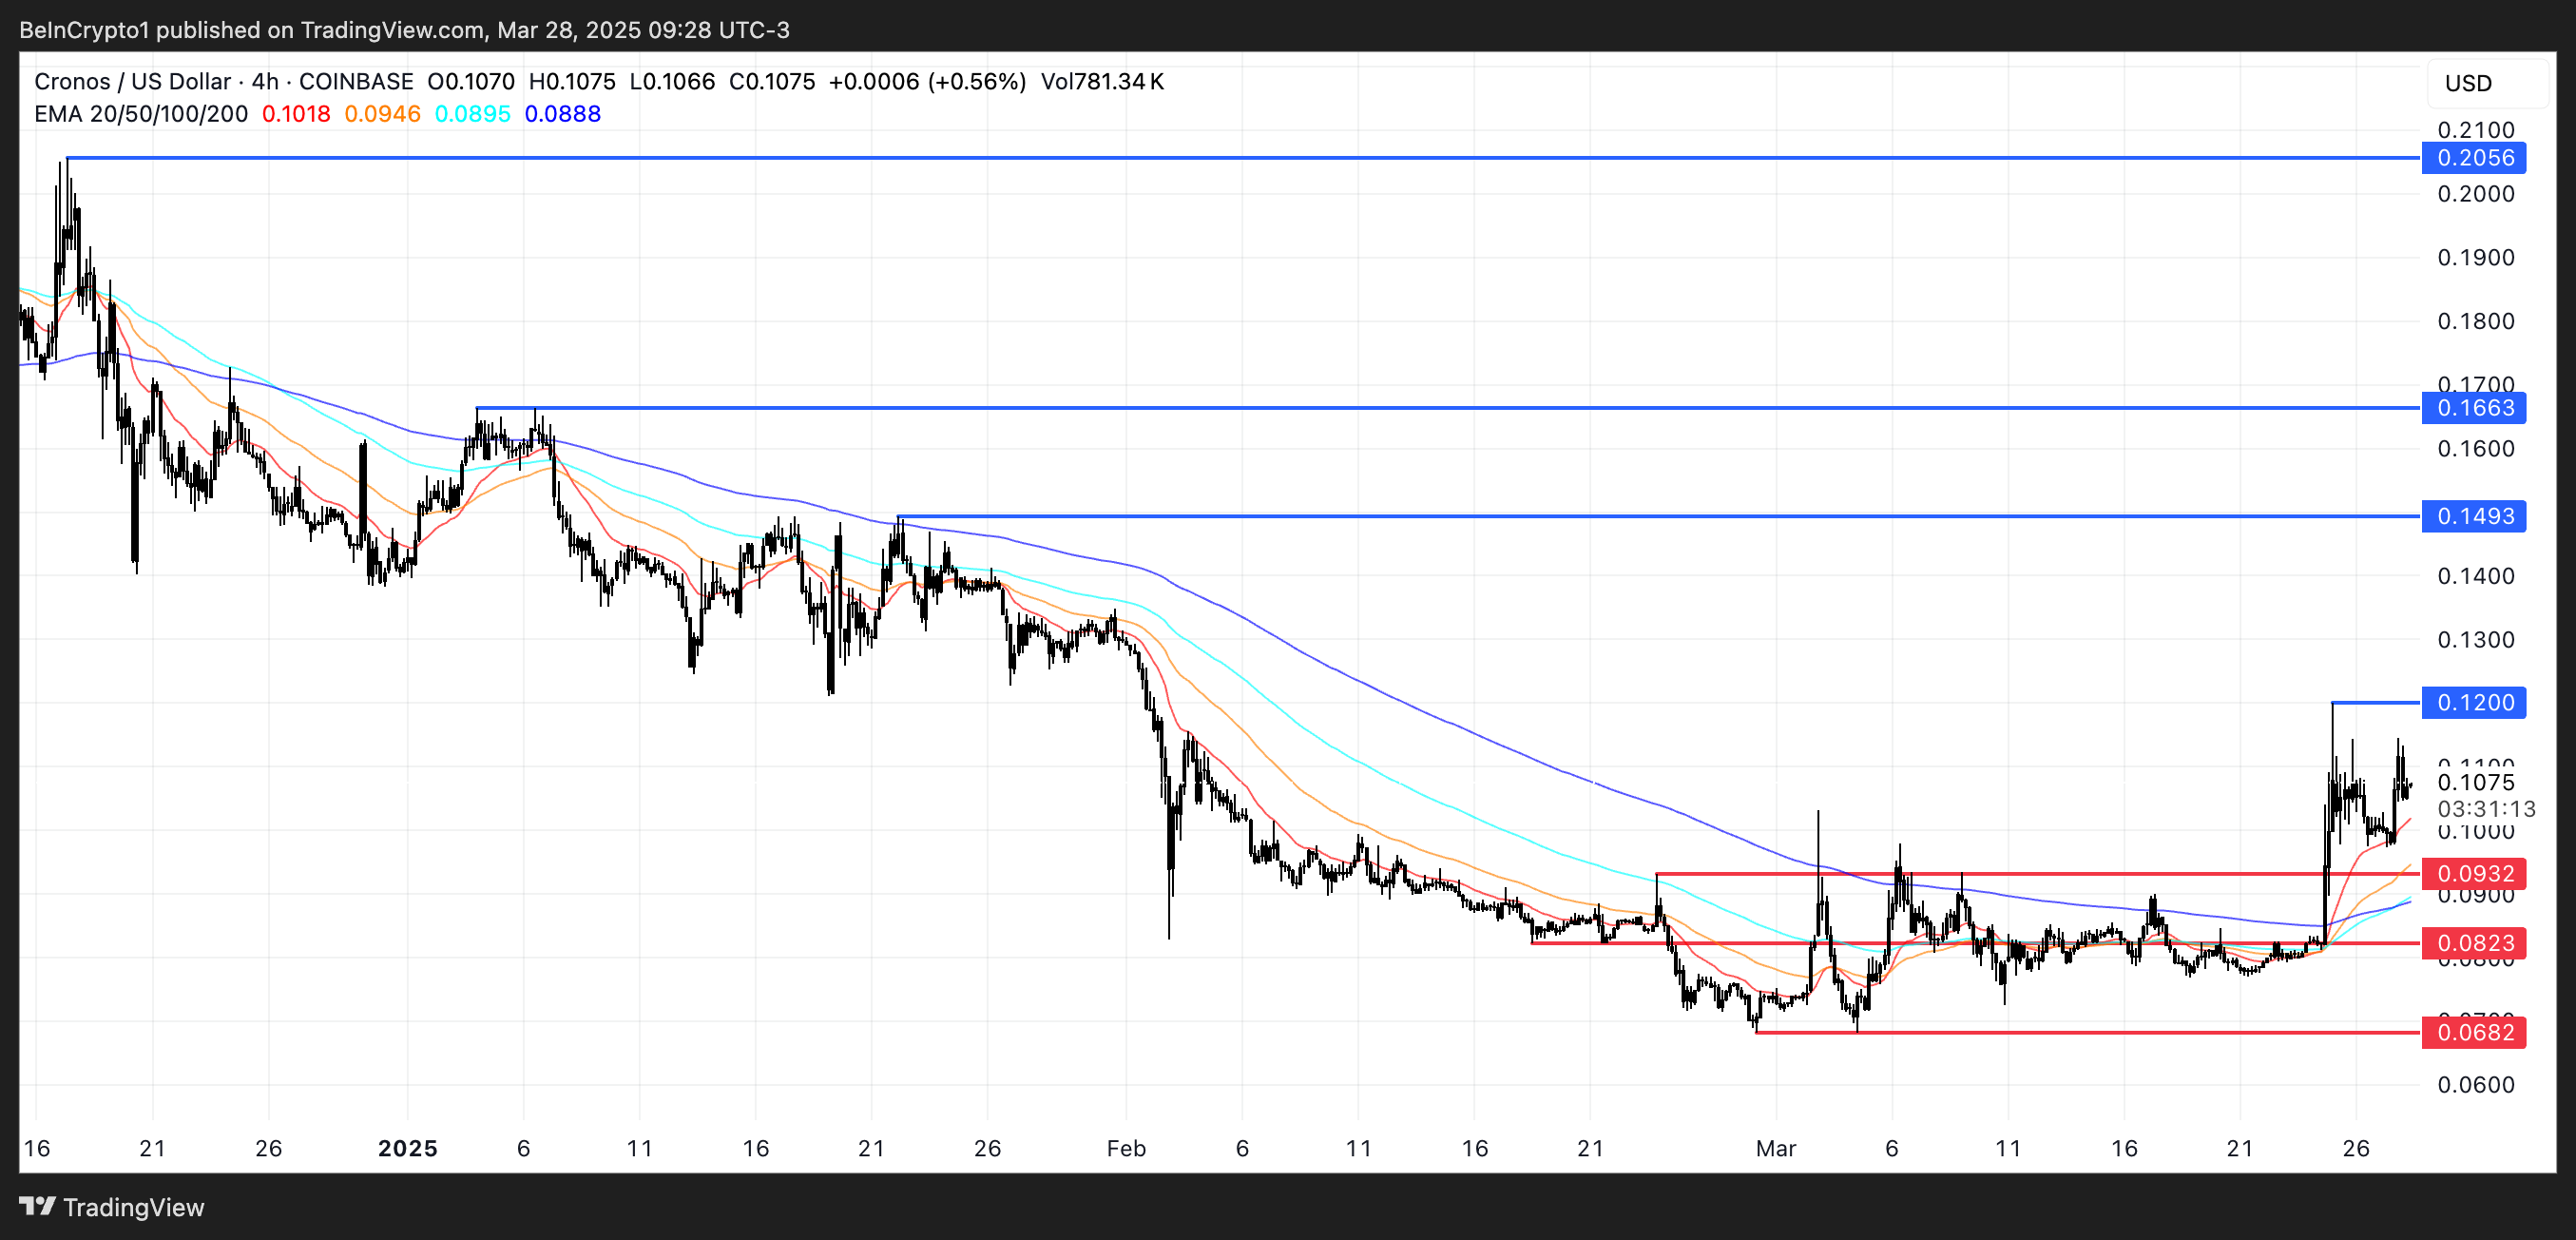
If this trend holds, CRO could target the next resistance levels at $0.12, followed by $0.149 and $0.166.
In the case of a particularly strong rally, a move toward $0.20 is on the table. This would mark its highest price since the end of 2024, as conversations about a potential CRO ETF could gain more traction soon.
However, if bullish momentum starts to wane, CRO may pull back toward key support at $0.093. A break below that could accelerate the correction, with $0.082 and $0.068 as the next potential downside targets.
Disclaimer
In line with the Trust Project guidelines, this price analysis article is for informational purposes only and should not be considered financial or investment advice. BeInCrypto is committed to accurate, unbiased reporting, but market conditions are subject to change without notice. Always conduct your own research and consult with a professional before making any financial decisions. Please note that our Terms and Conditions, Privacy Policy, and Disclaimers have been updated.


Investigations against Javier Milei are proceeding after his involvement in the LIBRA scandal. Judge Sandra Arroyo Salgado is examining his assets and whereabouts during the pump-and-dump incident.
This judge is also investigating similar topics regarding key political allies, especially his sister Karina. At present, it’s unclear if she will file criminal charges, but this scandal is not ideal for anyone’s political career.
How Much Was President Milei Involved With LIBRA?
Since the LIBRA scandal rocked the meme coin market and Argentina’s political space last month, legal consequences have been falling on many of the perpetrators. Arrest warrants were issued for market maker Hayden Davis, and civil suits are active against its private backers.
Now, prosecutors are also investigating President Javier Milei’s assets to determine his LIBRA involvement:
“The LIBRA case would exemplify a crypto scam maneuver…a form of fraud. The promotion of this type of investment can undermine economic and financial systems over which the National Government is obligated to control and regulate their activities to prevent the movement of illicit and extra-systemic capital,” warned Judge Sandra Arroyo Salgado.
Specifically, Judge Arroyo Salgado is investigating Milei’s connections to LIBRA, looking at several avenues. She wishes to determine his entire itinerary during the period that he publicly promoted the token.
Additionally, she ordered an investigation into his assets alongside his sister and several other prominent political allies.
The LIBRA scandal was so massive that investigations against Milei began almost immediately. Several US enforcement agencies were informed that they could also pursue charges against him, but none rose to the opportunity.
By looking at his assets and whereabouts, Arroyo Salgado wishes to nail down definitive proof of his involvement.
President Milei, for his part, immediately denied any direct connection to LIBRA, but a subsequent televised interview only damaged his reputation further. According to a recent poll, most Argentinians have lost trust in their President.
Regardless of the odds of criminal proceedings, factors like this could impede his ability to pass legislation or enact policy.
Ultimately, it’s unclear what specific consequences Milei may face from the LIBRA debacle. He is a sitting head of state, and charging him with a criminal offense would be a dicey prospect in any circumstance.
Still, investigations against him are intensifying. If he did engage in political corruption with the LIBRA backers, it would leave telltale clues.
Disclaimer
In adherence to the Trust Project guidelines, BeInCrypto is committed to unbiased, transparent reporting. This news article aims to provide accurate, timely information. However, readers are advised to verify facts independently and consult with a professional before making any decisions based on this content. Please note that our Terms and Conditions, Privacy Policy, and Disclaimers have been updated.

Chainlink Price Leads Altcoin Selloff, Where Is LINK Price Floor?

XRP Price Eyes 20% Move With Golden Pocket Appearance

Is Bitcoin About To Skyrocket Or Crash? What Truflation Says

Cronos (CRO) Jumps 7%, Tops Altcoin Gainers Today

Argentine Judge Investigates Milei’s Assets for LIBRA Involvement

Analyst Reveals Bullishness On Ethereum Price At This Point, Can It Hit $4,000 Again?

2.52 Million Altcoins Are Ruining Crypto’s Future

Animoca Brands Valuation Tanks 75% In Two Years, Here’s Why

Crypto exchange BingX hacked for $43 million

Are The Big Players Losing Interest?

Hong Kong’s Securities Association Tips Authorities On Crypto Self-Regulation

Coinbase cbBTC Set to go Live on Solana
2.52 Million Altcoins Are Ruining Crypto’s Future
Animoca Brands Valuation Tanks 75% In Two Years, Here’s Why
Crypto exchange BingX hacked for $43 million
Are The Big Players Losing Interest?
Hong Kong’s Securities Association Tips Authorities On Crypto Self-Regulation
Coinbase cbBTC Set to go Live on Solana
-

 Market23 hours ago
Bitcoin Price Stalls at $88K—Can Bulls Overcome Key Resistance?
-
 Altcoin17 hours ago
Why Is Pi Network Coin Price Up 5% Despite Altcoins Market Correction?
-
 Market22 hours ago
Pi Network Integrates With Telegram’s Crypto Wallet
-

 Market21 hours ago
Ethereum Price Struggles—Is Another Breakdown on The Horizon?
-
 Altcoin21 hours ago
Binance Adds Support For MUBARAK, CZ’s Dog, & These Crypto, Here’s All
-

 Market20 hours ago
$14 Billion in Bitcoin and Ethereum Options Set to Expire Today
-

 Market19 hours ago
Dogecoin (DOGE) Faces Market Correction—Will Buyers Step Back In?
-

 Bitcoin18 hours ago
Strategic Bitcoin Reserve Proposed by Brazil’s VP Advisor