
Market
Ethereum Price Trims Gains: Is the Rally Losing Steam?

Ethereum price is correcting gains from the $2,720 resistance. ETH is now trading below $2,650 and might find bids near the $2,600 level.
- Ethereum started a downside correction from the $2,720 zone.
- The price is trading below $2,650 and the 100-hourly Simple Moving Average.
- There is a key bearish trend line forming with resistance at $2,650 on the hourly chart of ETH/USD (data feed via Kraken).
- The pair must stay above the $2,600 support to start a fresh increase in the near term.
Ethereum Price Dips Again
Ethereum price extended gains and traded above the $2,650 level. ETH even cleared the $2,700 level before the bears appeared. A high was formed at $2,728 and the price started a downside correction like Bitcoin.
There was a move below the $2,700 and $2,650 levels. The price traded below the 50% Fib retracement level of the upward move from the $2,554 swing low to the $2,728 high. Ethereum price is now trading below $2,650 and the 100-hourly Simple Moving Average.
However, the price could find bids near the $2,600 level or the 76.4% Fib retracement level of the upward move from the $2,554 swing low to the $2,728 high.
On the upside, the price seems to be facing hurdles near the $2,650 level. There is also a key bearish trend line forming with resistance at $2,650 on the hourly chart of ETH/USD. The first major resistance is near the $2,685 level. The next key resistance is near $2,720.

An upside break above the $2,720 resistance might call for more gains in the coming sessions. In the stated case, Ether could rise toward the $2,840 resistance zone in the near term. The next hurdle sits near the $2,880 level or $2,920.
More Losses In ETH?
If Ethereum fails to clear the $2,650 resistance, it could continue to move down. Initial support on the downside is near the $2,600 level. The first major support sits near the $2,550 zone.
A clear move below the $2,550 support might push the price toward $2,520. Any more losses might send the price toward the $2,450 support level in the near term. The next key support sits at $2,365.
Technical Indicators
Hourly MACD – The MACD for ETH/USD is gaining momentum in the bearish zone.
Hourly RSI – The RSI for ETH/USD is now below the 50 zone.
Major Support Level – $2,600
Major Resistance Level – $2,650


A potential Binance listing could be the next major catalyst for three rising altcoins: IP, PLUME, and GRASS. All three tokens recently appeared in Binance’s latest community listing poll. Each gained more votes than several projects that were ultimately listed.
IP is riding a wave of momentum following a 200% surge, PLUME is gaining traction as real-world assets explode on-chain, and GRASS is drawing strong interest as the AI narrative regains strength. These predictions are based on community engagement and on-chain activity and should not be regarded as conclusive statements.
Story (IP)
Story Protocol is a decentralized infrastructure designed to register, manage, and monetize intellectual property (IP) on-chain. It is gaining momentum as one of the hottest altcoins of the year, fueled by its strong ties to the booming artificial intelligence narrative through on-chain IP management and AI training data licensing.
Therefore, it aims to integrate creative works—such as stories, characters, and artificial intelligence training assets—into the blockchain.
All things considered, this makes it a top spot in Binance’s latest community poll. Its growing popularity and alignment with trending narratives make it a prime candidate for a Binance listing.
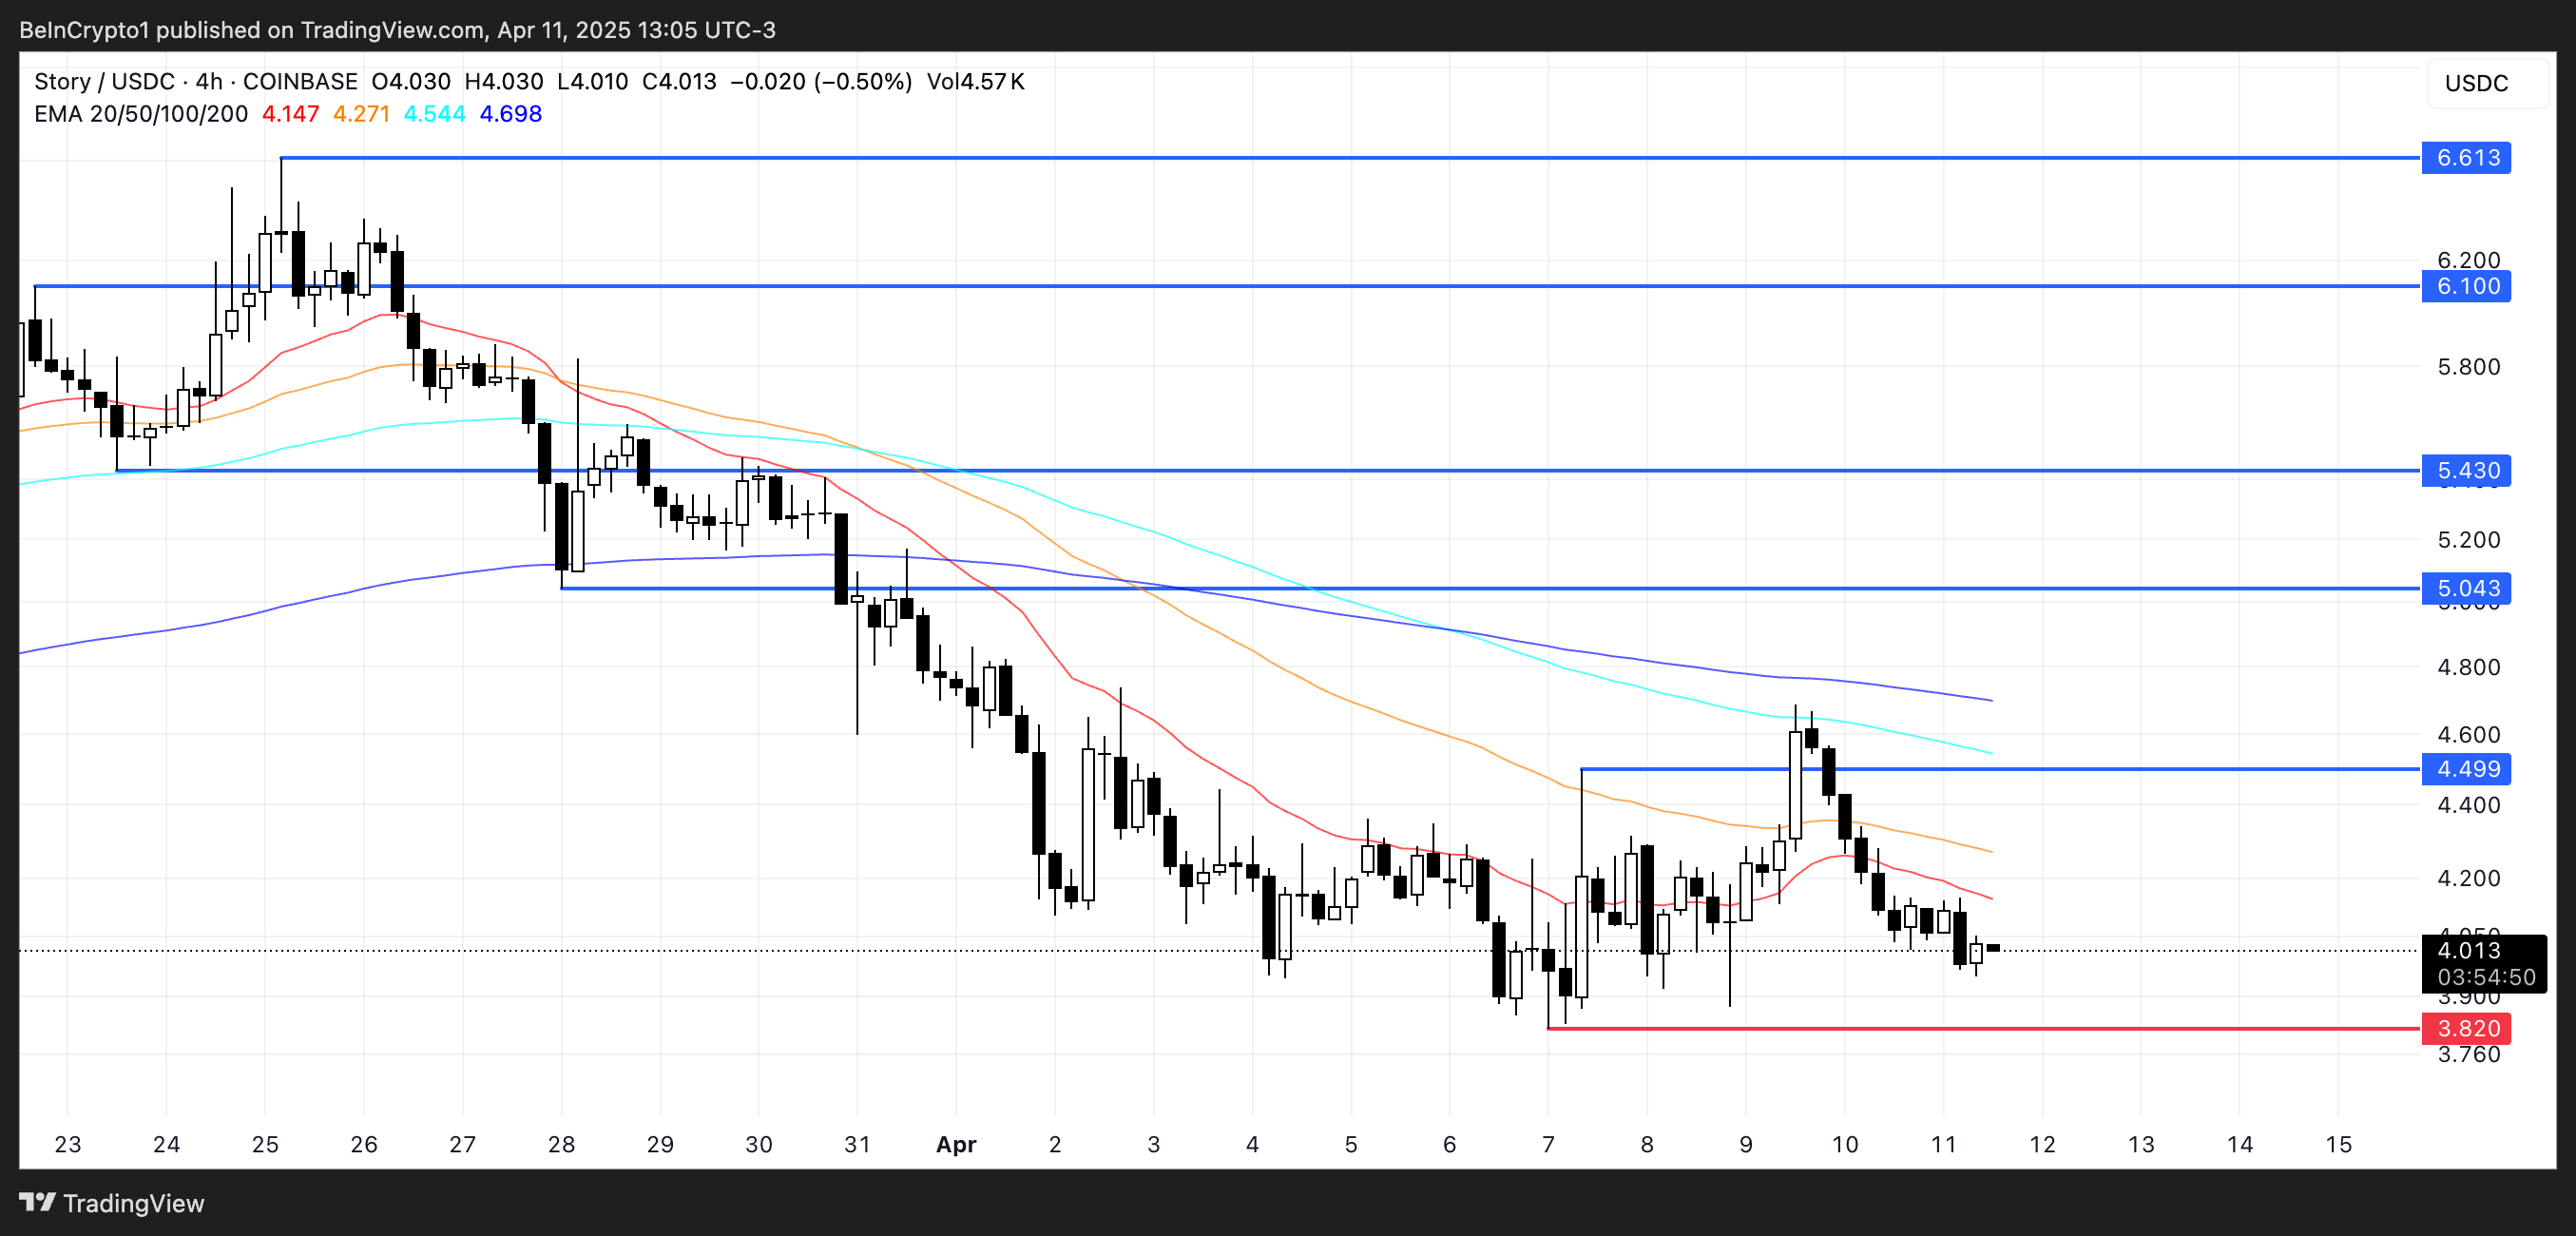
Its native token, IP, surged over 200% between February 18 and March 25.
The token is now attempting to hold onto its $1 billion market cap. It was included in Binance’s latest listing poll, where it secured over 11% of the votes.
A Binance listing could give IP the exposure and liquidity needed to push its price above $5. Then, it has the potential to climb toward $5.43 and even break past $6, levels it briefly reached during its previous rally.
PLUME
Plume Network is riding the real-world asset (RWA) wave, offering a Layer-1 blockchain that brings tokenized assets on-chain—tapping into one of the fastest-growing narratives in crypto.
With ONDO, another RWA-focused coin, recently listed on Binance, Plume’s strong engagement among RWA coins and top placement in the exchange’s community poll make it a prime candidate to follow.
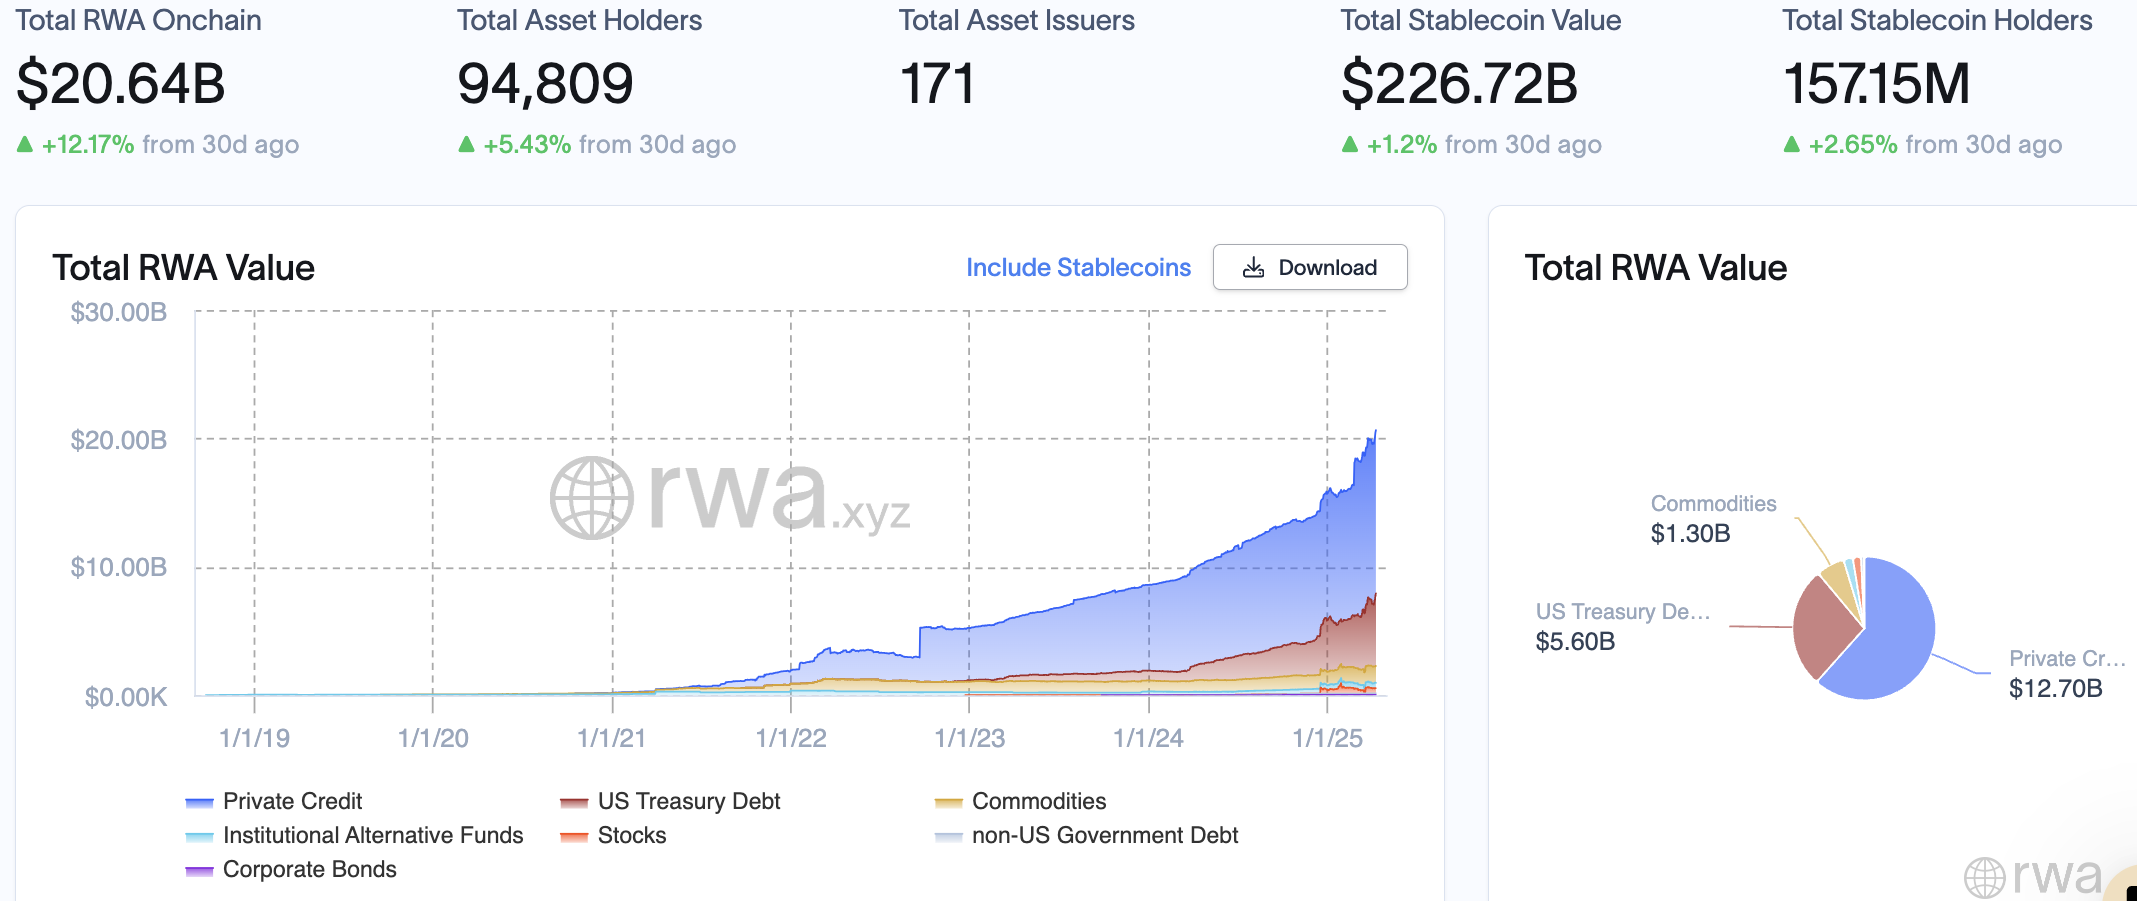
Additionally, with RWA value on-chain recently surpassing $20 billion for the first time, the narrative around real-world assets is gaining fresh momentum.
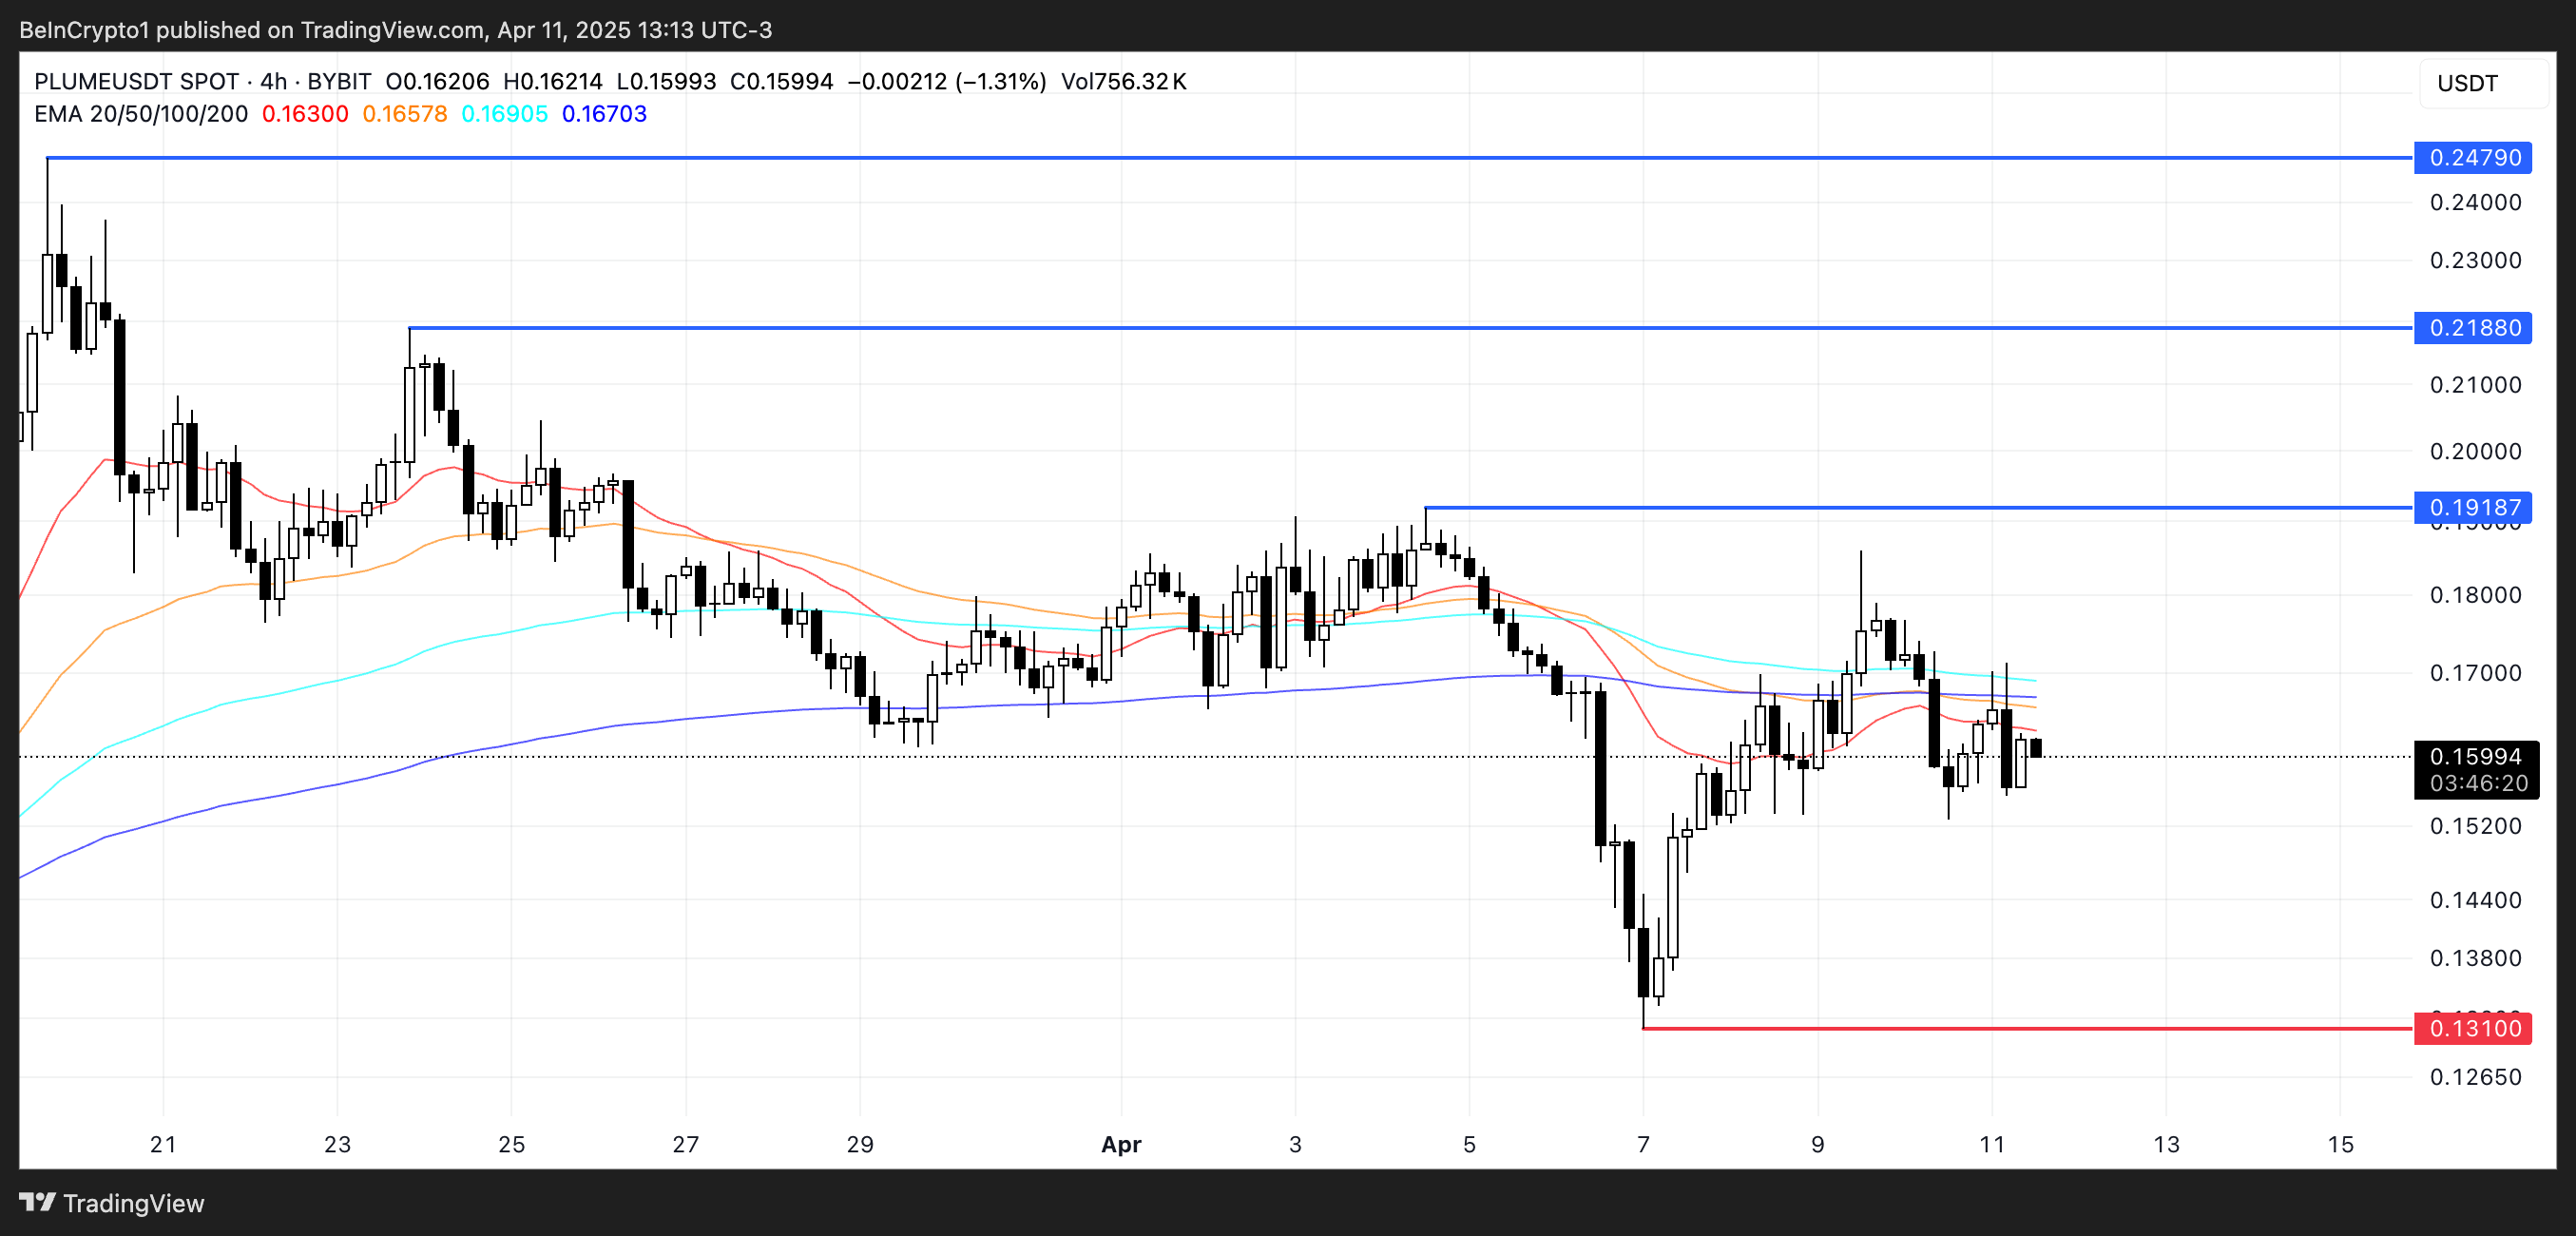
Plume positioned itself as a strong contender in this space by securing nearly 10% of the votes in Binance’s most recent listing poll. It surpassed tokens like ONDO and VIRTUAL that ultimately made the list.
Furthermore, if Plume secures a listing on Binance, the added exposure could fuel a sharp rally, potentially pushing PLUME above $0.20 and toward key targets at $0.247 and even above $0.30 for the first time ever.
GRASS
GRASS stands out for its unique blend of the AI narrative and its position as a Solana-based altcoin. These are two of the most compelling themes in the current market.
As Solana network activity starts to pick up again and investor attention shifts back to its ecosystem, GRASS’s position in the AI ecosystem makes it a strong contender for a Binance listing.
In Binance’s most recent listing poll, GRASS outperformed several notable contenders. That includes ONDO, VIRTUAL, and WAL—yet still awaits an official listing.
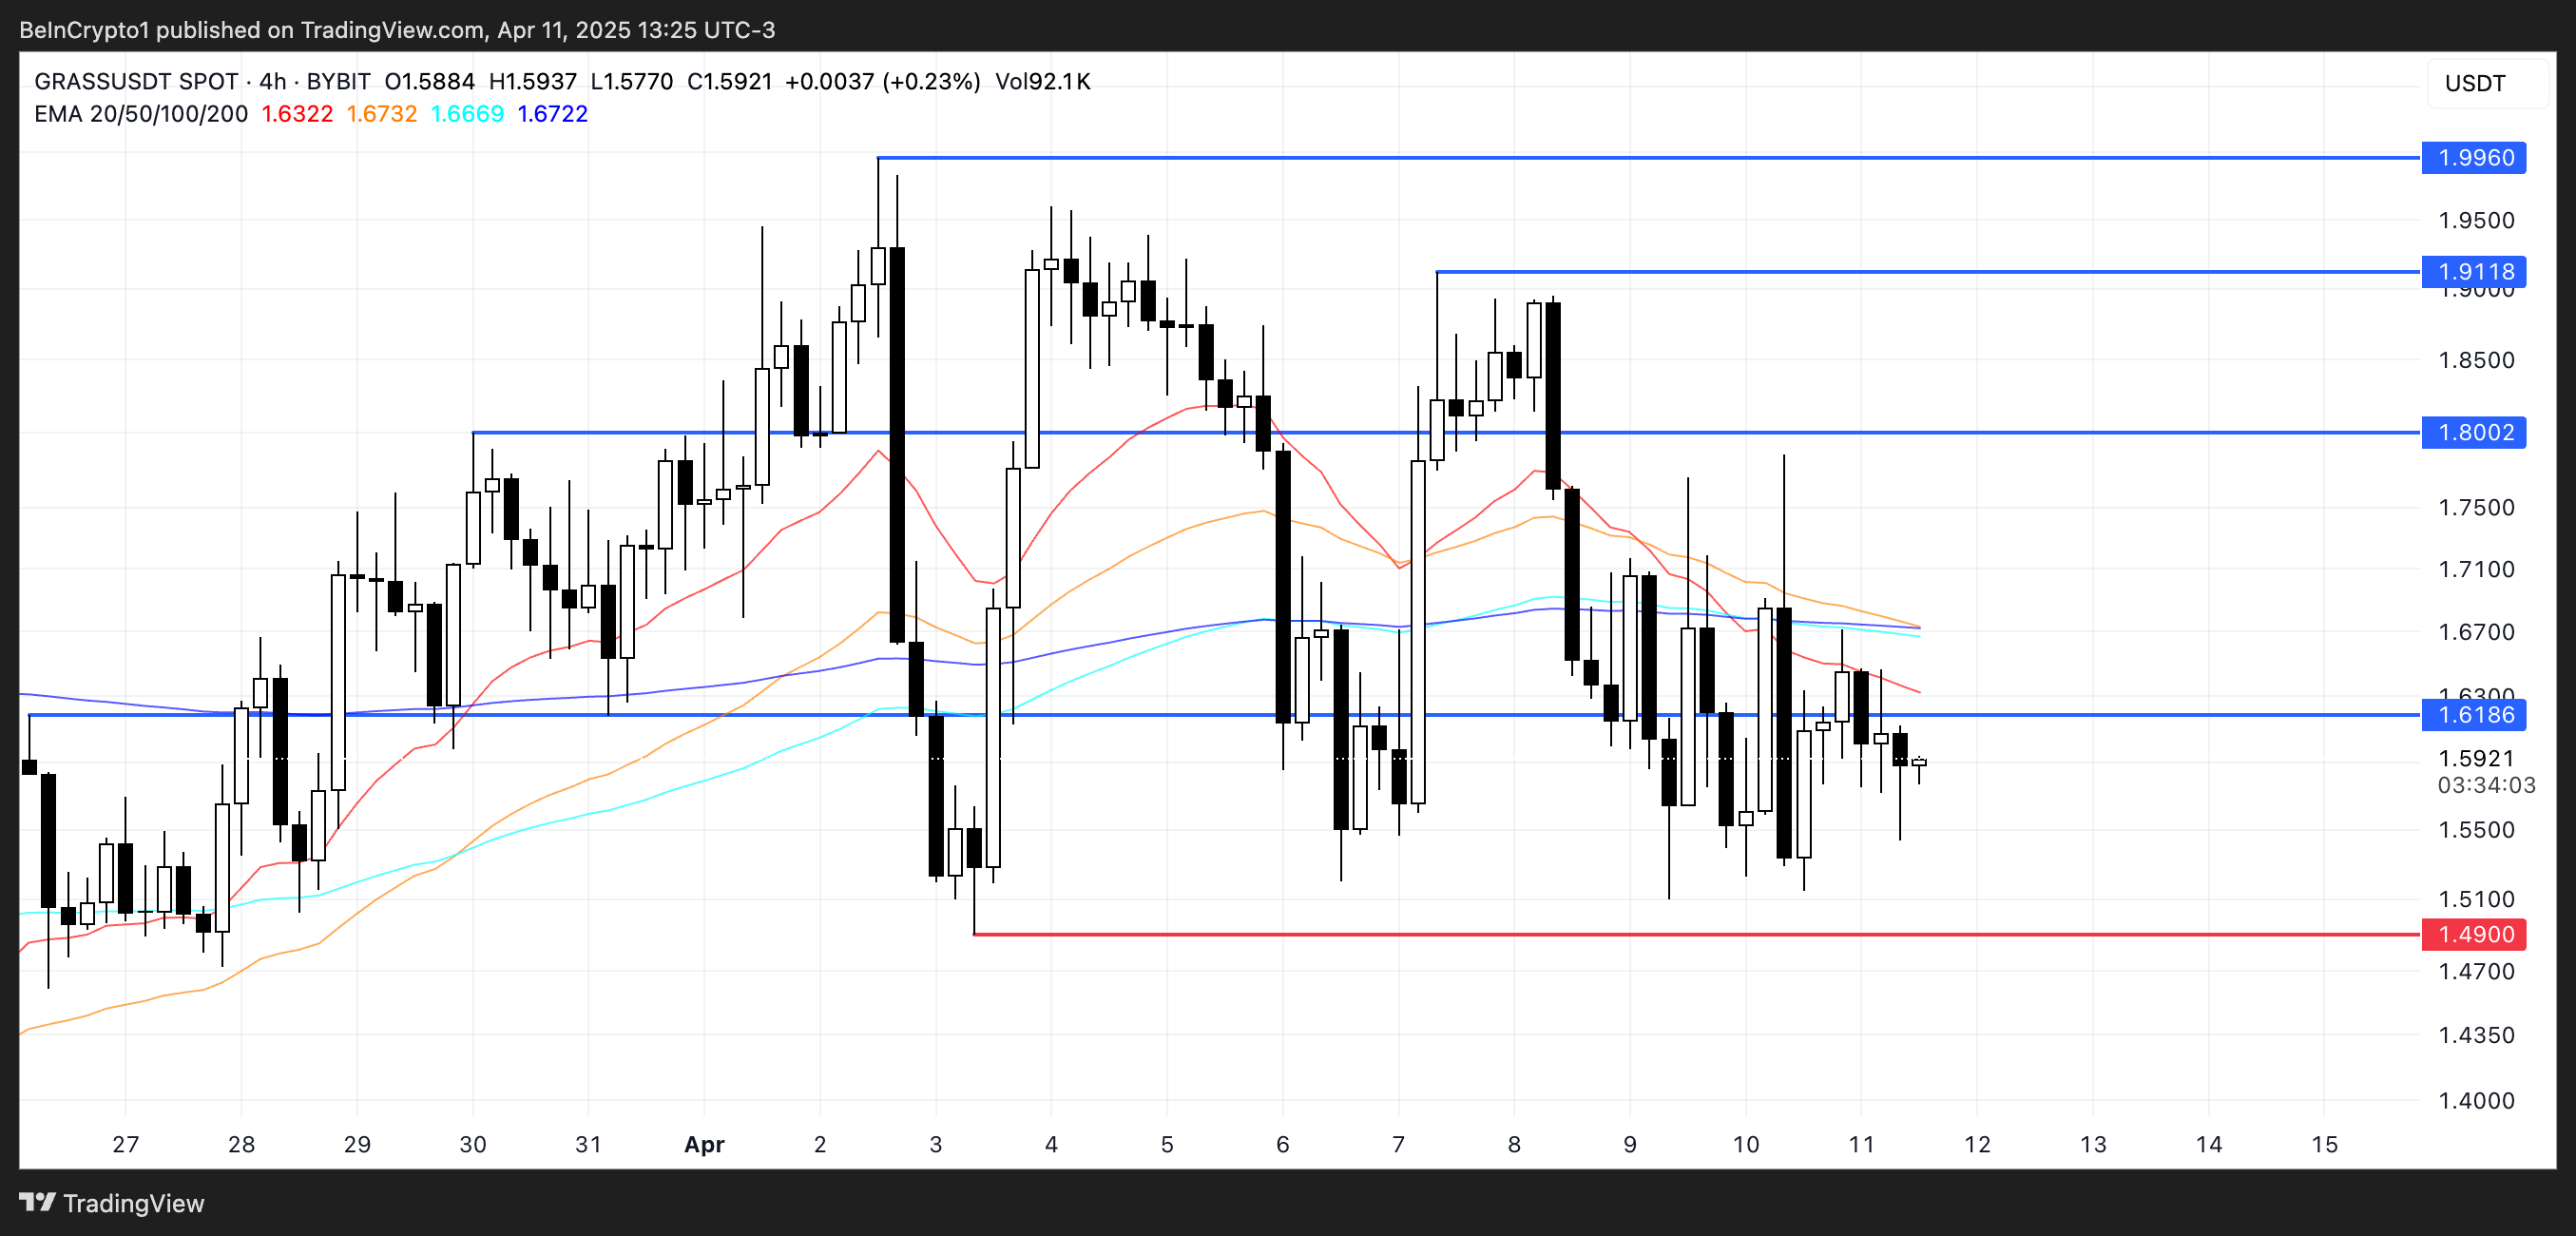
Also, with AI-related tokens and Solana-based projects beginning to bounce back after a prolonged correction since late January, GRASS could be ready for a surge.
In conclusion, if Binance adds GRASS to its listings, the surge in exposure and trading volume could push the token above the $3 mark for the first time since January 6.
Disclaimer
In line with the Trust Project guidelines, this price analysis article is for informational purposes only and should not be considered financial or investment advice. BeInCrypto is committed to accurate, unbiased reporting, but market conditions are subject to change without notice. Always conduct your own research and consult with a professional before making any financial decisions. Please note that our Terms and Conditions, Privacy Policy, and Disclaimers have been updated.

Onchain data shows that RWA tokenization is bucking macroeconomic trends by growing remarkably while other crypto sectors face uncertainty and contractions. There is an increasing belief that these are some of the safest Web3 assets.
Several experts shared key insights into this remarkable growth with BeInCrypto.
How Can RWAs Change Crypto?
Real-world Assets (RWAs) are an important part of the crypto market for several reasons. For example, a report from Binance Research claims that they are the Web3 economy’s most tariff-resilient asset sector.
According to new data, RWAs are growing substantially, surpassing $20 billion on-chain with 12% growth in the last 30 days.
This data gives a few key insights that may be especially relevant in the near future. Importantly, while most of the crypto market is retreating under macroeconomic concerns, the RWA sector is on the rise.
Over the past month, Trump’s on-and-off tariff chaos and inflation fears have injected extreme volatility into the crypto market. Altcoins like Ethereum and XRP have lost over 10% on the monthly chart, but daily volatility has been much worse.
However, major RWA tokens, like Chainlink, Mantra, and ONDO, either remained comparatively stable or had positive positive gains during this period.
Kevin Rusher, founder of RWA lending platform RAAC, remarked on these dynamics in an exclusive commentary shared with BeInCrypto.
“The tokenized RWA market crossing $20 billion in this market is a strong signal. First, it is the only sector in crypto still reaching new ATHs while most are far from their highest levels and suffering heavy losses. Secondly, it shows that it’s not only hype anymore. Institutions are not just talking about it; they are actively tokenizing Real World Assets now,” Rusher said.
Rusher’s comments about institutional RWA investment are clearly visible in the crypto market. On April 7, MANTRA’s OM token held onto value despite broad-sector losses, as it announced a $108 million RWA fund.
Major institutional investors like BlackRock and Fidelity have also increased their RWA commitments.
Rusher went on to state that RWAs are especially attractive because of their stability. Although most of the crypto market is highly susceptible to volatility, RWAs are “building actual infrastructure with long-term value” and generating liquidity.
Tracy Jin, COO of crypto exchange MEXC, also echoed these sentiments:
“Historically, during seasons of liquidity crunch, investors seek refuge in more traditional stable assets like treasuries or cash. However, this time, the geopolitical turbulence has also triggered a sell-off in treasuries. With tokenized gold approaching a $2 billion market cap and tokenized treasuries seeing an 8.7% increase over the past 7 days, these assets continue to build market momentum at the heart of the general market slump,” Jin stated.
Overall, the capital flowing into the RWA ecosystem amid the financial market storm is a positive indicator for the broader crypto space. These funds could even encourage investors to increase their crypto exposure after the market settles. For these reasons, the RWA space has a lot of immediate potential.
Disclaimer
In adherence to the Trust Project guidelines, BeInCrypto is committed to unbiased, transparent reporting. This news article aims to provide accurate, timely information. However, readers are advised to verify facts independently and consult with a professional before making any decisions based on this content. Please note that our Terms and Conditions, Privacy Policy, and Disclaimers have been updated.

Welcome to the US Morning Crypto Briefing—your essential rundown of the most important developments in crypto for the day ahead.
Grab a coffee to see how investors in emerging markets are doubling down on digital assets and tokenized alternatives as the US dollar falters and inflation risks rise.
Investors Turn To Crypto, Gold Amid Imminent Challenging Economy for the US
Escalated trade war chaos and abounding recession concerns, these narratives have put the status of the US as a haven in question while exacerbating volatility in financial markets.
Now, headlines in Washington are focused on escalating trade tensions, making US crypto news a key market driver. According to Raafi Housain, CEO of digital asset platform Fasset, trading volume has surged internationally for particular assets.
“While US tariff headlines have dominated the macro conversation, in emerging markets we’re seeing a more nuanced response. In countries like Indonesia and Pakistan, trading activity on Fasset has more than doubled this week — partly as users return from Eid, but also due to growing demand for assets that feel resilient amid uncertainty,” Housain told BeInCrypto.
This suggests that perceptive investors are rethinking their strategies and repurposing their portfolios. Specifically, they are looking to new avenues, such as emerging markets, where access to traditional assets has historically been limited.
“Crypto is leading that surge, but we’re also seeing increased appetite for tokenized gold and, interestingly, US equities,” he added.
This portfolio diversification effort is unsurprising, considering US President Donald Trump’s tariff agenda is triggering global market volatility.
Already, macroeconomic signals are darkening despite the Federal Reserve’s (Fed) current inflation figures not fully reflecting the impact of ongoing tariffs.
Economists are sounding the alarm, with Moody’s Analytics chief economist Mark Zandi warning of inflationary pressures by summer.
“…inflation statistics will look pretty ugly by mid-summer if the current trade policies remain in place,” Zandi stated.
Zandi did not rule out the possibility of a recession, with his sentiment coming despite President Donald Trump’s 90-day pause on all reciprocal tariffs, but for China.
This warning aligns with China’s assertion that retaliatory tariffs on US goods lack competitiveness under current tariffs. Recognizing that tariffs are effectively a tax on imports paid by US businesses, Zandi added that these costs are usually passed on to consumers.
Meanwhile, as the investment scope shifts for well-informed investors, Housain notes adaptation, not panic.
“It’s clear that investors in high-growth markets aren’t retreating; they’re recalibrating — seeking diversification and more control in an unpredictable environment,” Housain explained.
Elsewhere, the dollar index (DXY) is dipping against a progressively rising cost of goods. Against this backdrop, crypto, tokenized commodities, and digital access to US equities are the hedges of choice for now.
Chart of the Day
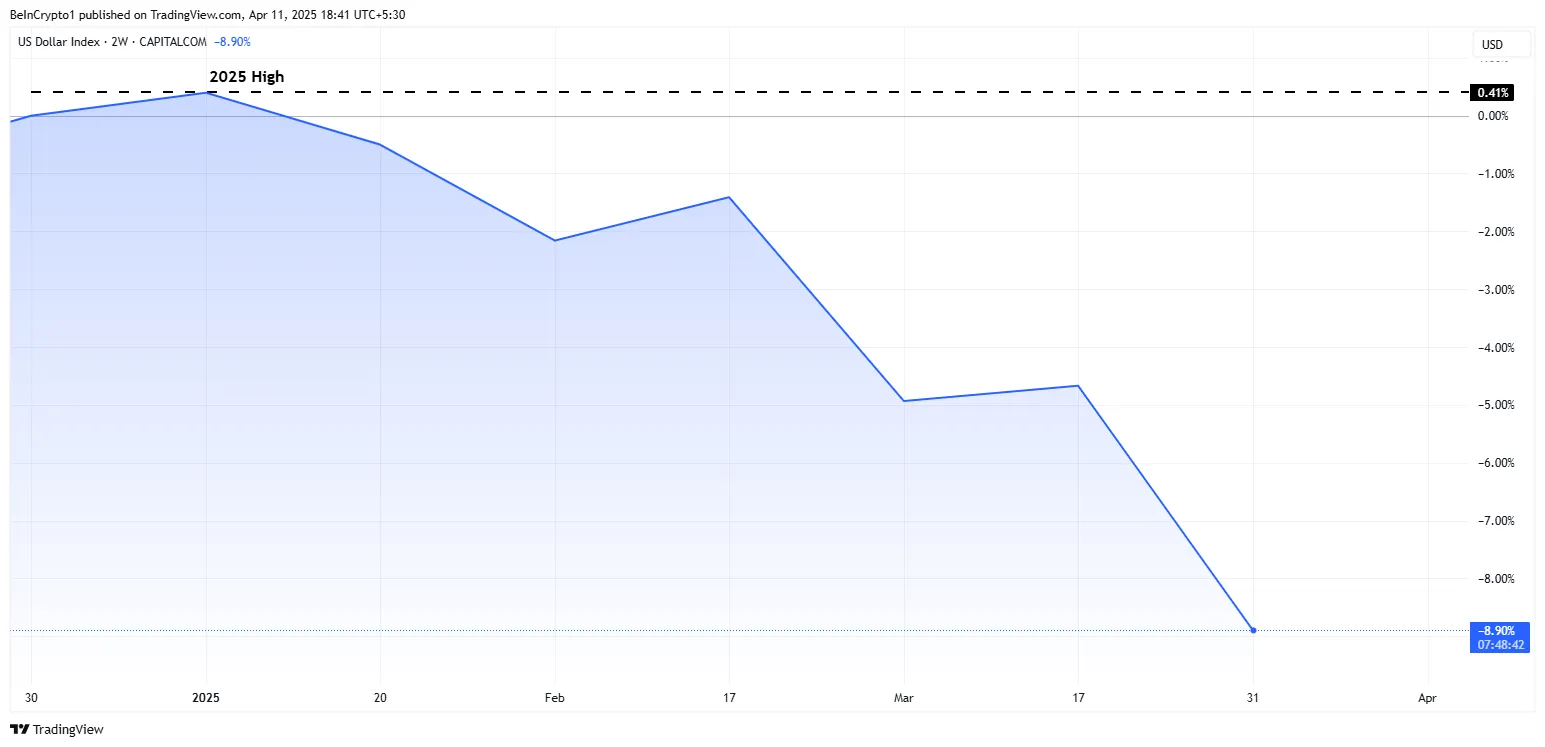
Data on TradingView shows the DXY is down by nearly 10% year-to-date (YTD), from the January 13 intra-day high of $109.87 to $99.04 as of this writing.
Byte-Sized Alpha
Crypto Equities Pre-Market Overview
| Company | Market open |
| Strategy (MSTR) | $284.26 (+5.98%) |
| Coinbase Global (COIN): | $171.09 (+1.22%) |
| Galaxy Digital Holdings (GLXY) | $14.29 (+3.97%) |
| MARA Holdings (MARA) | $11.94 (+7.10%) |
| Riot Platforms (RIOT) | $6.85 (+4.41%) |
| Core Scientific (CORZ) | $6.75 (1.91%) |
Disclaimer
In adherence to the Trust Project guidelines, BeInCrypto is committed to unbiased, transparent reporting. This news article aims to provide accurate, timely information. However, readers are advised to verify facts independently and consult with a professional before making any decisions based on this content. Please note that our Terms and Conditions, Privacy Policy, and Disclaimers have been updated.

3 Altcoins to Watch for Binance Listing This April

US Senators Reintroduce PROOF Act To Set Reserve Standards for Crypto Firms

Is It the Safest Crypto Sector?
Investors Shift to Crypto, Gold, and Equities Amid Tariff Volatility

How You Can Find Altcoin Winners Early

Binance, Trade Wars, Ripple and SEC

2.52 Million Altcoins Are Ruining Crypto’s Future

Animoca Brands Valuation Tanks 75% In Two Years, Here’s Why

Crypto exchange BingX hacked for $43 million

Are The Big Players Losing Interest?

Hong Kong’s Securities Association Tips Authorities On Crypto Self-Regulation

Coinbase cbBTC Set to go Live on Solana
2.52 Million Altcoins Are Ruining Crypto’s Future
Animoca Brands Valuation Tanks 75% In Two Years, Here’s Why
Crypto exchange BingX hacked for $43 million
Are The Big Players Losing Interest?
Hong Kong’s Securities Association Tips Authorities On Crypto Self-Regulation
Coinbase cbBTC Set to go Live on Solana
-
 Market24 hours ago
3 Bullish Altcoins Surging After Trump’s Tariff Pause
-

 Market11 hours ago
XRP Price Ready to Run? Bulls Eyes Fresh Gains Amid Bullish Setup
-

 Market22 hours ago
ADA Price Surge Signals a Potential Breakout
-

 Bitcoin24 hours ago
This is Why Hoskinson Thinks Bitcoin Will Hit $250,000 in 2025
-

 Market23 hours ago
Hedera (HBAR) Jumps 14%—More Gains Ahead?
-
 Altcoin13 hours ago
XRP Price Risks 40% Drop to $1.20 If It Doesn’t Regain This Level
-

 Bitcoin22 hours ago
Bitcoin Holders are More Profitable Than Ethereum Since 2023
-

 Market21 hours ago
Ethereum Price Climbs, But Key Indicators Still Flash Bearish