
Market
Ethereum Price Sets Its Sights on Higher Levels: Can Bulls Maintain Momentum?

Ethereum price started a recovery wave above the $2,650 zone. ETH is showing positive signs and might aim for a move above the $2,880 resistance.
- Ethereum started a decent upward move above the $2,650 zone.
- The price is trading below $2,850 and the 100-hourly Simple Moving Average.
- There was a break above a short-term declining channel with resistance at $2,780 on the hourly chart of ETH/USD (data feed via Kraken).
- The pair could start a fresh decline if it stays below the $2,880 level.
Ethereum Price Recovery Gains Pace
Ethereum price started a recovery wave after it dropped heavily below $2,500, underperforming Bitcoin. ETH tested the $2,120 zone and recently started a decent upward move.
The price was able to surpass the $2,550 and $2,650 resistance levels. It even climbed above the 50% Fib retracement level of the downward wave from the $3,400 swing high to the $2,120 swing low. There was also a break above a short-term declining channel with resistance at $2,780 on the hourly chart of ETH/USD.
Ethereum price is now trading below $2,850 and the 100-hourly Simple Moving Average. On the upside, the price seems to be facing hurdles near the $2,840 level and the 100-hourly Simple Moving Average.
The first major resistance is near the $2,880 level. The main resistance is now forming near $2,920 or the 61.8% Fib retracement level of the downward wave from the $3,400 swing high to the $2,120 swing low. A clear move above the $2,920 resistance might send the price toward the $3,000 resistance.

An upside break above the $3,000 resistance might call for more gains in the coming sessions. In the stated case, Ether could rise toward the $3,120 resistance zone or even $3,250 in the near term.
Another Decline In ETH?
If Ethereum fails to clear the $2,840 resistance, it could start another decline. Initial support on the downside is near the $2,700 level. The first major support sits near the $2,640 zone.
A clear move below the $2,640 support might push the price toward the $2,550 support. Any more losses might send the price toward the $2,550 support level in the near term. The next key support sits at $2,500.
Technical Indicators
Hourly MACD – The MACD for ETH/USD is gaining momentum in the bullish zone.
Hourly RSI – The RSI for ETH/USD is now above the 50 zone.
Major Support Level – $2,640
Major Resistance Level – $2,880


The value of Cardano’s ADA has soared nearly 10% in the past 24 hours, joining the broader crypto market in a strong recovery rally.
The coin’s technical indicators point to renewed bullish momentum, suggesting that ADA may be gearing up for further gains in the near term.
Cardano Gathers Steam with an 8% Gain
ADA is up 8% over the past day, with its recent price action hinting at growing investor confidence. A key factor supporting this upward trajectory is the rise in its Chaikin Money Flow (CMF), signaling increased capital inflow and accumulation.
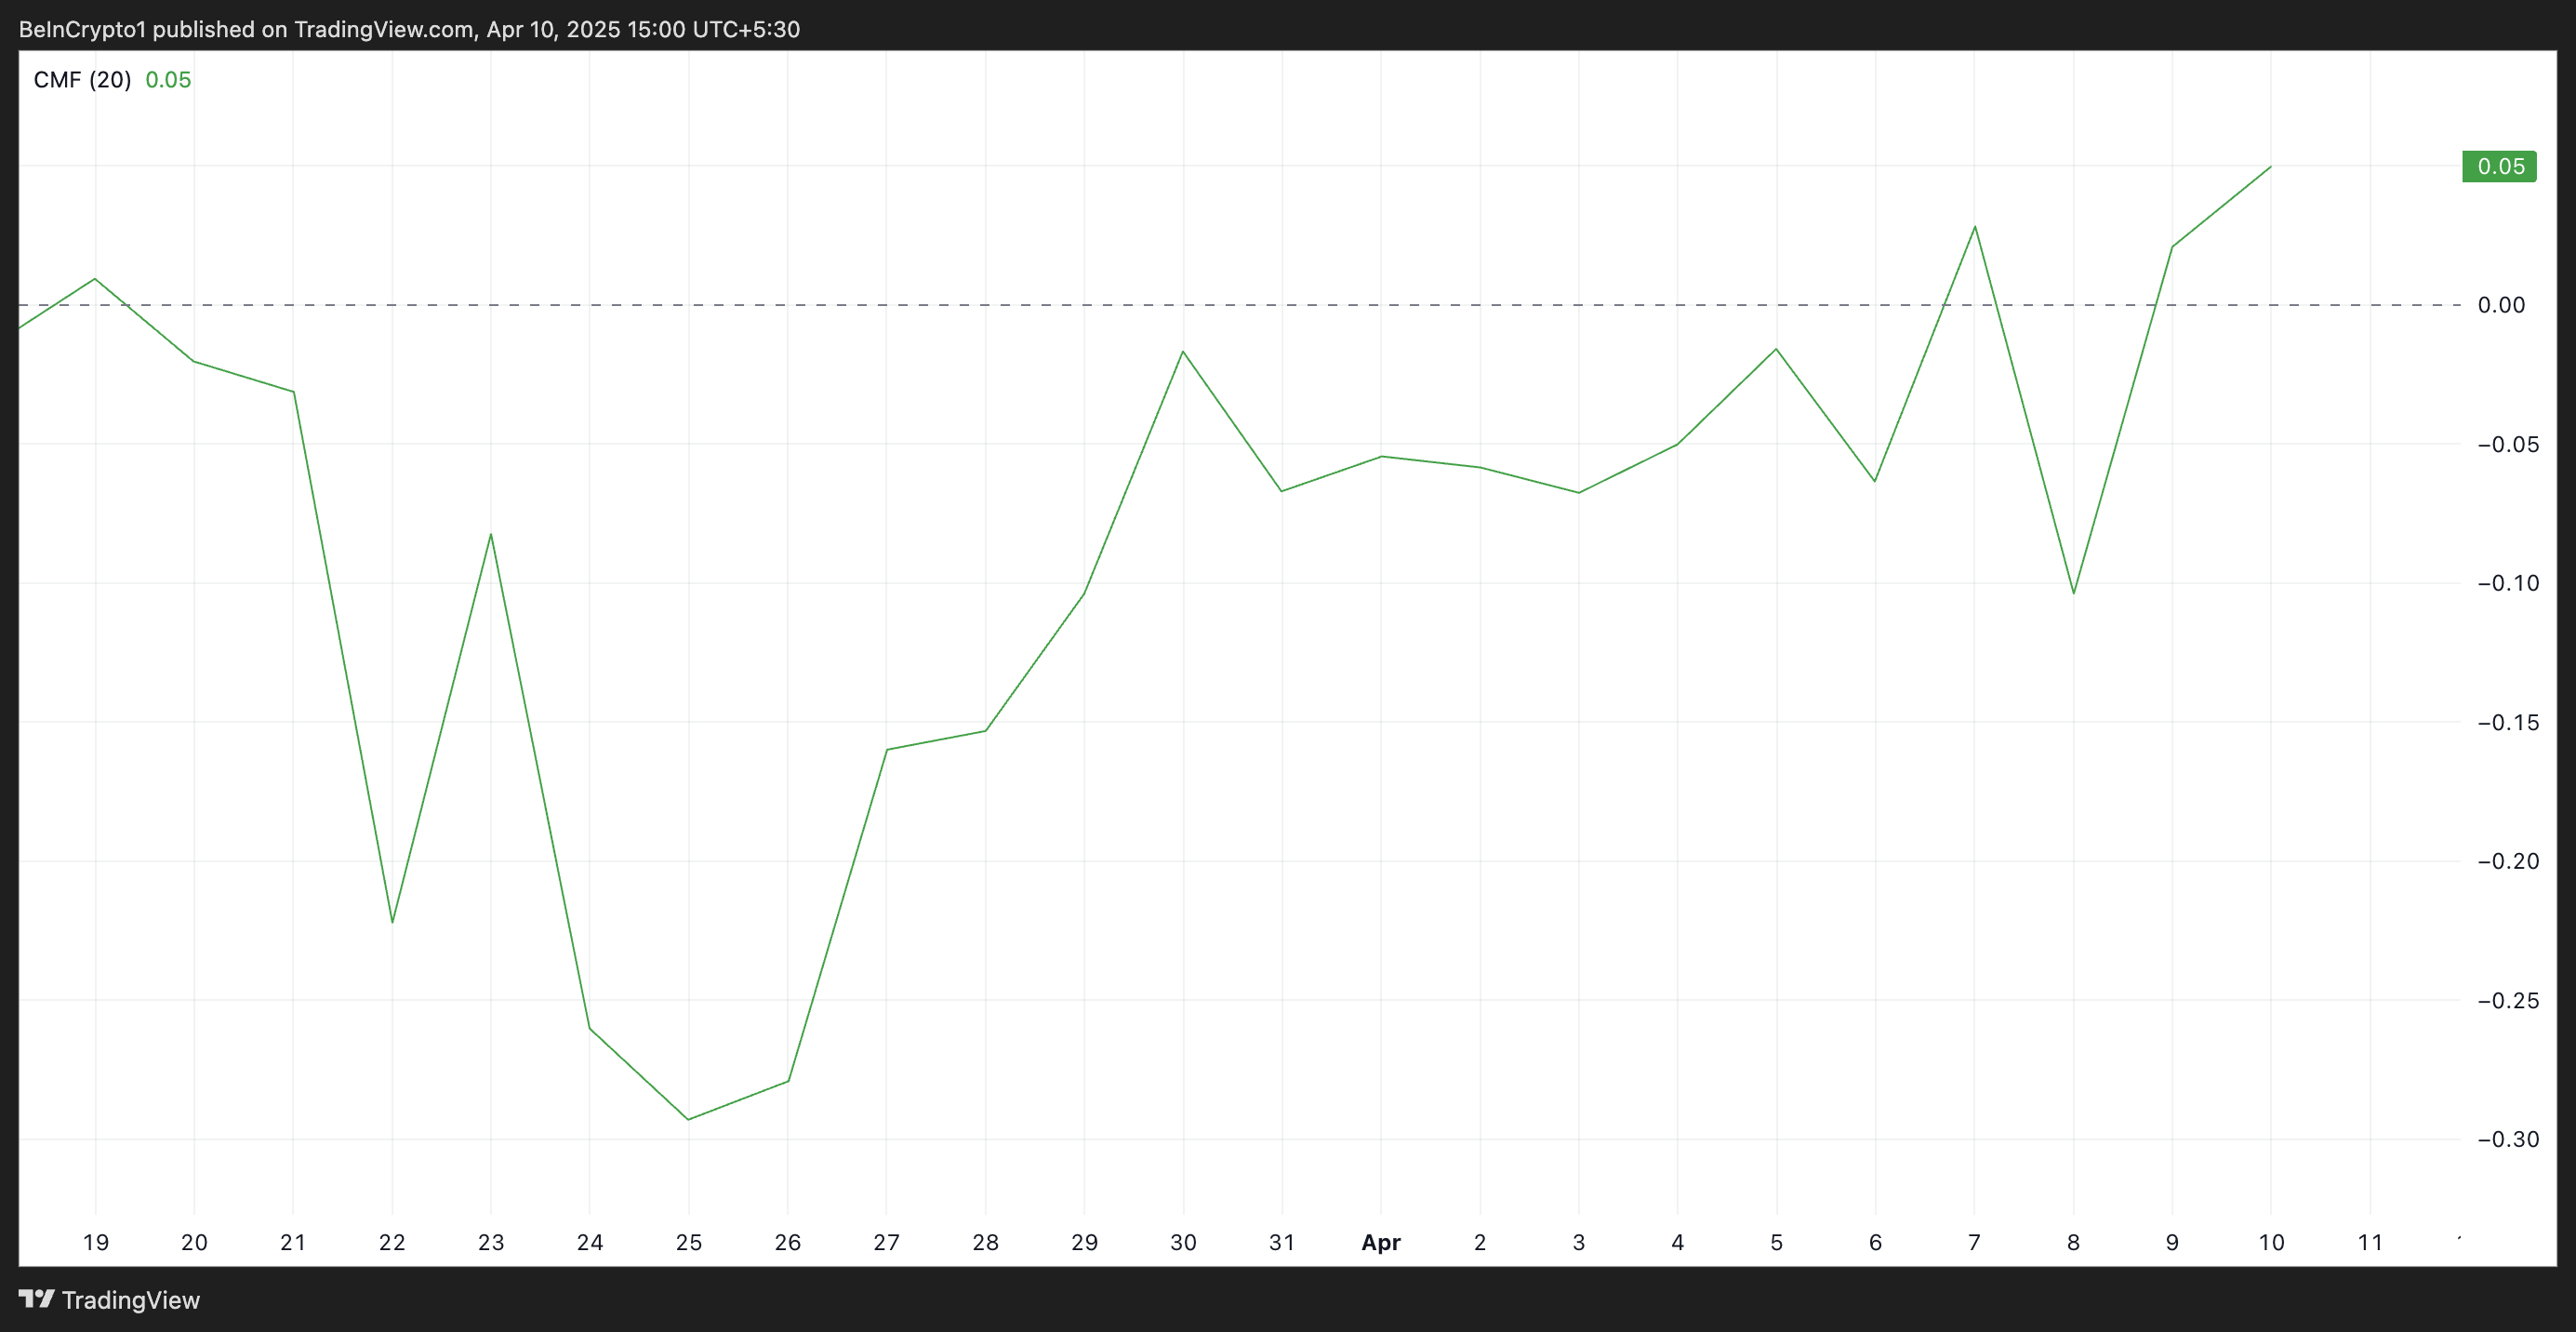
At press time, this indicator, which measures the flow of money into and out of an asset, rests above the zero line at 0.05 and is in an uptrend.
An asset’s positive CMF reading indicates that buying pressure is stronger than selling pressure, suggesting accumulation. This signals growing bullish sentiment in the ADA spot markets as more investors buy the altcoin.
Additionally, ADA’s Moving Average Convergence Divergence (MACD) is approaching a potential golden cross—a historically bullish indicator that occurs when the MACD line (blue) crosses above the signal line.
The MACD indicator measures asset price trends and identifies reversal points. When a potential golden cross emerges, it hints at an upcoming bullish crossover, often seen as an early indicator of upward momentum.
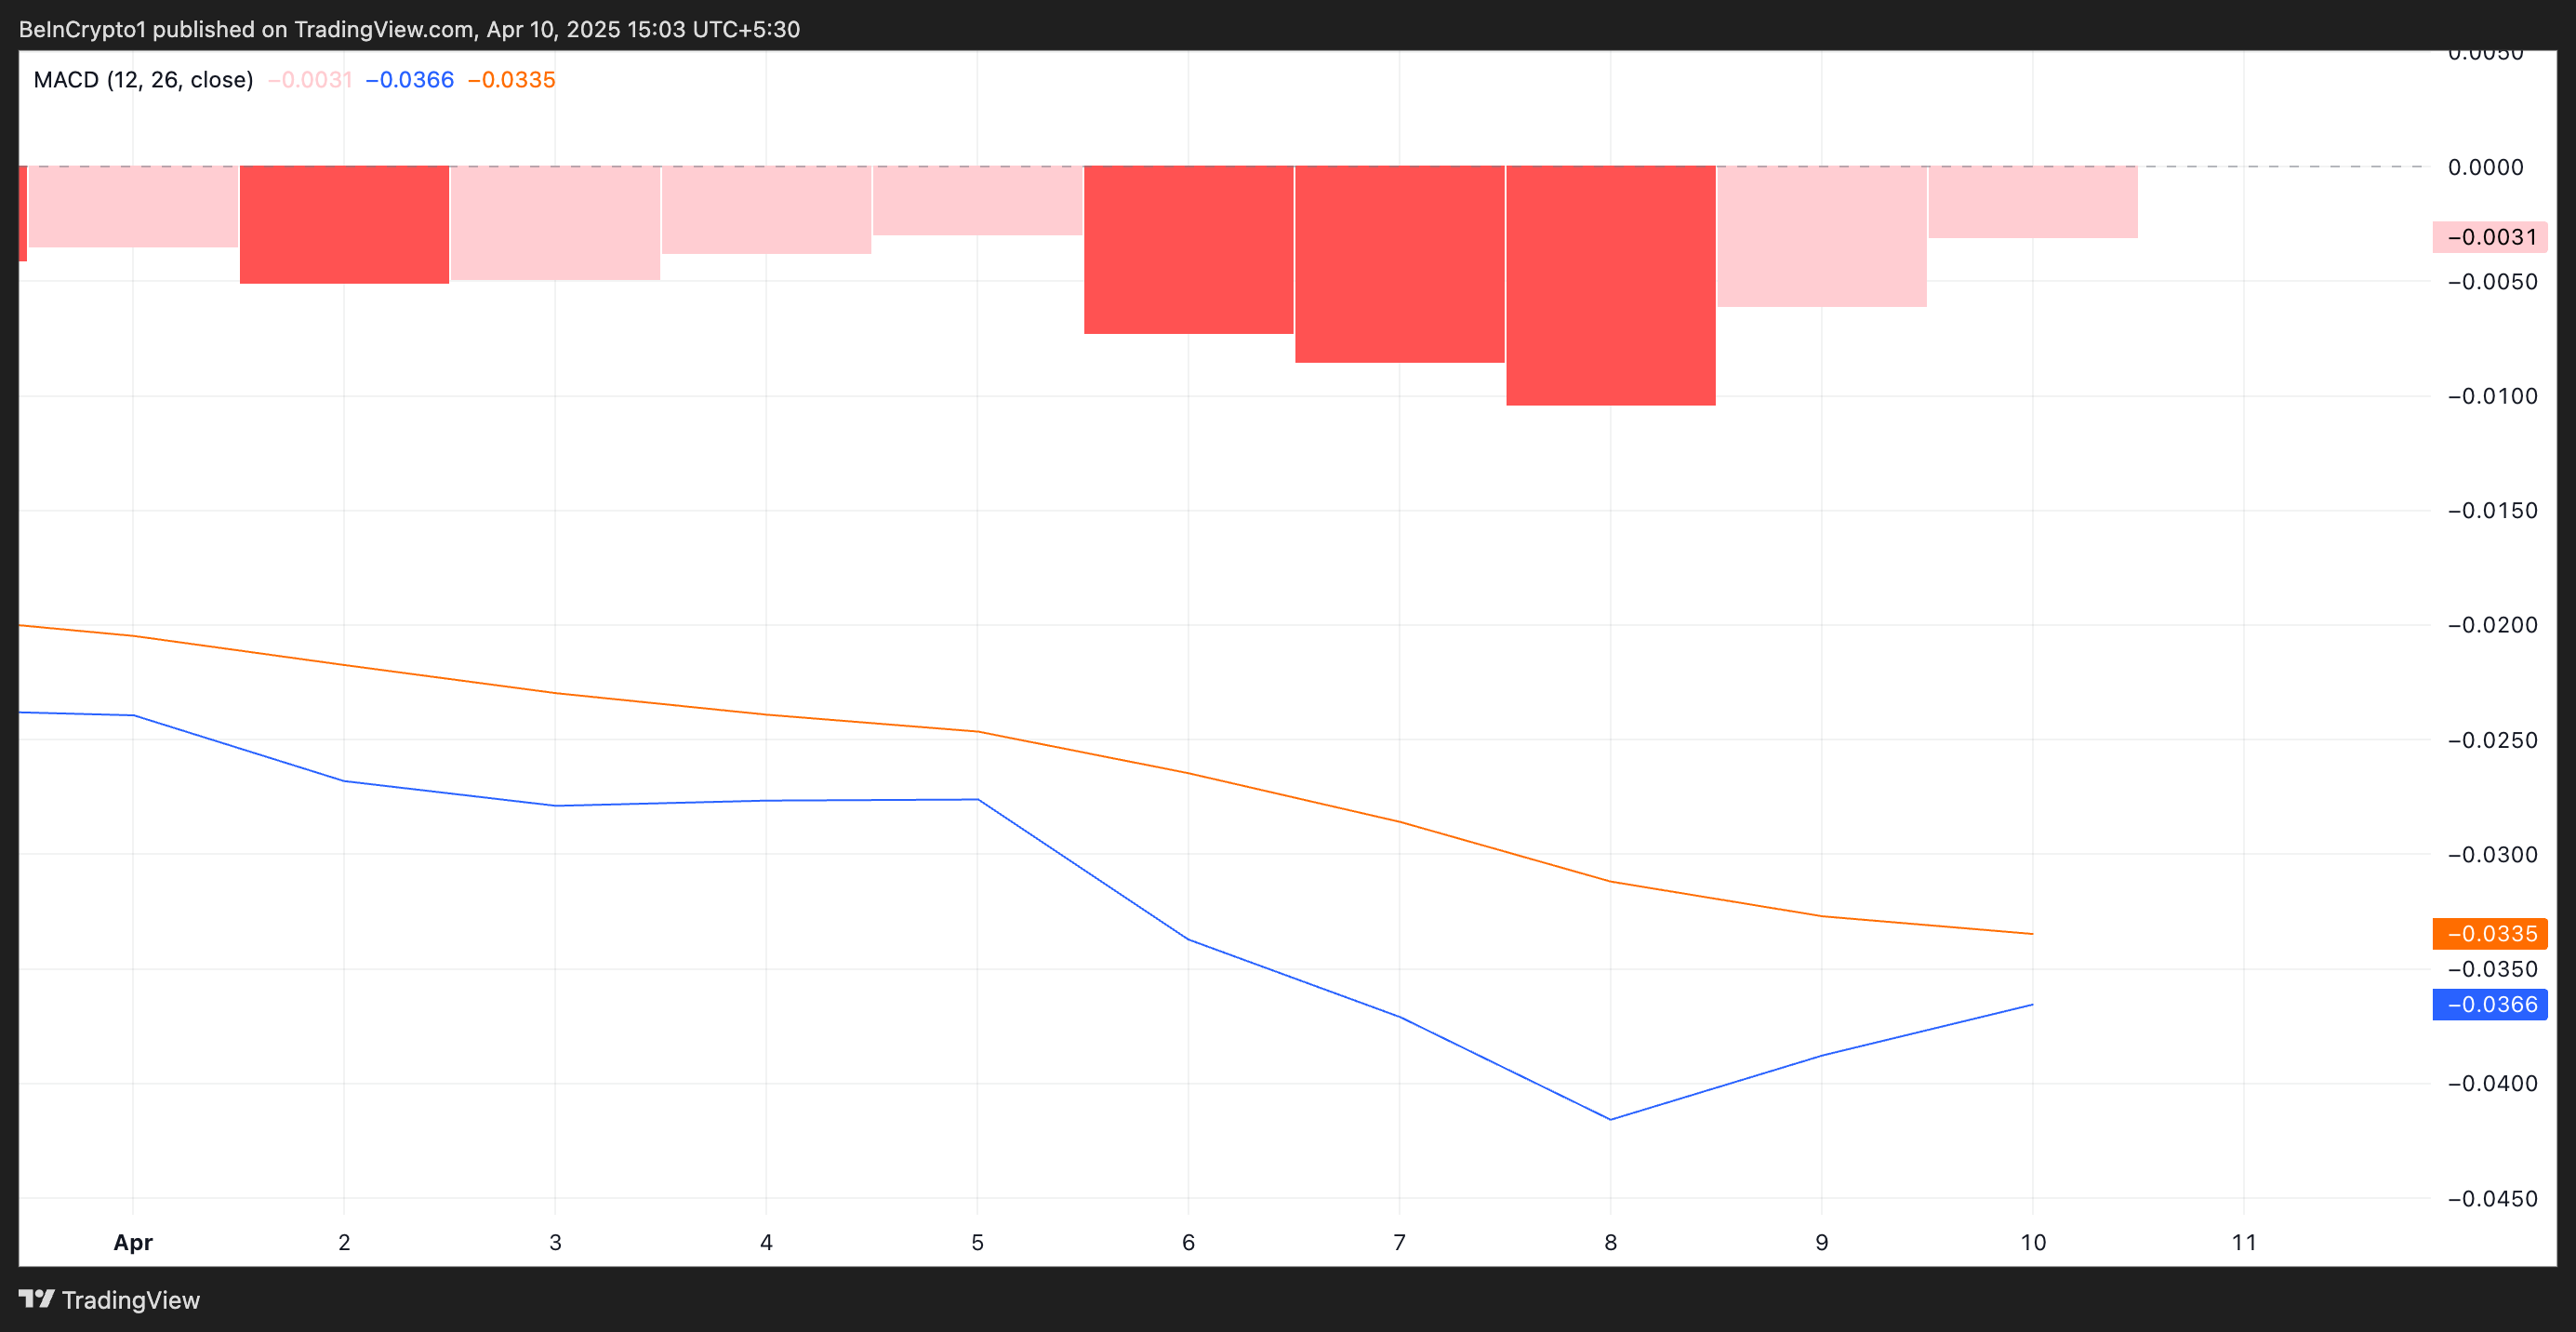
This suggests that ADA’s short-term price strength is increasing, which, if confirmed, could lead to a sustained price rally.
Cardano Bulls Eye $0.76 as Buying Pressure Mounts
A combined reading of these bullish signals reflects strong buying pressure behind ADA, with traders potentially anticipating a breakout. If momentum continues to build, ADA could soon challenge and surpass the resistance level at $0.64.
A break above this barrier may open the door for an extended rally, especially if broader market sentiment remains supportive. In that case, the coin’s price could reach $0.76.
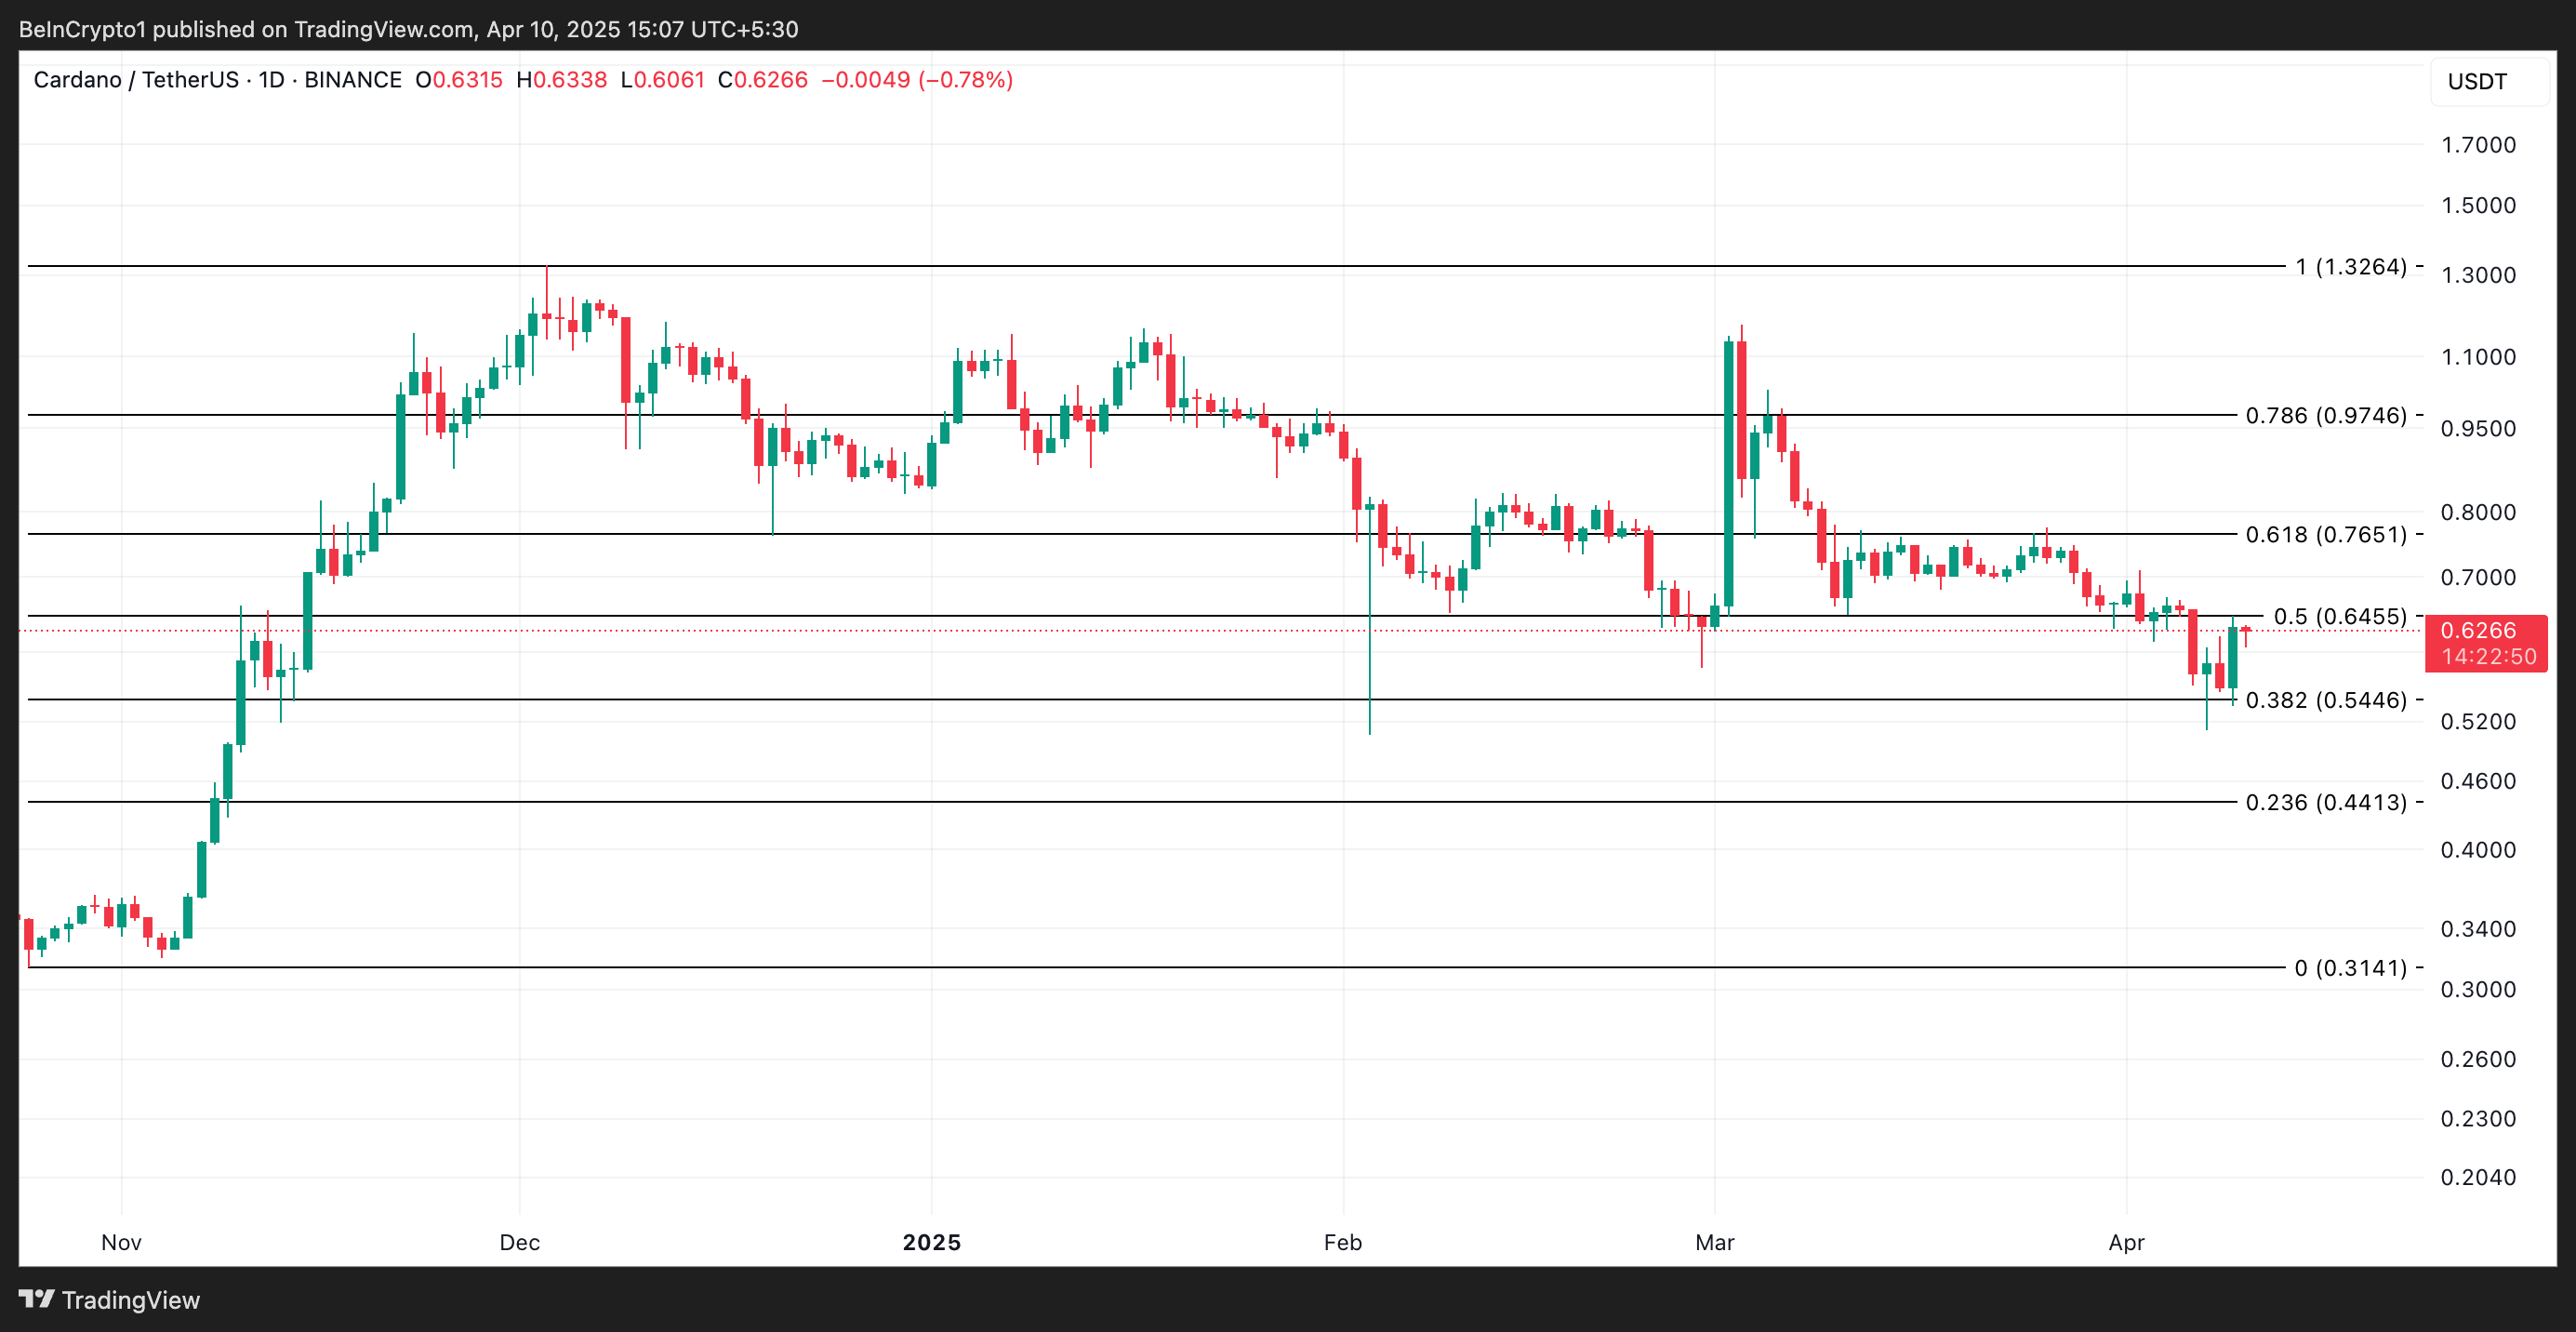
On the other hand, if ADA loses its bullish momentum, it could drop to $0.54.
Disclaimer
In line with the Trust Project guidelines, this price analysis article is for informational purposes only and should not be considered financial or investment advice. BeInCrypto is committed to accurate, unbiased reporting, but market conditions are subject to change without notice. Always conduct your own research and consult with a professional before making any financial decisions. Please note that our Terms and Conditions, Privacy Policy, and Disclaimers have been updated.

Hedera (HBAR) has recovered over 5% in the past week. Despite some corrections today, multiple technical indicators flash bullish signals, suggesting a potential shift in momentum.
The DMI shows buyers firmly in control, the Ichimoku Cloud has flipped bullish, and a golden cross appears close to forming on the EMA lines. With key resistance levels approaching, HBAR could be gearing up for an extended move—if the current momentum holds.
HBAR DMI Shows Buyers Are In Full Control
Hedera’s DMI chart is showing signs of strengthening trend momentum, with the ADX (Average Directional Index) rising to 24.17 from 21.82 just a day ago.
The ADX measures the strength of a trend regardless of its direction. Readings above 25 typically indicate a strong trend, while values between 20 and 25 suggest a trend may be developing.
With the ADX nearing that threshold, Hedera could be preparing for a more decisive move if momentum continues building.
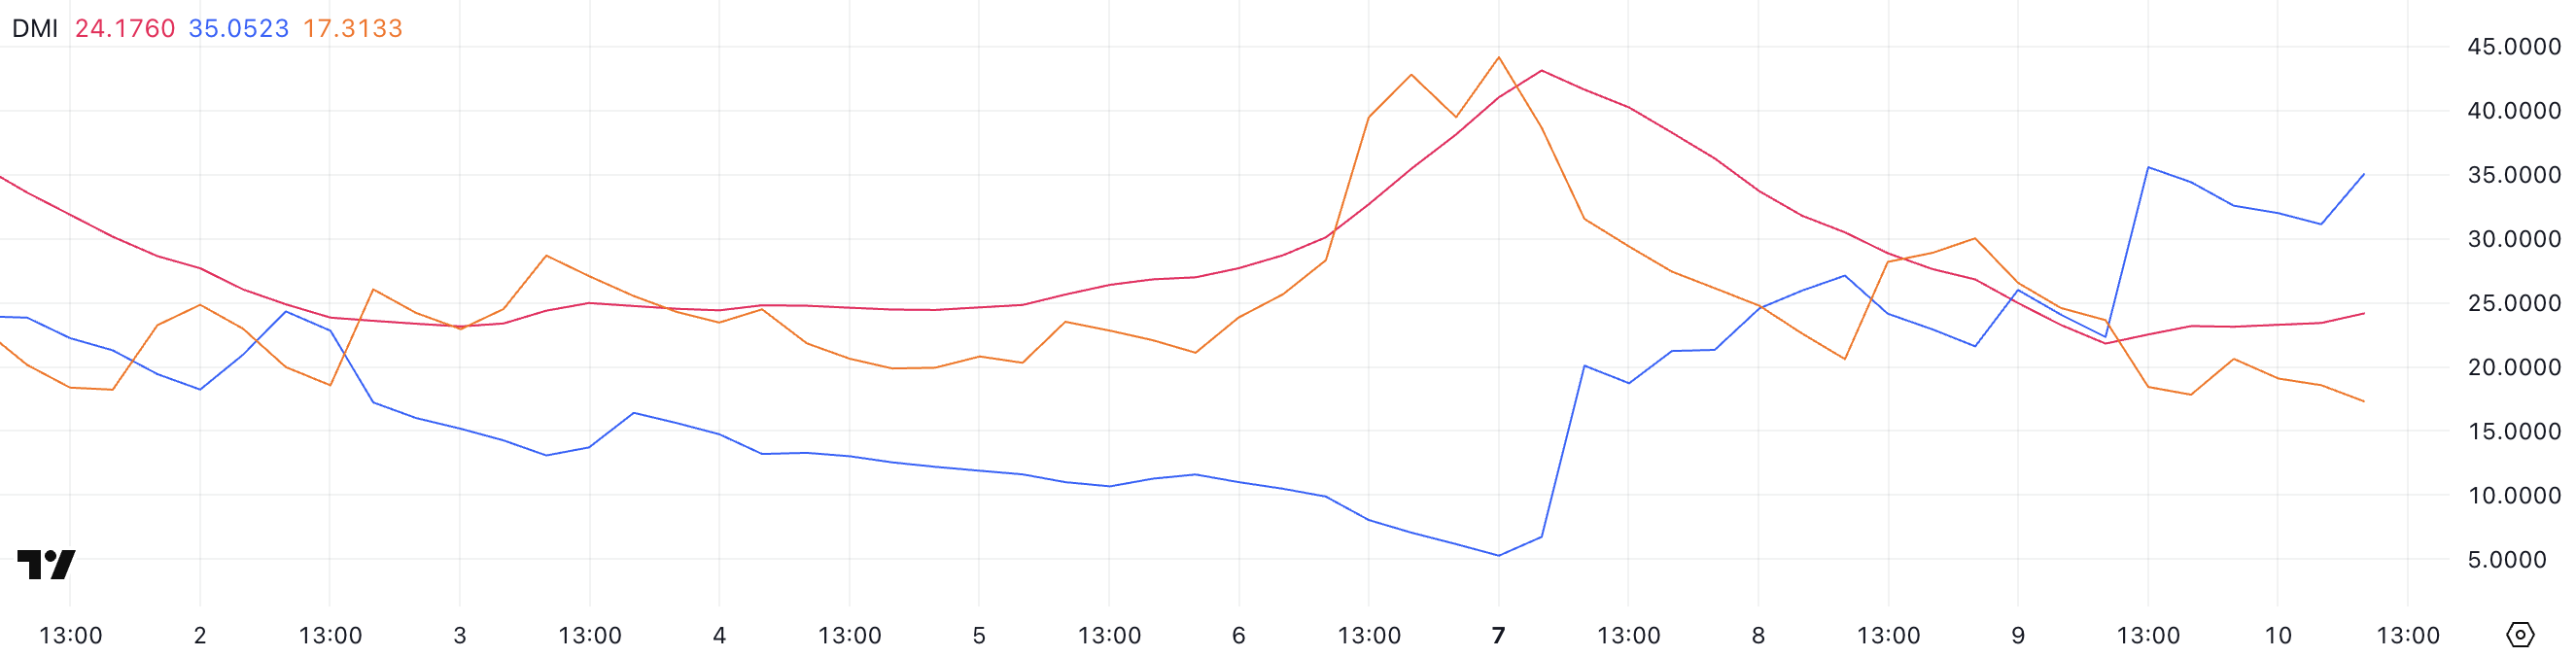
Looking at the directional indicators, the +DI has surged to 35.05 from 22.33, while the -DI has dropped to 17.31 from 23.65. This widening gap between the bullish and bearish pressure signals a strong shift in favor of buyers.
If this setup holds, it could indicate a developing uptrend for HBAR, especially if the ADX continues to climb above 25.
The combination of rising bullish momentum and weakening selling pressure is a positive technical signal, suggesting that Hedera may be gearing up for further upside in the short term.
Hedera Ichimoku Cloud Shows A Bullish Setup
Hedera’s Ichimoku Cloud chart is flashing a bullish signal. After a strong move upward, price action broke above the red cloud (Kumo).
This breakout places the candles above both the Tenkan-sen (blue line) and the Kijun-sen (red line), which is generally seen as a sign of bullish momentum and short-term trend strength.
The cloud ahead has also started to thin, suggesting that resistance may be weakening. If momentum holds, further upside is more achievable.
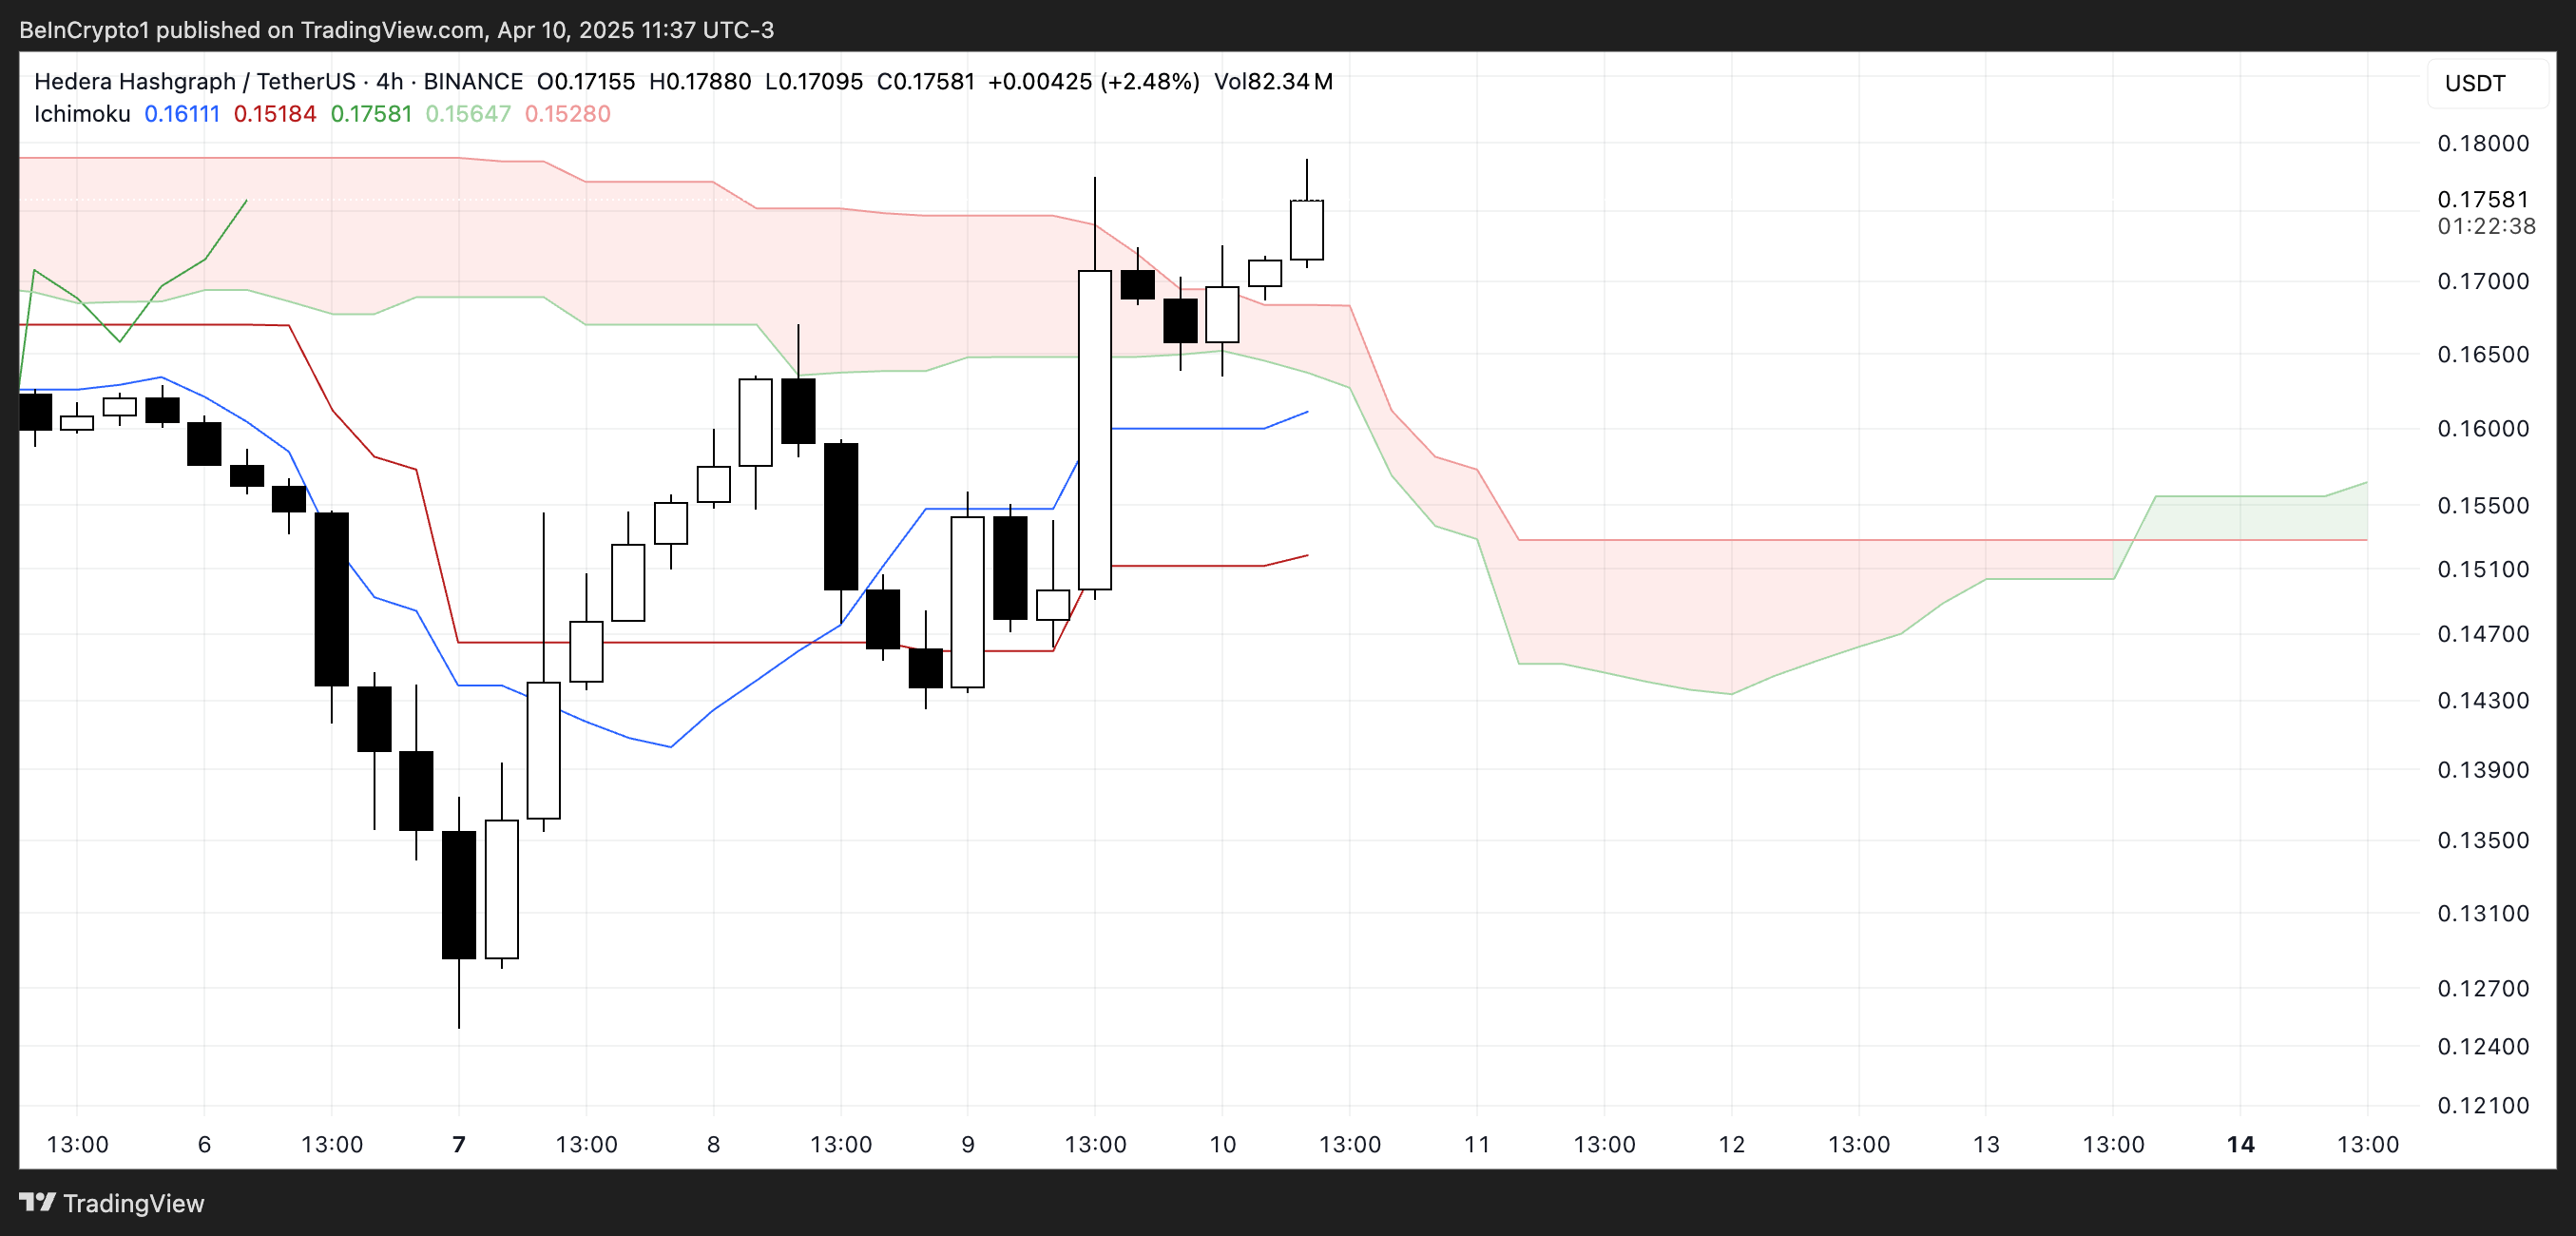
The Chikou Span (lagging green line) is now positioned above the price candles and the cloud, reinforcing the bullish bias. However, with the cloud still showing a mostly flat and narrow structure, the current trend doesn’t yet show strong continuation signals.
If the price remains above the cloud and the Tenkan-sen continues to lead above the Kijun-sen, Hedera could sustain this upward trajectory.
But traders should watch closely for any signs of a reversal back into or below the cloud, which would weaken the bullish setup.
Hedera Could Surge Soon If The Golden Cross Emerges
Hedera’s EMA lines are tightening, signaling a potential breakout. A golden cross—where short-term EMAs move above long-term ones—appears to be forming, which would typically indicate a bullish trend reversal.
If confirmed, this setup could push Hedera price toward resistance levels at $0.18 and $0.20, and if the momentum holds, even higher targets like $0.21 and $0.258 may come into play.
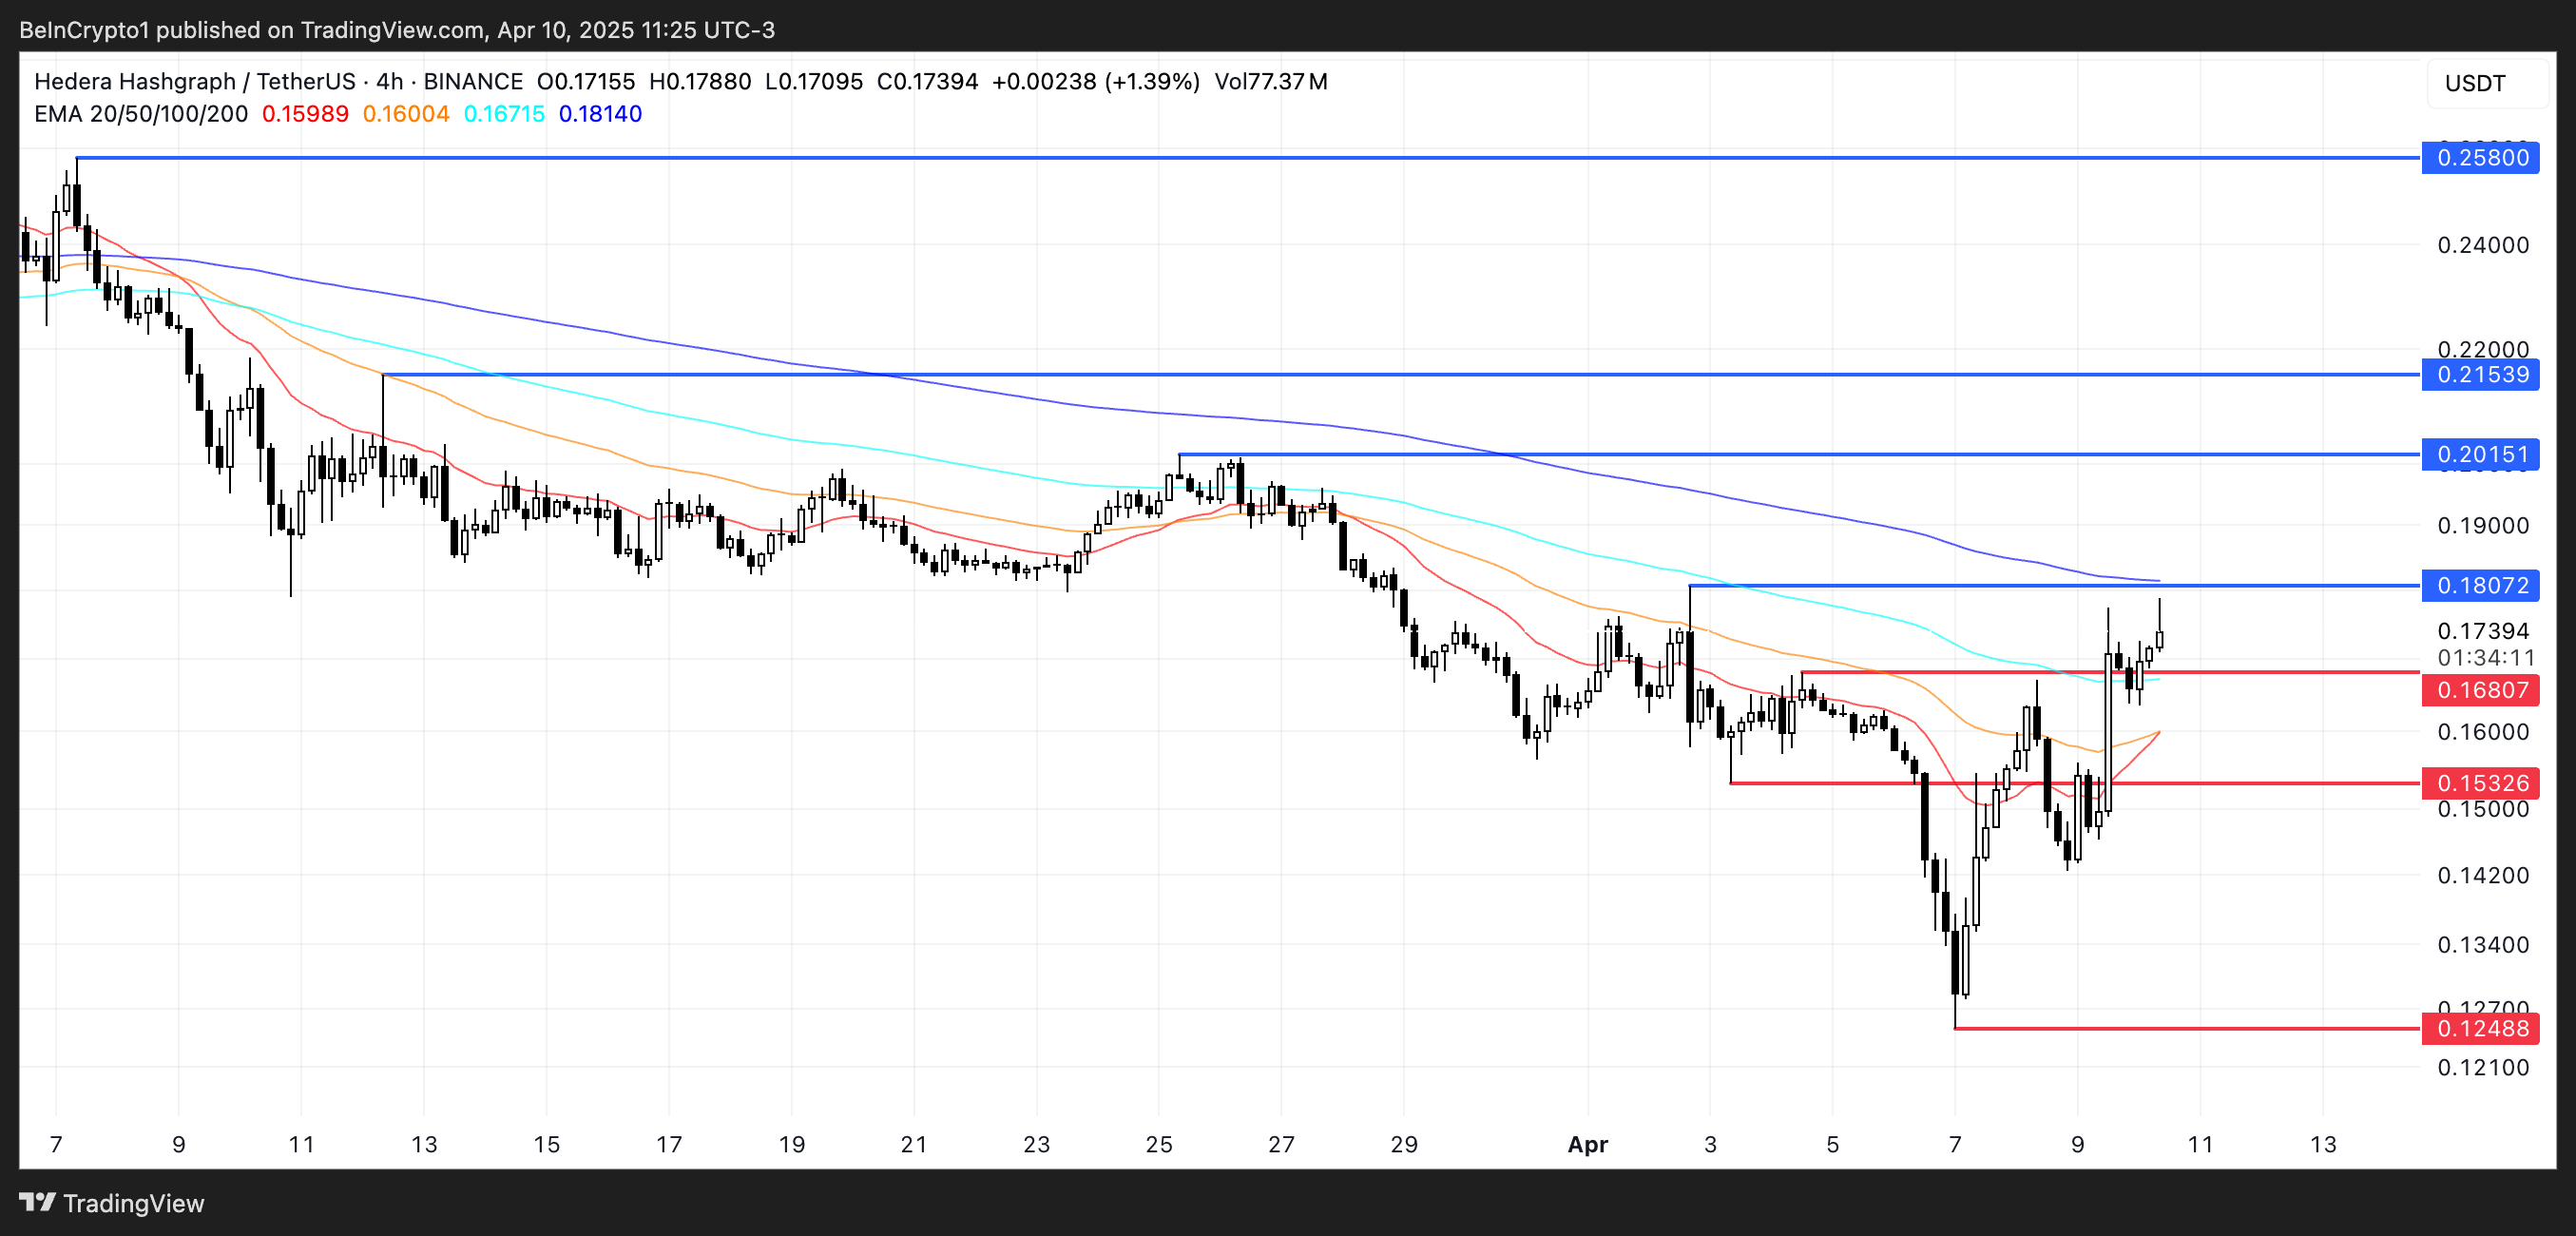
However, this bullish scenario hinges on a successful break above the immediate resistance. If HBAR fails to clear the $0.18 level, it could trigger a pullback toward the support at $0.168.
Losing that support would likely expose Hedera to further downside. The next key levels are $0.153 and possibly below $0.13 if selling pressure intensifies.
Disclaimer
In line with the Trust Project guidelines, this price analysis article is for informational purposes only and should not be considered financial or investment advice. BeInCrypto is committed to accurate, unbiased reporting, but market conditions are subject to change without notice. Always conduct your own research and consult with a professional before making any financial decisions. Please note that our Terms and Conditions, Privacy Policy, and Disclaimers have been updated.

Altcoins are showing fresh signs of life following Trump’s 90-day tariff pause, and three names in particular—XRP, HYPE, and ONDO—are catching investor attention.
Each has its own catalyst: XRP is getting a regulatory boost with Paul Atkins taking over the SEC, HYPE is defying the broader market downturn with impressive protocol revenue, and ONDO is riding the wave of rising institutional interest in Real-World Assets (RWA).
XRP
XRP fell sharply in the past month, losing 34% and dropping below $1.70 for the first time since November 2024. The decline came as macro uncertainty and regulatory pressure weighed on sentiment.
However, with Trump’s 90-day tariff pause and Paul Atkins confirmed as the new, pro-crypto SEC Chair, optimism is starting to return.
These developments could give XRP the regulatory breathing room it needs to regain momentum as one of the top-performing altcoins.
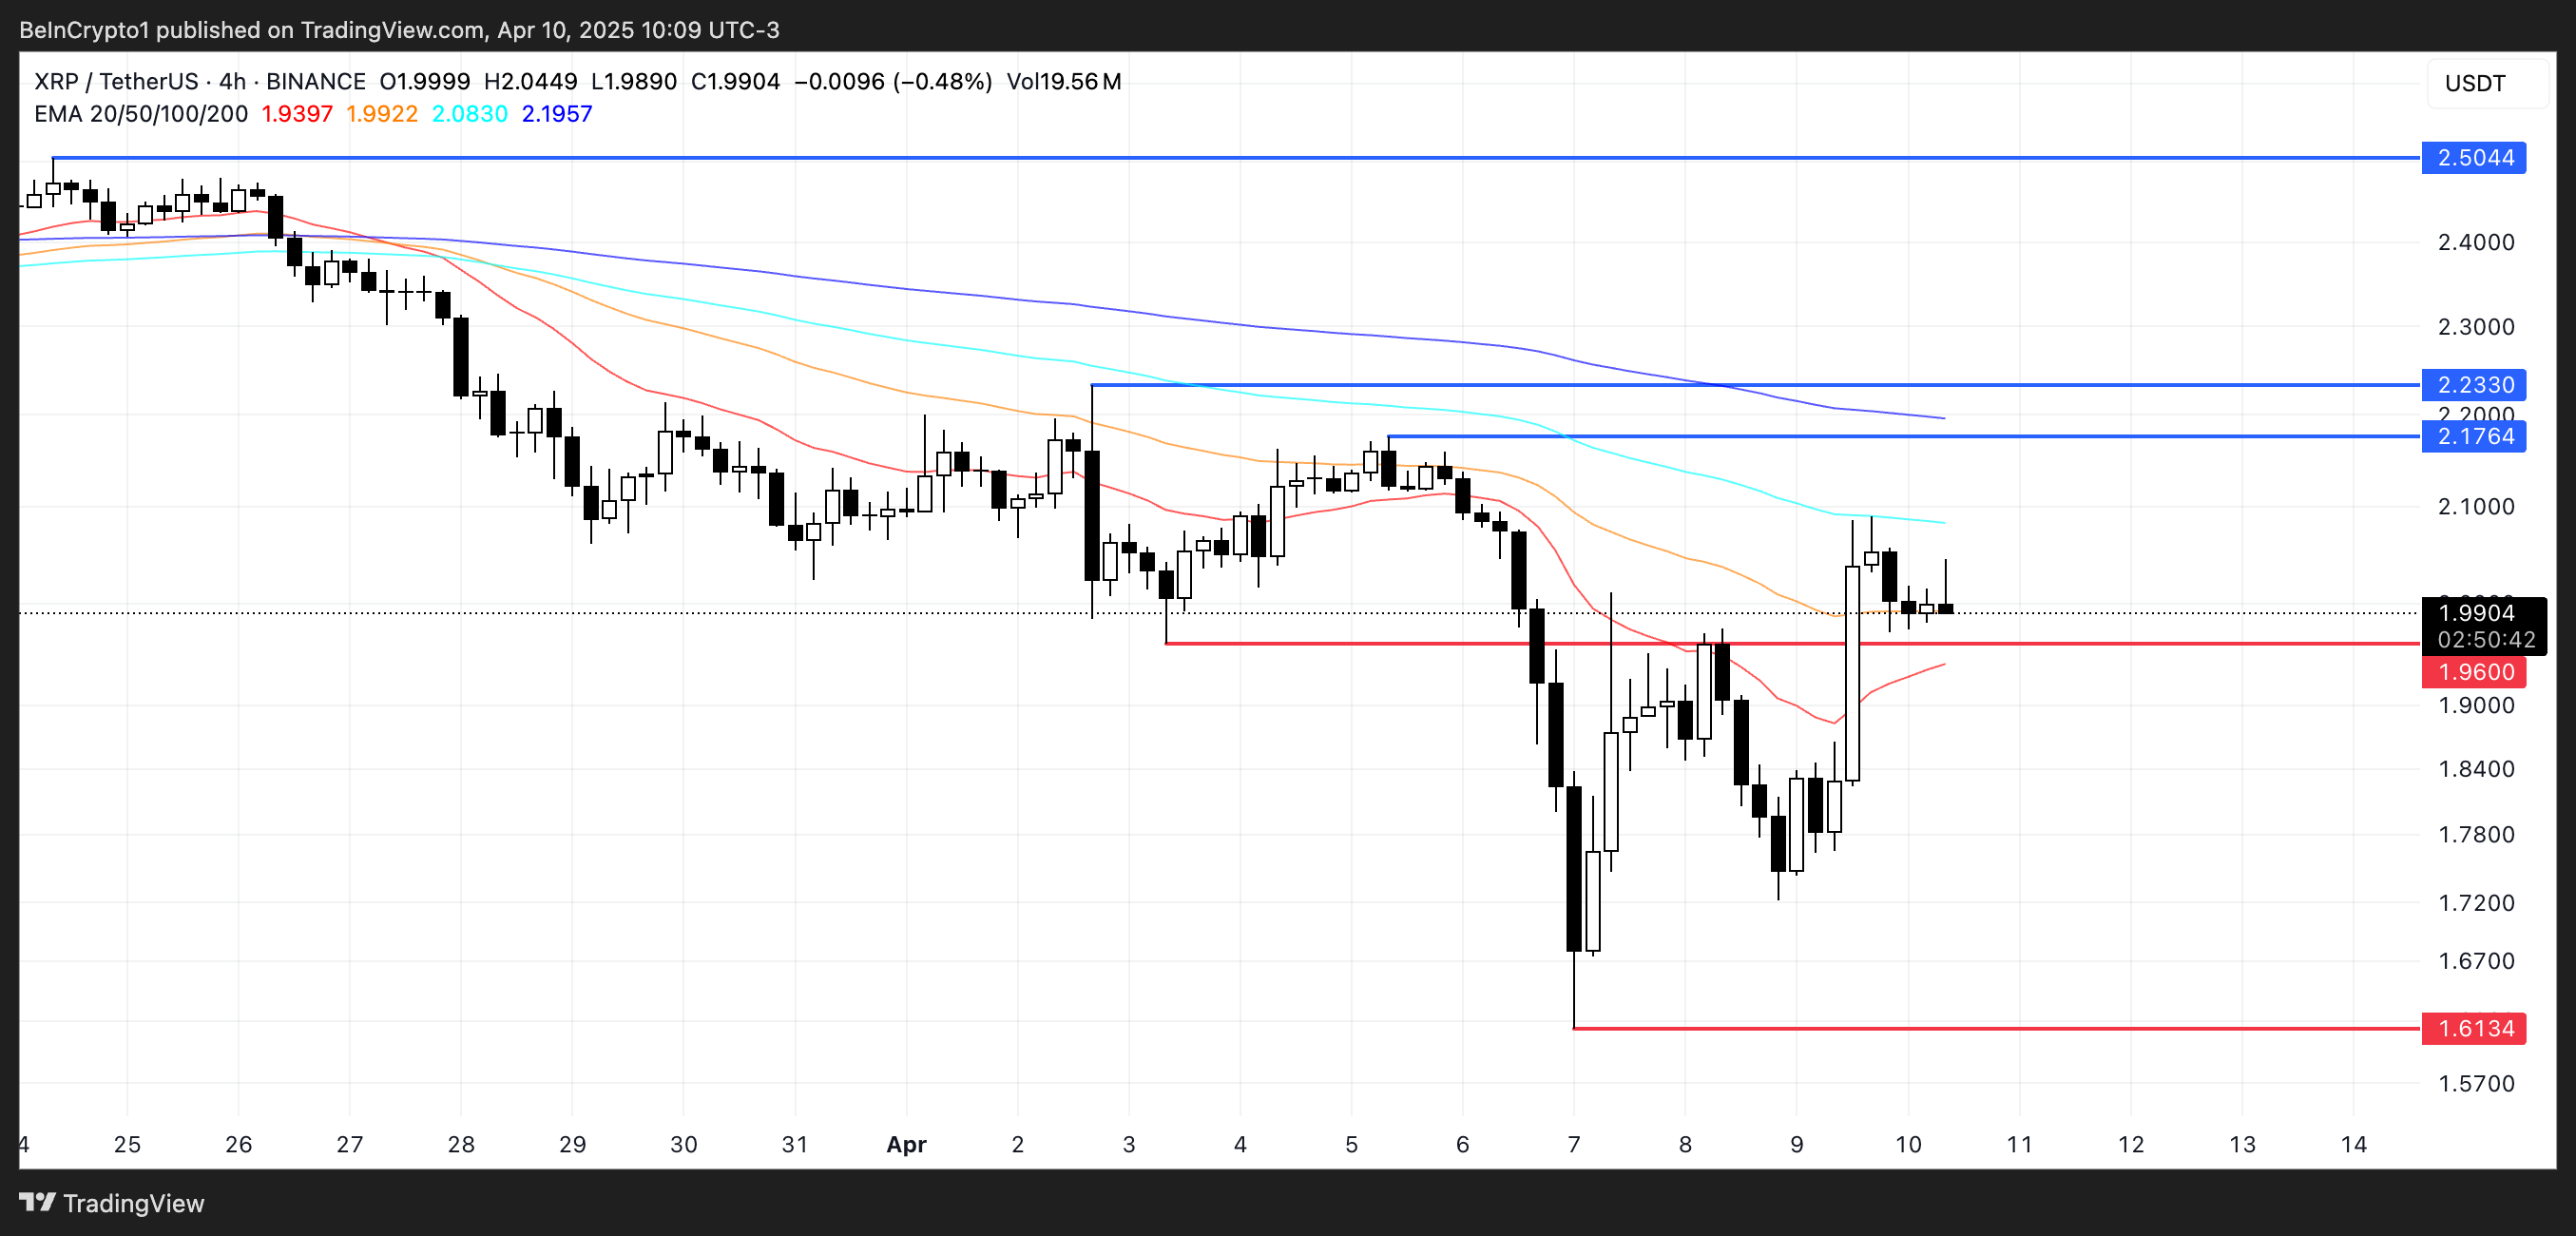
If that shift materializes, XRP may retest resistance at $2.17 and $2.23.
A break above those levels could set the stage for a push toward $2.50. Standard Chartered has even suggested XRP could overtake Ethereum by 2028, and Ripple’s acquisition of Hidden Road has fueled new expectations for rising institutional demand.
Still, holding $1.96 as support is key—if that level fails, a drop back toward sub-$1.70 lows remains possible.
Hyperliquid (HYPE)
HYPE has climbed 21.5% over the past week, defying the broader altcoin market downturn. The rally comes despite lingering criticism of the platform following the JELLY crisis, which raised concerns about Hyperliquid’s stability.
Still, traders seem to be regaining confidence, especially as the macro backdrop improves after Trump’s 90-day tariff pause.
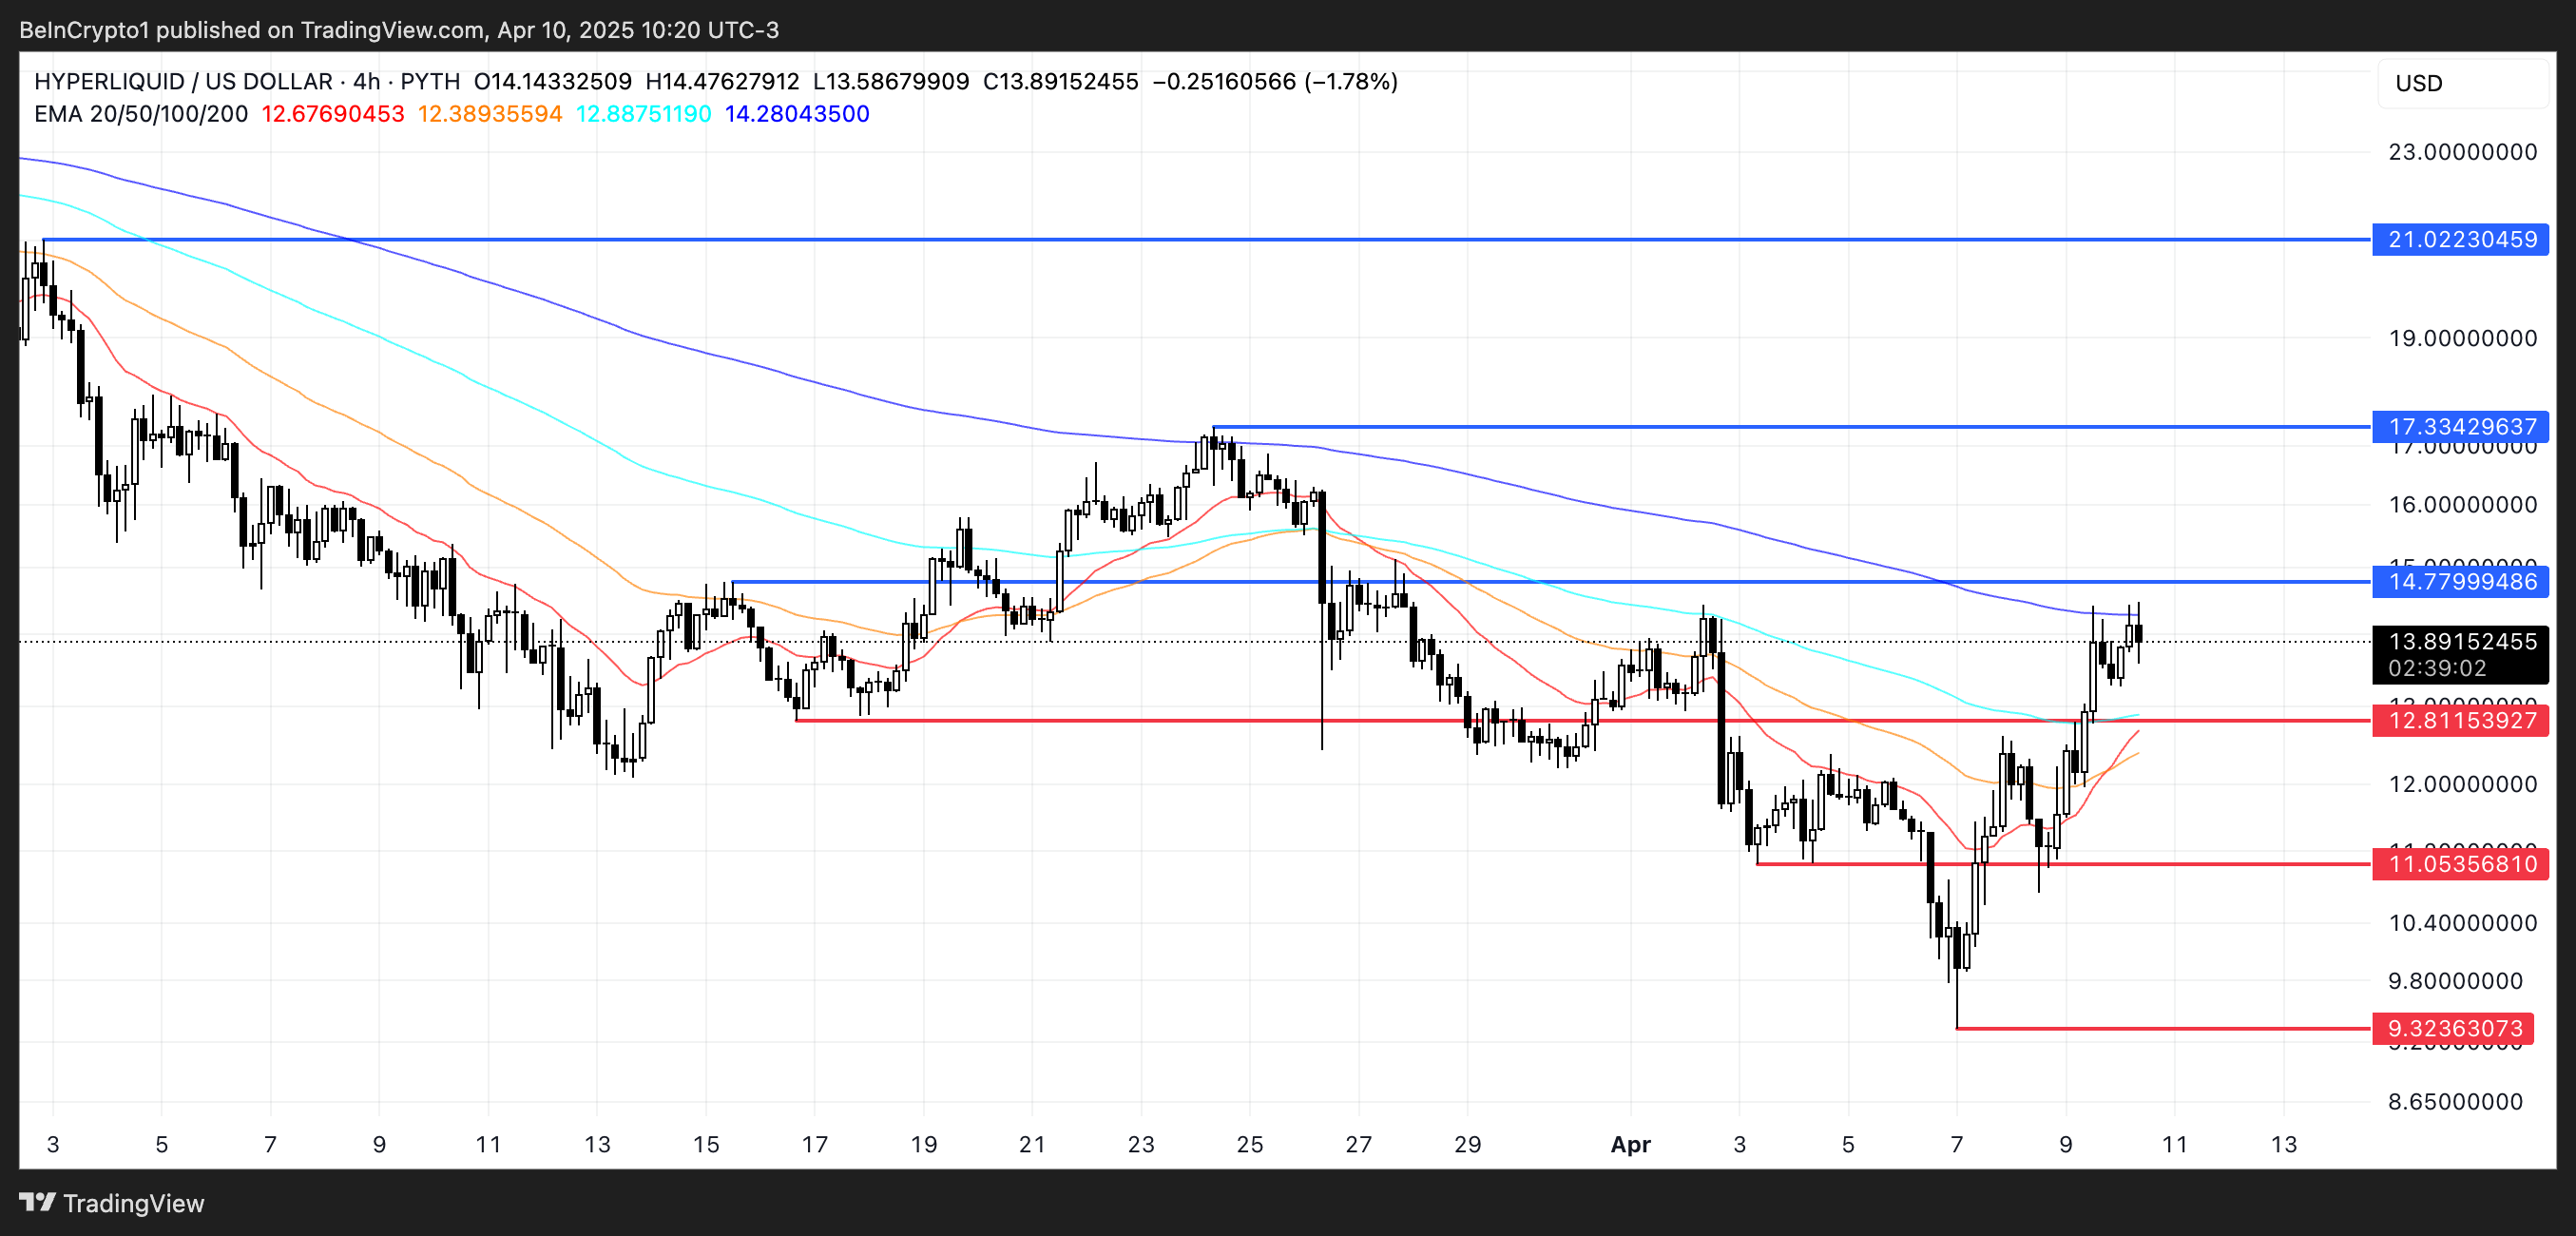
Hyperliquid remains a powerhouse in terms of protocol revenue, pulling in $38 million in fees over the past month—$2.4 million of that in just the last 24 hours—ranking it 6th globally, ahead of names like PancakeSwap and Tron.
If momentum holds, HYPE could push toward resistance at $14.77, and a breakout could lead to $17.33 or even $21. But if the rally stalls support at $12.81 becomes key; losing that could send the price back to $11 or even below $10 in a deeper correction
Ondo Finance (ONDO)
Real-world asset (RWA) tokens are gaining momentum as a defensive narrative in crypto, especially in light of global economic uncertainty.
Binance Research recently stated that RWA altcoins remain safer than Bitcoin during tariff-driven volatility.
At the same time, BlackRock’s BUIDL token is nearing $1.5 billion in assets, and Fidelity has entered the RWA tokenization race—signaling growing institutional commitment to this emerging sector.
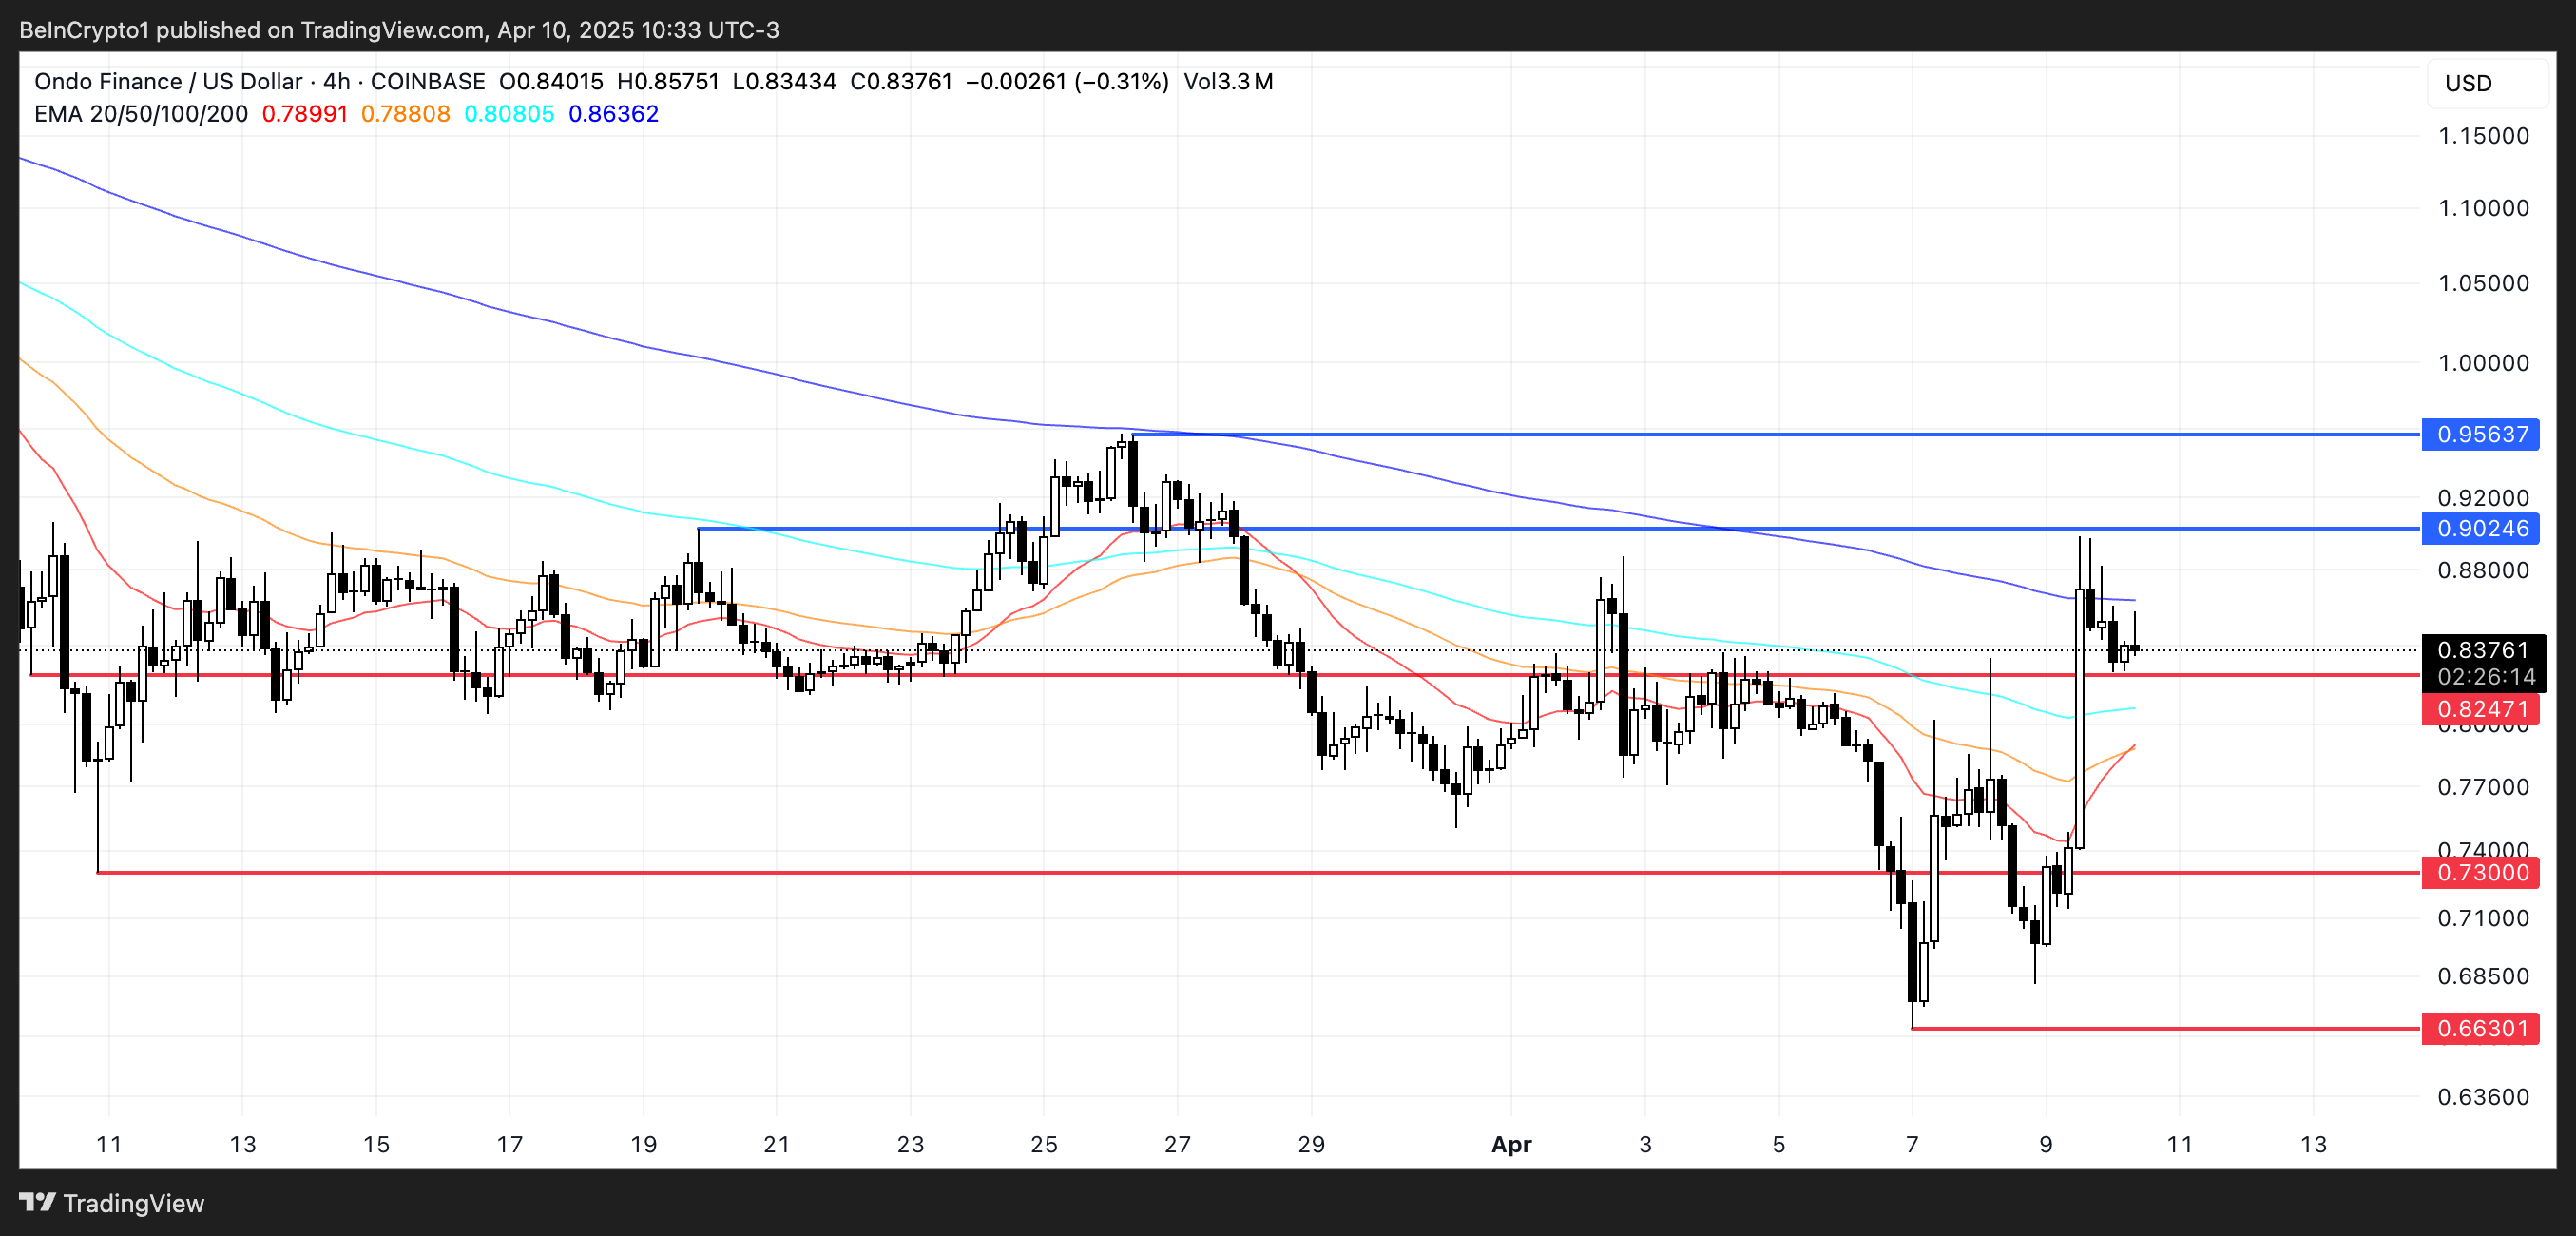
ONDO, one of the key tokens in the RWA space, is showing signs of strength on the charts, with a golden cross nearly forming.
If confirmed, ONDO could climb toward resistance levels at $0.90 and $0.95, with a breakout possibly pushing it above $1.
However, the price is hovering just above a key support at $0.82. If that level fails, the next downside target is $0.73, with a deeper slide potentially taking it below $0.70.
Disclaimer
In line with the Trust Project guidelines, this price analysis article is for informational purposes only and should not be considered financial or investment advice. BeInCrypto is committed to accurate, unbiased reporting, but market conditions are subject to change without notice. Always conduct your own research and consult with a professional before making any financial decisions. Please note that our Terms and Conditions, Privacy Policy, and Disclaimers have been updated.

ADA Price Surge Signals a Potential Breakout

Bitcoin Holders are More Profitable Than Ethereum Since 2023

Is Donald Trump’s World Liberty Finance Behind The Crash To $1,400?

Hedera (HBAR) Jumps 14%—More Gains Ahead?

3 Bullish Altcoins Surging After Trump’s Tariff Pause

This is Why Hoskinson Thinks Bitcoin Will Hit $250,000 in 2025

2.52 Million Altcoins Are Ruining Crypto’s Future

Animoca Brands Valuation Tanks 75% In Two Years, Here’s Why

Crypto exchange BingX hacked for $43 million

Are The Big Players Losing Interest?

Hong Kong’s Securities Association Tips Authorities On Crypto Self-Regulation

Coinbase cbBTC Set to go Live on Solana
2.52 Million Altcoins Are Ruining Crypto’s Future
Animoca Brands Valuation Tanks 75% In Two Years, Here’s Why
Crypto exchange BingX hacked for $43 million
Are The Big Players Losing Interest?
Hong Kong’s Securities Association Tips Authorities On Crypto Self-Regulation
Coinbase cbBTC Set to go Live on Solana
-
 Bitcoin21 hours ago
MicroStrategy Bitcoin Dump Rumors Circulate After SEC Filing
-
 Market21 hours ago
XRP Primed for a Comeback as Key Technical Signal Hints at Explosive Move
-

 Market23 hours ago
FBI Ran Dark Web Money Laundering to Track Crypto Criminals
-

 Market17 hours ago
Bitcoin Rallies After Trump Pauses Tariff—Crypto Markets Cheer the Move
-

 Ethereum23 hours ago
Ethereum Traders Pulling Back? ETH’s Open Interest On Binance Sees Continued Decline
-

 Market22 hours ago
SEC Approves Ethereum ETF Options Trading After Delays
-
 Regulation21 hours ago
US Senate Confirms Pro-Crypto Paul Atkins As SEC Chair
-

 Market20 hours ago
Paul Atkins Confirmed as SEC Chair, Crypto Rules to Ease