
Market
Ethereum Price Rallies on Fed Cut, But ETF Investors Cash Out

The Federal Reserve’s latest rate cut has sent Ethereum (ETH) soaring. Trading at $2,428 as of this writing, the altcoin’s value has spiked by over 5% in the past 24 hours.
However, it seems not everyone is celebrating. Ethereum spot exchange-traded funds (ETFs) experienced outflows yesterday despite the price surge.
Ethereum ETF Holders Remove Their Funds
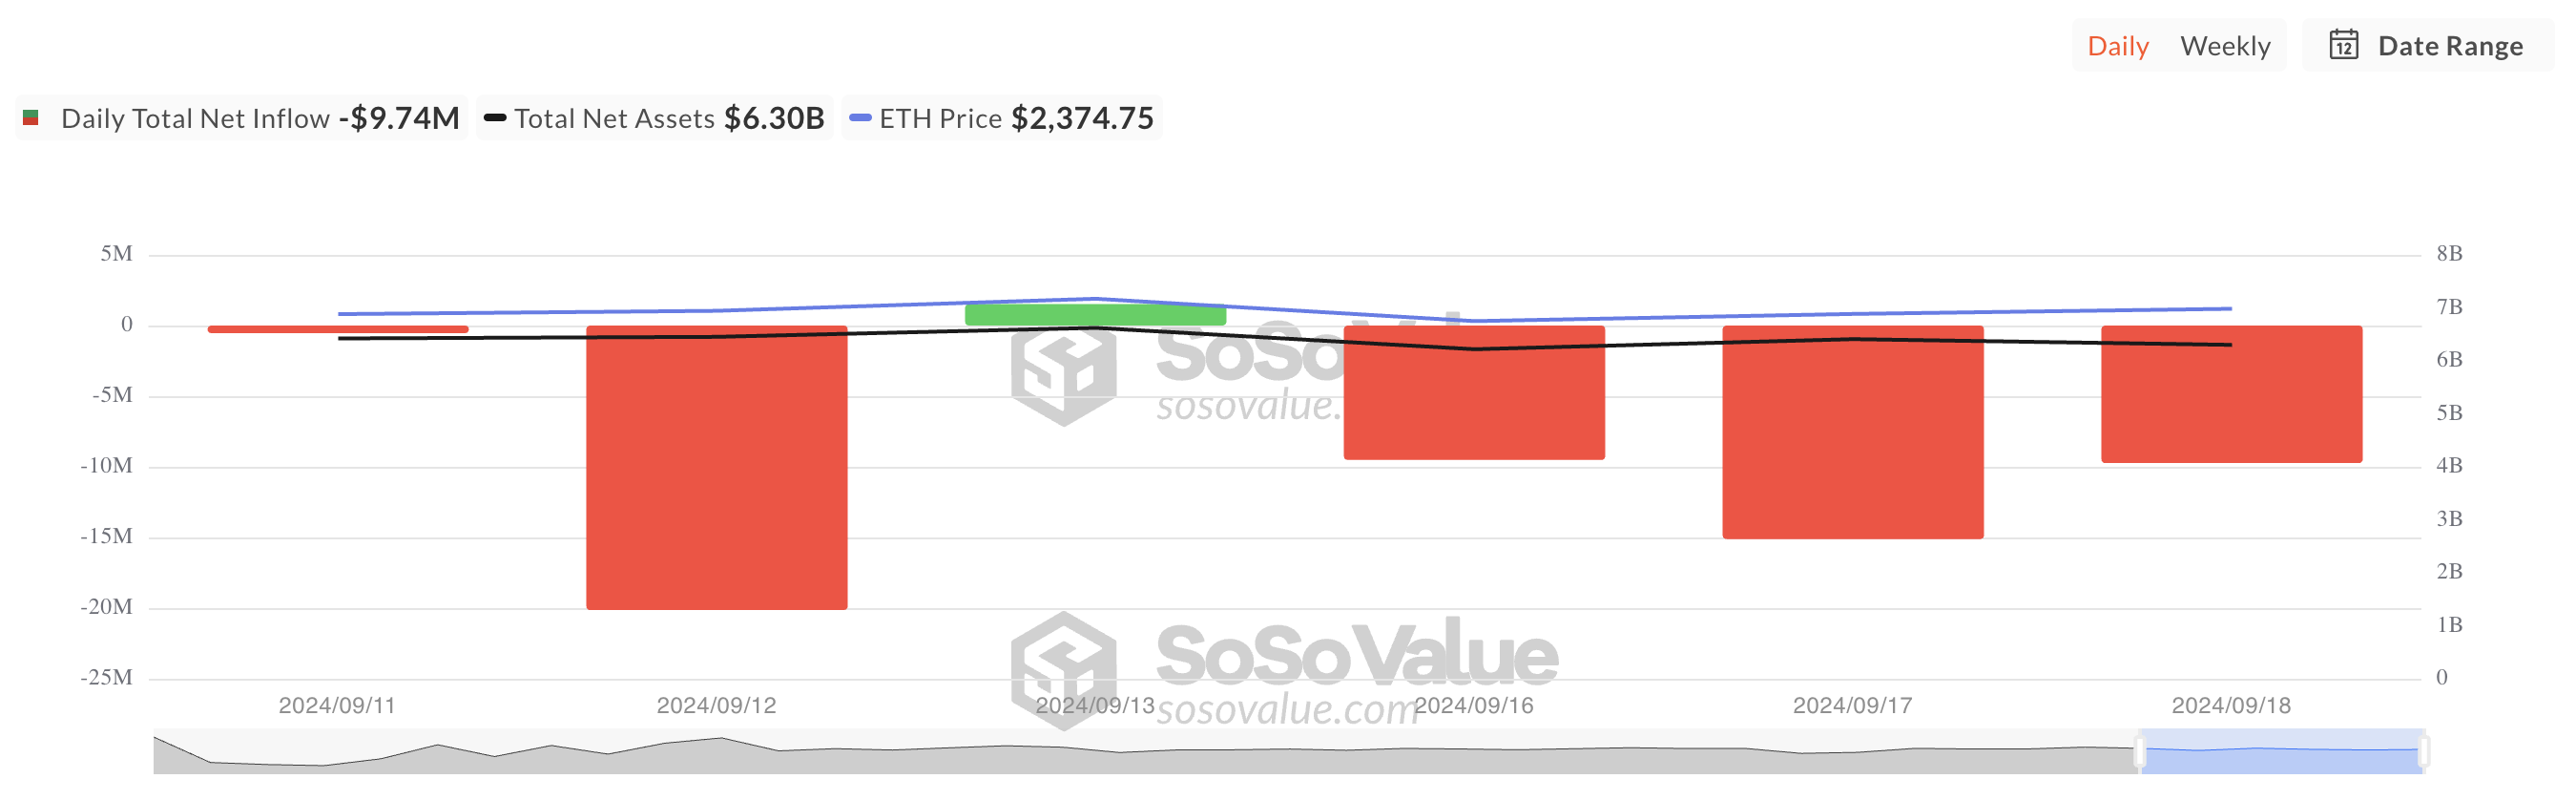
According to data from SosoValue, ETH spot ETFs recorded a net outflow of $9.74 million on Wednesday, bringing the week’s total outflows to $30.36 million. This funds removal occurred despite the broader market rally witnessed after the Federal Reserve cut interest rates by 50 basis points, its first reduction since early 2020.
This could be attributed to several factors. ETH’s price increase in the past 24 hours may have led ETF holders to sell their shares for profit. Additionally, the recent rate cut might have encouraged some investors to hold ETH directly.
Lower interest rates typically foster a more risk-on sentiment, making investors more inclined to take on riskier assets, such as ETH, in hopes of securing higher returns.
Read more: How to Invest in Ethereum ETFs?
The surge in ETH’s trading volume over the past 24 hours confirms that its price hike is backed by sufficient demand from market participants. Totaling $21 billion during that period, it’s up by 29% in the past 24 hours.
Additionally, in Ethereum’s derivatives market, open interest — representing the total number of active futures or options contracts — has surged by 8% in the same period. This increase signals that more traders are entering the market and opening new positions rather than closing existing ones.
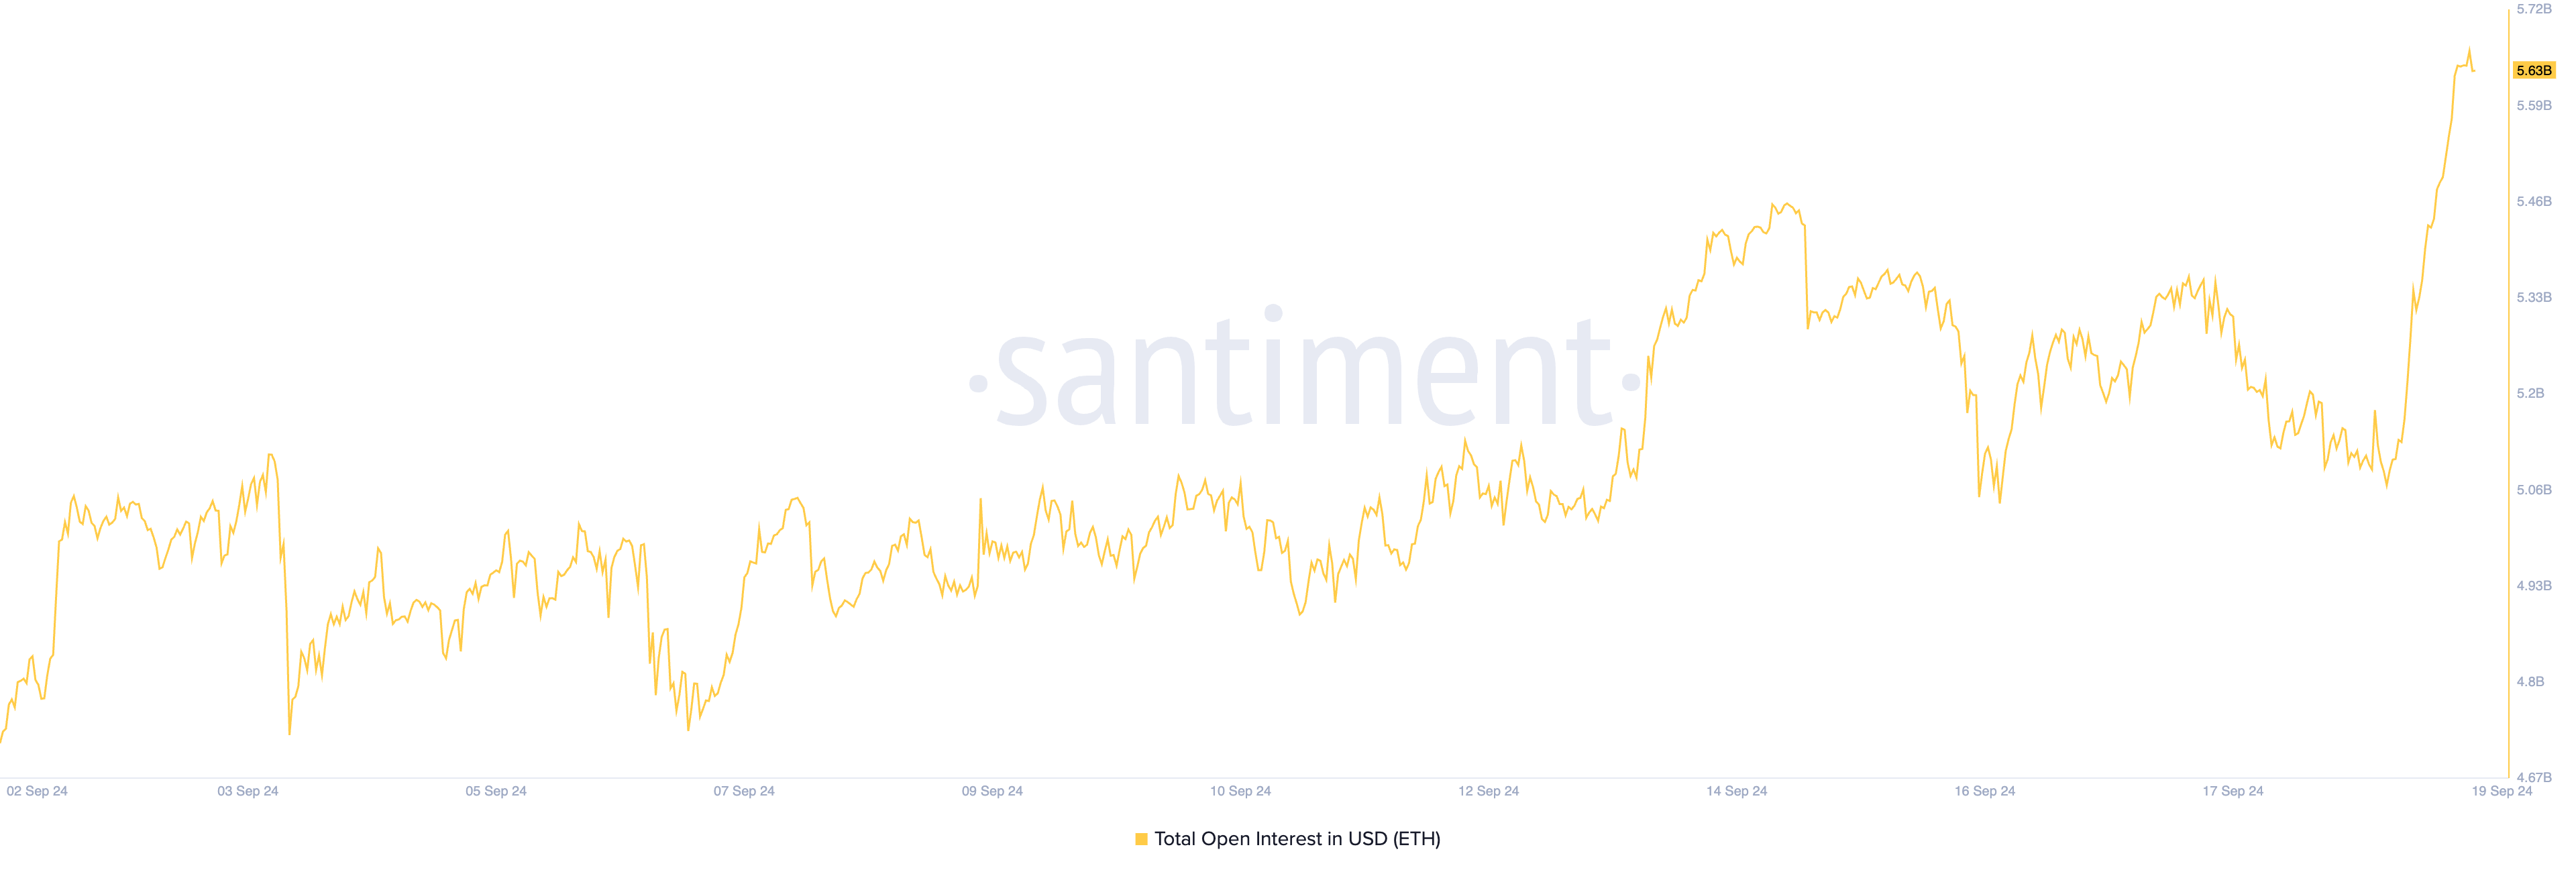
The combination of Ethereum’s price rally and rising open interest suggests that the uptrend is gaining momentum, with new buyers fueling the market.
ETH Price Prediction: Coin Must Cross Key Moving Average
Ethereum’s price, as seen on the one-day chart, shows it is on track to break above its 20-day exponential moving average (EMA), which tracks its average price over the past 20 trading days.
If buying pressure continues, Ethereum could rally past this key level. A break above the 20-day EMA often indicates strengthening short-term momentum, signaling the start of an uptrend or the continuation of an existing one. If the uptrend holds, Ethereum’s price could breach $2,579 and aim for the crucial support level at $2,868.
Read more: Ethereum (ETH) Price Prediction 2024/2025/2030
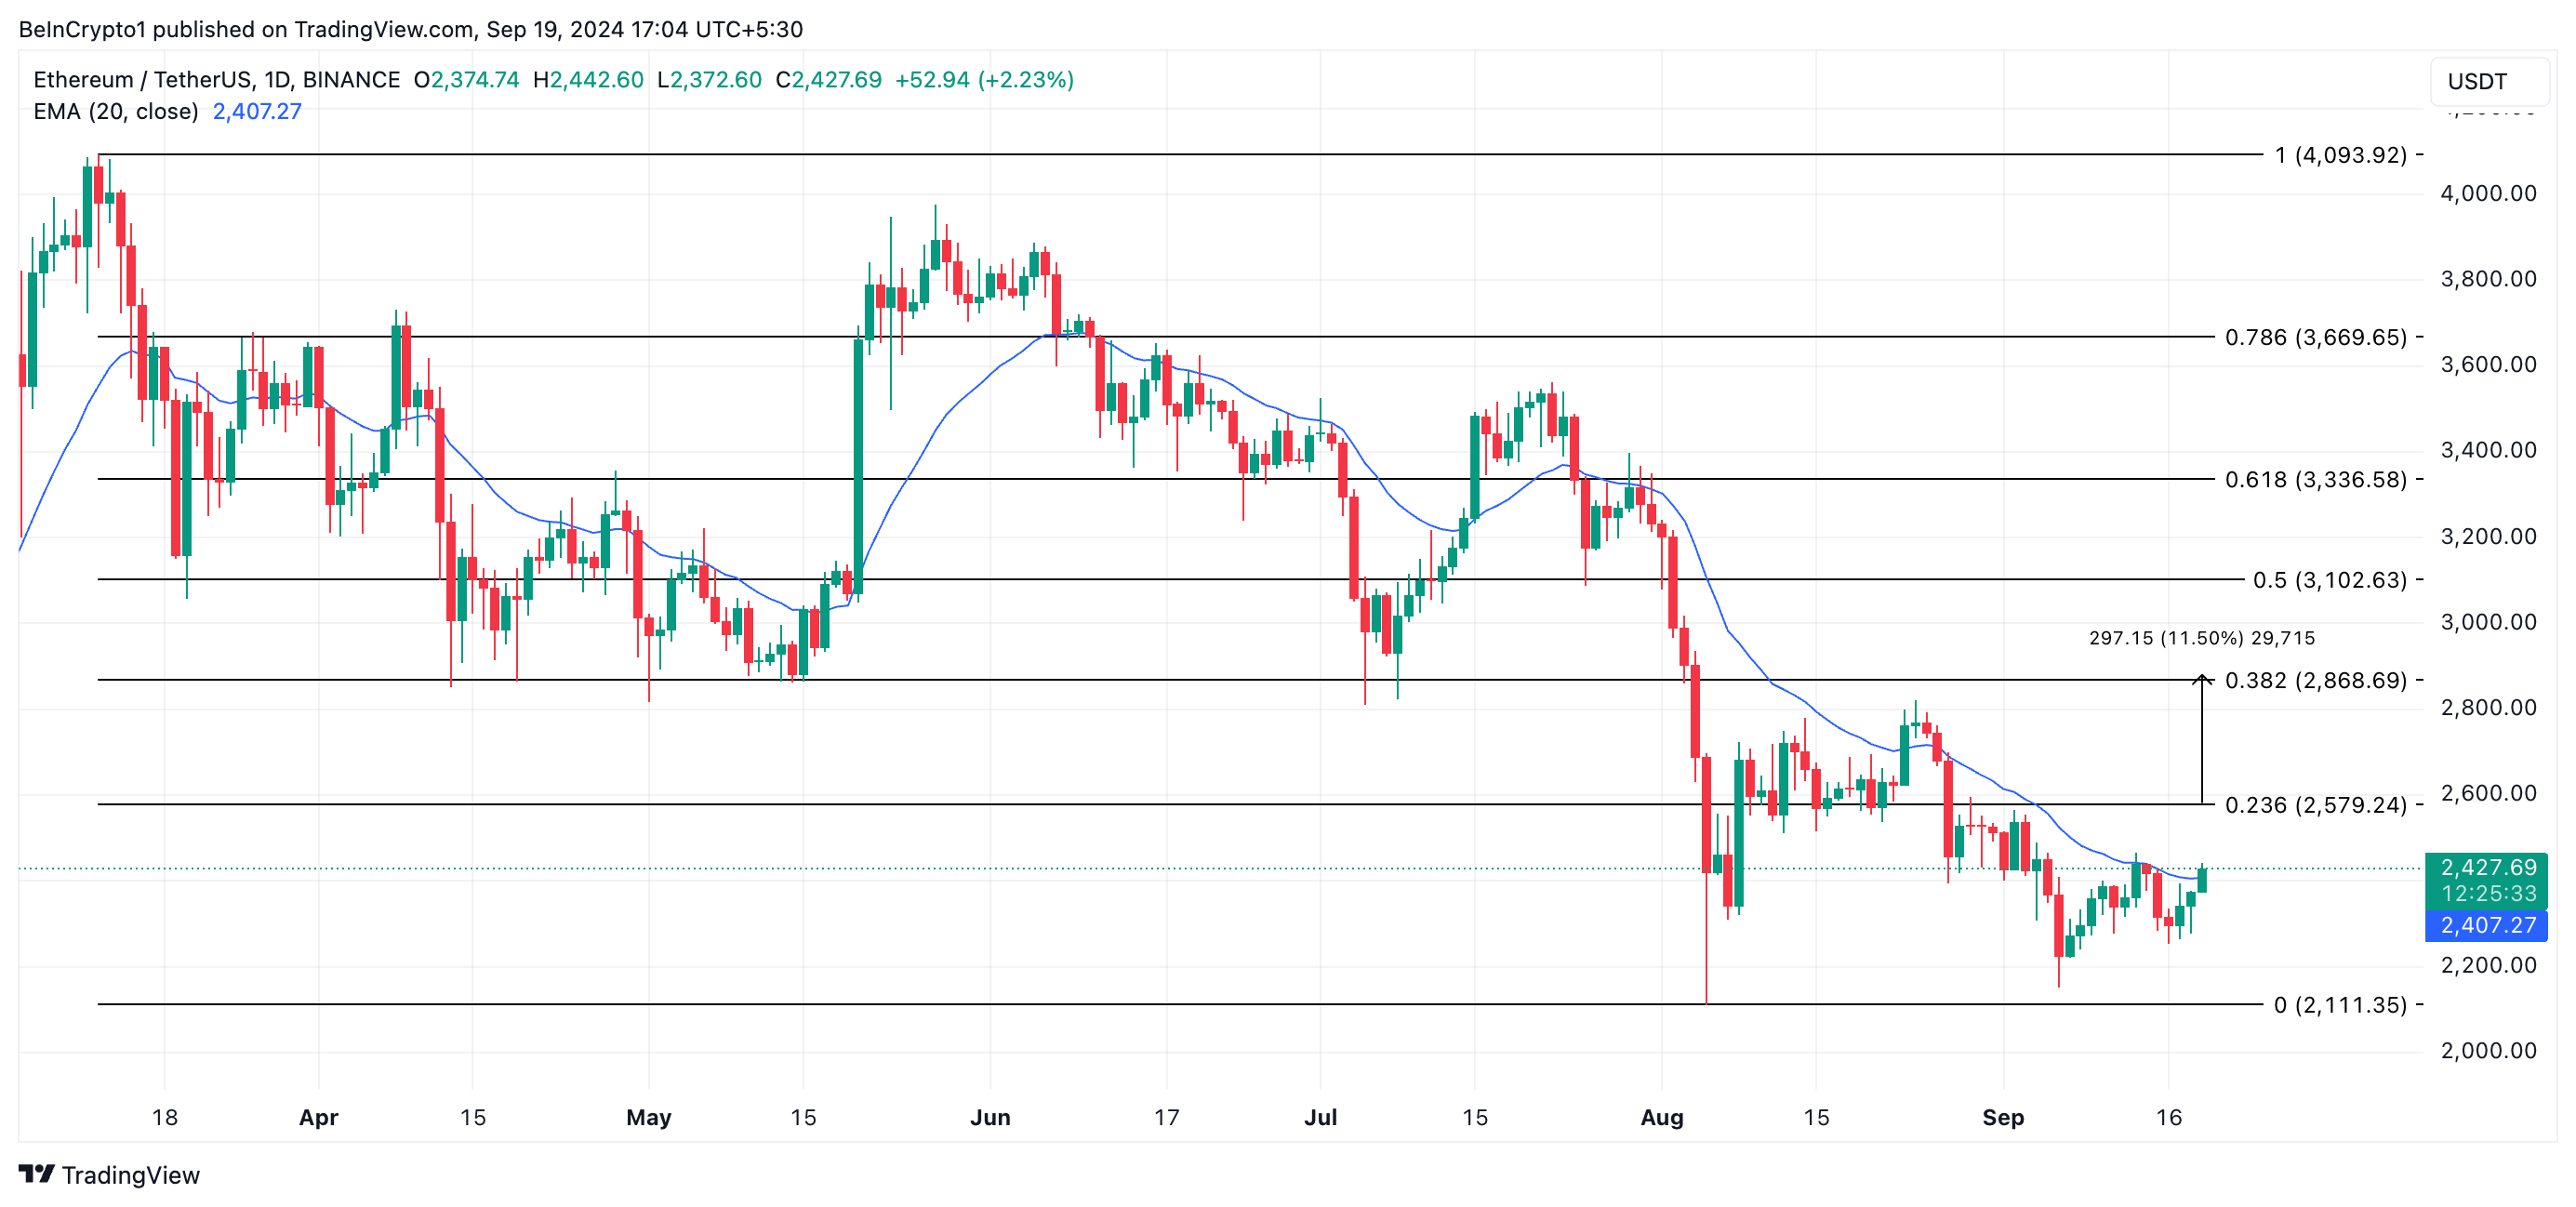
However, if buying pressure weakens and selling intensifies, Ethereum’s price may dip below the 20-day EMA and move toward $2,111.
Disclaimer
In line with the Trust Project guidelines, this price analysis article is for informational purposes only and should not be considered financial or investment advice. BeInCrypto is committed to accurate, unbiased reporting, but market conditions are subject to change without notice. Always conduct your own research and consult with a professional before making any financial decisions. Please note that our Terms and Conditions, Privacy Policy, and Disclaimers have been updated.


The crypto market is finally improving, and that too at a steady pace, which is imbuing investors with confidence. This bullishness is also reflected in the growth of the altcoins, with some even making their way to new highs.
BeInCrypto has analyzed three such altcoins that formed a new all-time high today and whether their uptrend will continue.
Solayer (LAYER)
LAYER has surged by 23% in the last 24 hours, reaching $1.41 at the time of writing. The altcoin also reached a new all-time high (ATH) of $1.47 during the intra-day highs. This rise signals strong market interest and positive momentum for the cryptocurrency in the short term.
Given the current green candlestick, LAYER is likely to continue its upward trend. If the altcoin breaks past its ATH of $1.47, it could easily push past the $1.50 mark. This would indicate a continued bullish phase for LAYER as the price gains momentum toward higher levels.
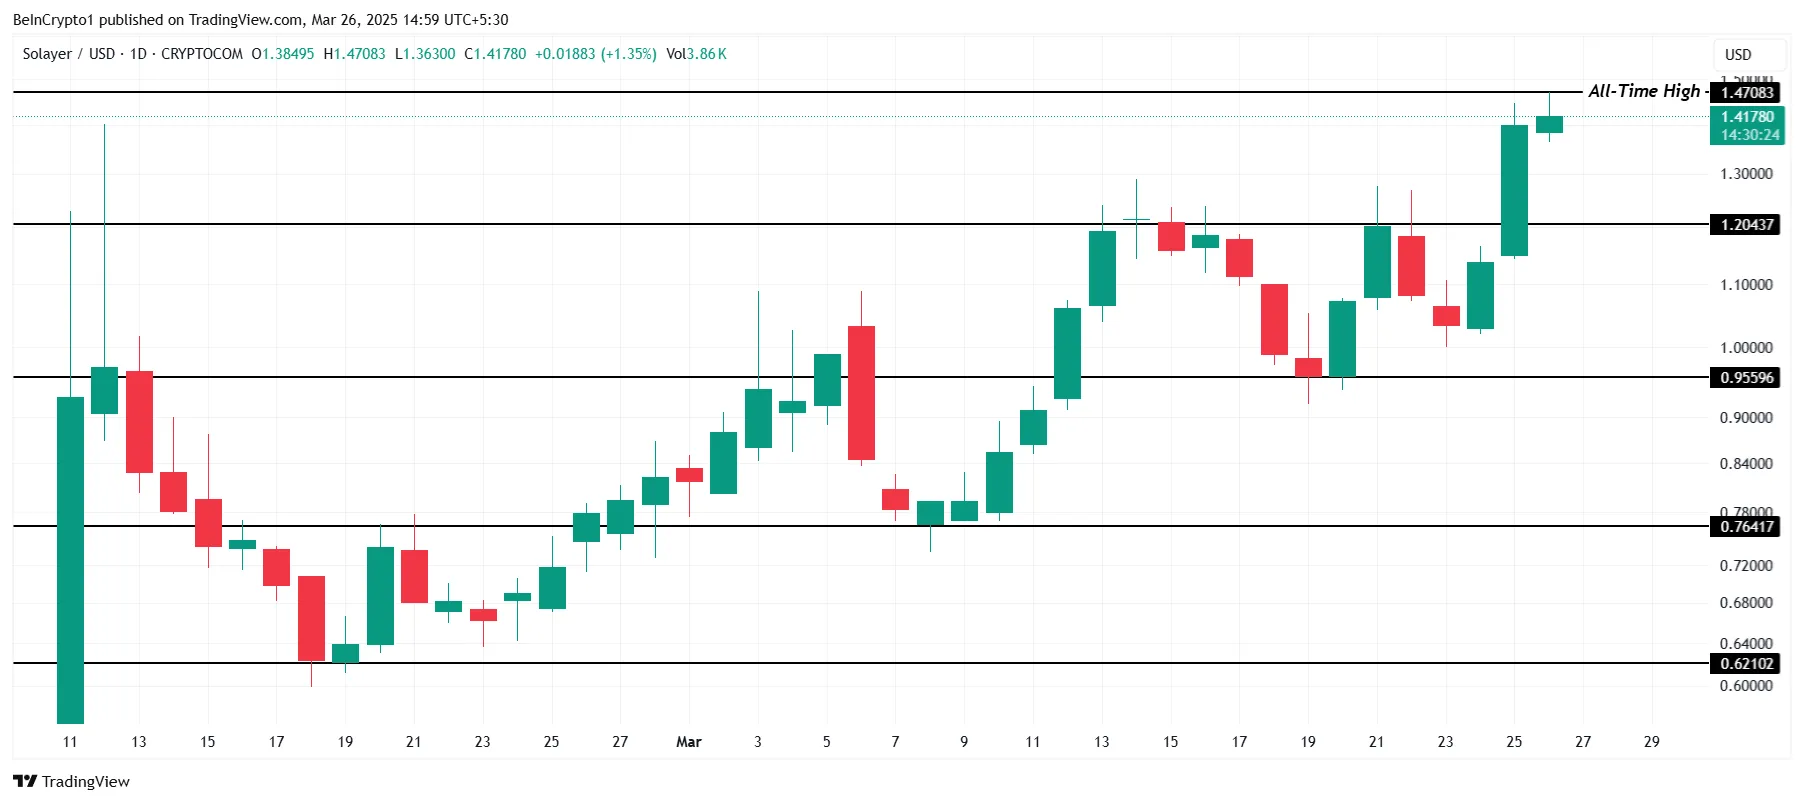
However, if the price falls to $1.20 or lower, the bullish outlook will be invalidated. A drop to $0.95 would result in the loss of recent gains, signaling a shift to bearish sentiment. This potential decline could slow LAYER’s momentum and lead to further price corrections.
Cheems (CHEEMS)
CHEEMS has seen an impressive 133% rise month-to-date, reaching a new all-time high (ATH) of $0.000002179. However, the altcoin has since retraced and is currently trading at $0.000001952. This price action signals potential volatility, but the recent ATH highlights the coin’s strong market interest.
If CHEEMS fails to sustain its uptrend, it could slide toward the critical support level of $0.000001461. A bounce from this level could provide CHEEMS with another opportunity to attempt forming a new ATH. This rebound would indicate that the bullish trend is still in play.
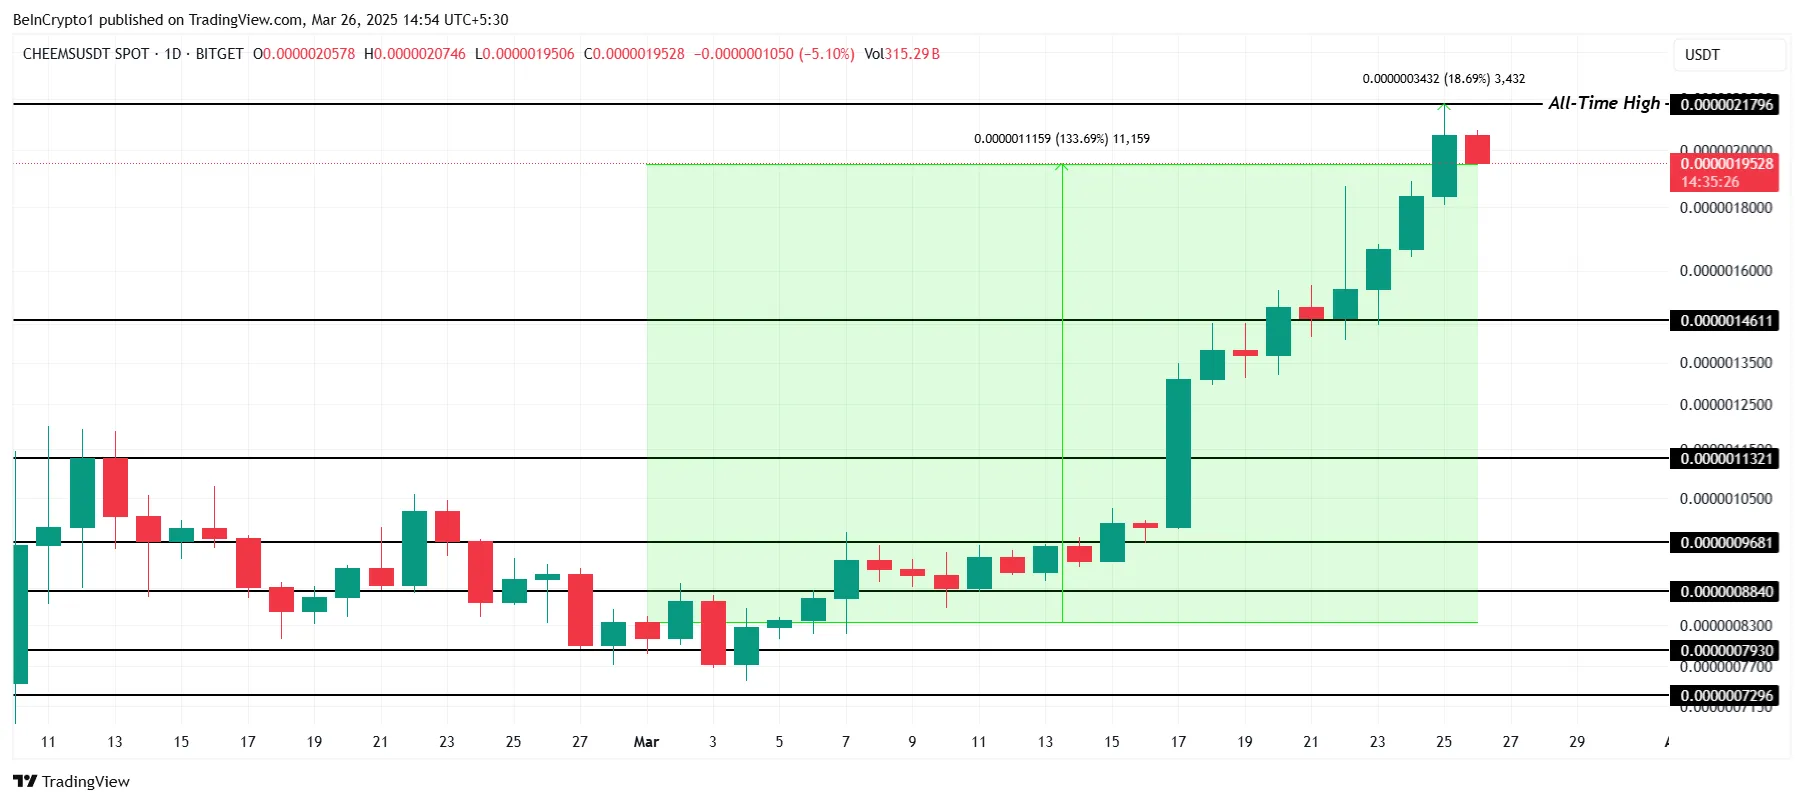
However, if the $0.000001461 support is breached, CHEEMS could experience further declines. The next support level is at $0.000001132, and falling below this would invalidate the bullish outlook, erasing the recent gains.
Saros (SAROS)
SAROS has shown consistent growth throughout the month, trading at $0.055. During an intra-day rise, it reached a new all-time high (ATH) of $0.057, signaling positive market interest. This continued upward momentum could help drive SAROS to even higher levels, further encouraging investor confidence.
If the broader market cues remain strong, SAROS is likely to maintain its uptrend. The price could break through the $0.060 resistance level, extending its gains. This would signal sustained bullish sentiment and potentially attract more investors, pushing the altcoin to new highs.
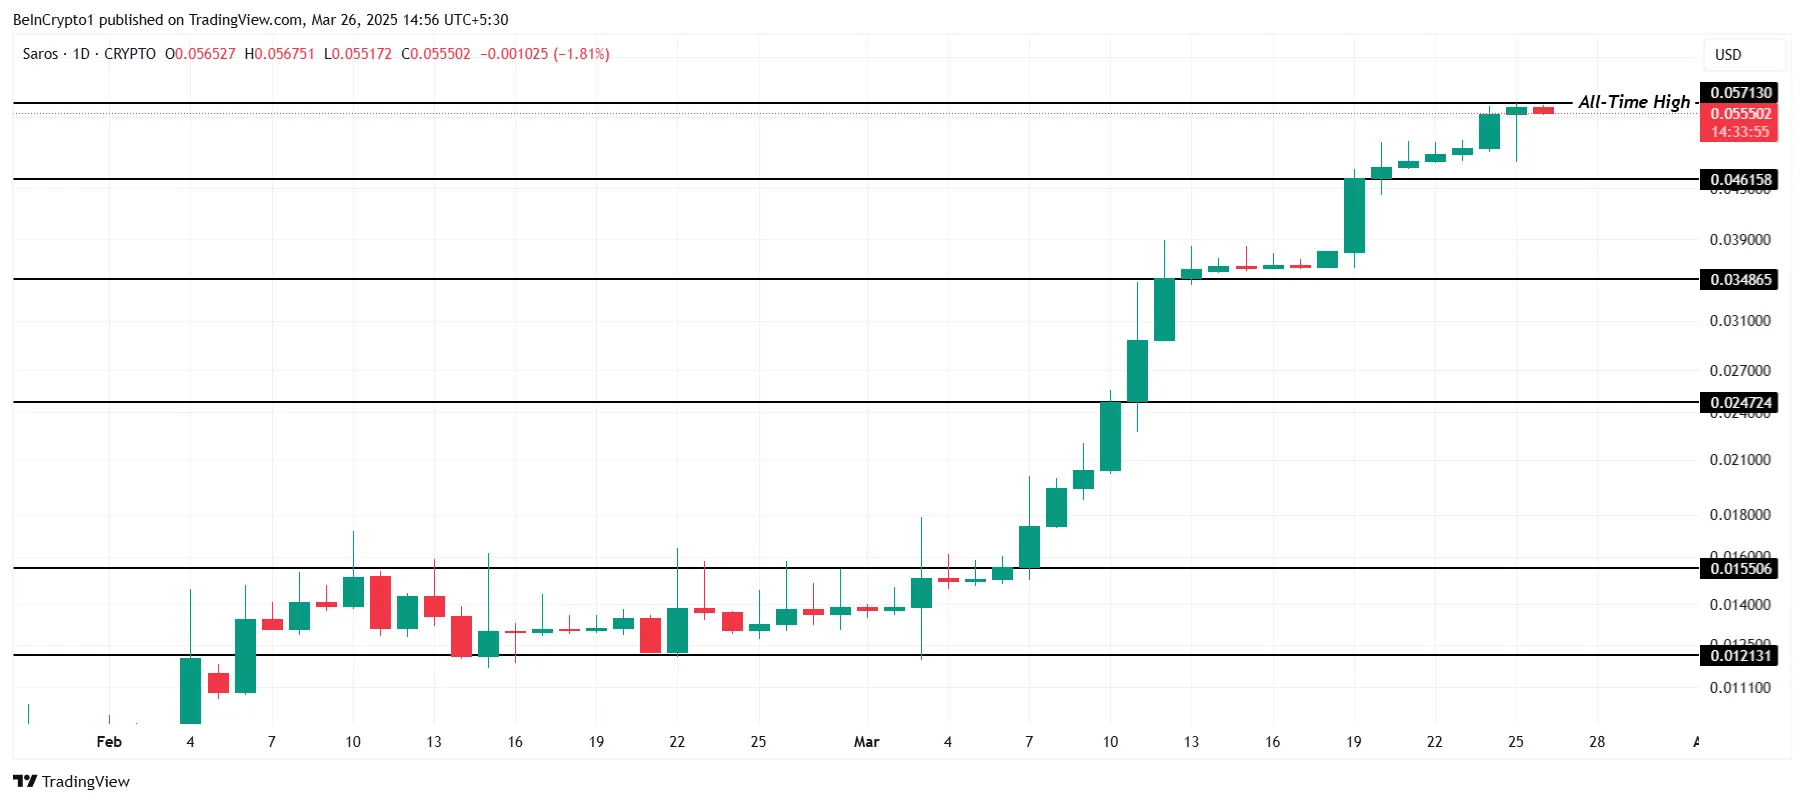
However, if the market momentum reverses, SAROS may struggle to hold on to its gains. A pullback to $0.046 is possible, and losing this support would invalidate the bullish thesis. In this case, SAROS could fall further to $0.034, signaling a deeper price correction.
Disclaimer
In line with the Trust Project guidelines, this price analysis article is for informational purposes only and should not be considered financial or investment advice. BeInCrypto is committed to accurate, unbiased reporting, but market conditions are subject to change without notice. Always conduct your own research and consult with a professional before making any financial decisions. Please note that our Terms and Conditions, Privacy Policy, and Disclaimers have been updated.

Polymarket, a prediction market platform, is under fire following the most severe manipulation attack in its history.
A prediction market with a betting volume exceeding $7 million produced an erroneous outcome, leaving users with significant losses.
Inside Polymarket’s $7 Million Market Manipulation: What Went Wrong
The latest controversy concerns the market: “Ukraine agrees to Trump mineral deal before April?” The market was supposed to run from February 2 to March 31, 2025.
It would resolve as “Yes” if the United States and Ukraine reached an agreement involving Ukrainian rare earth elements by the specified deadline.

Rules on the Polymarket platform explicitly stated that the resolution would be based on “official information from the US and Ukrainian governments.” However, despite no official confirmation, the market was resolved as “Yes,” leading to widespread accusations of manipulation.
“Polymarket has scammed its users once more,” a user wrote on X.
He also noted that, in the past, two markets with identical conditions were classified as “No.” Notably, they had much smaller betting volumes of $91,860 and $360,976. In contrast, the manipulated market boasted a betting volume exceeding $7 million.
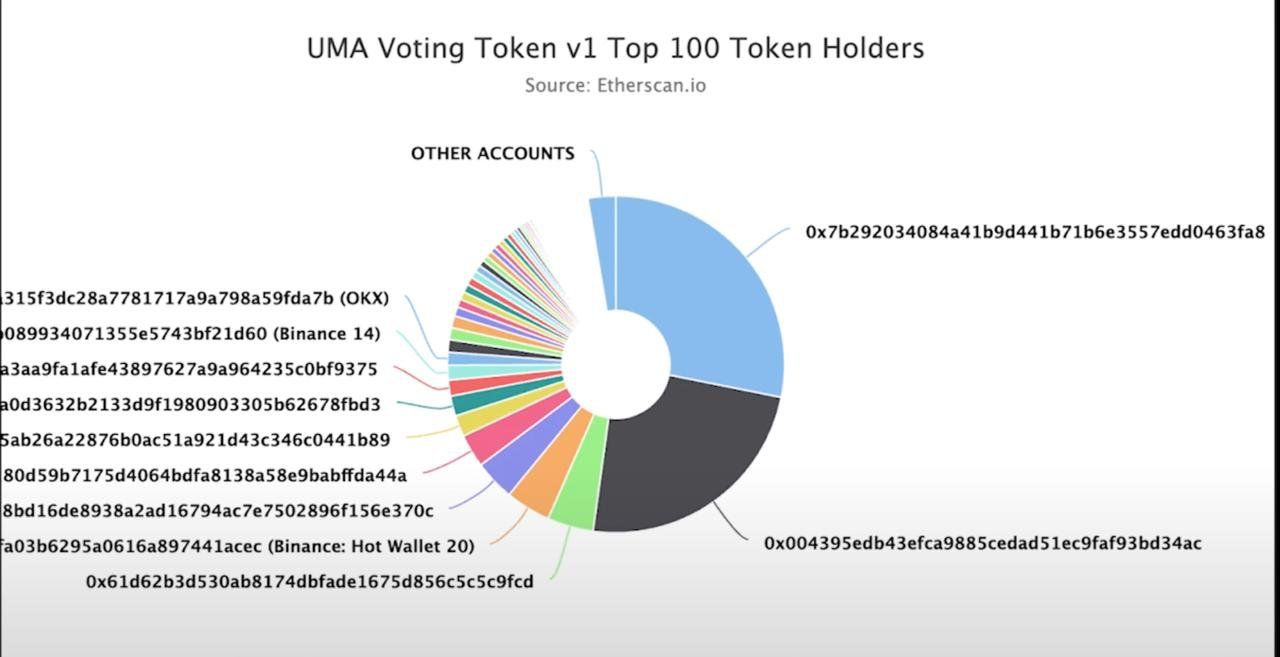
The user claimed that a group of influential users called UMA whales manipulated the outcome. He also revealed that a whale used multiple accounts to cast a large number of votes, totaling 5 million tokens, which accounted for 25% of the total votes.
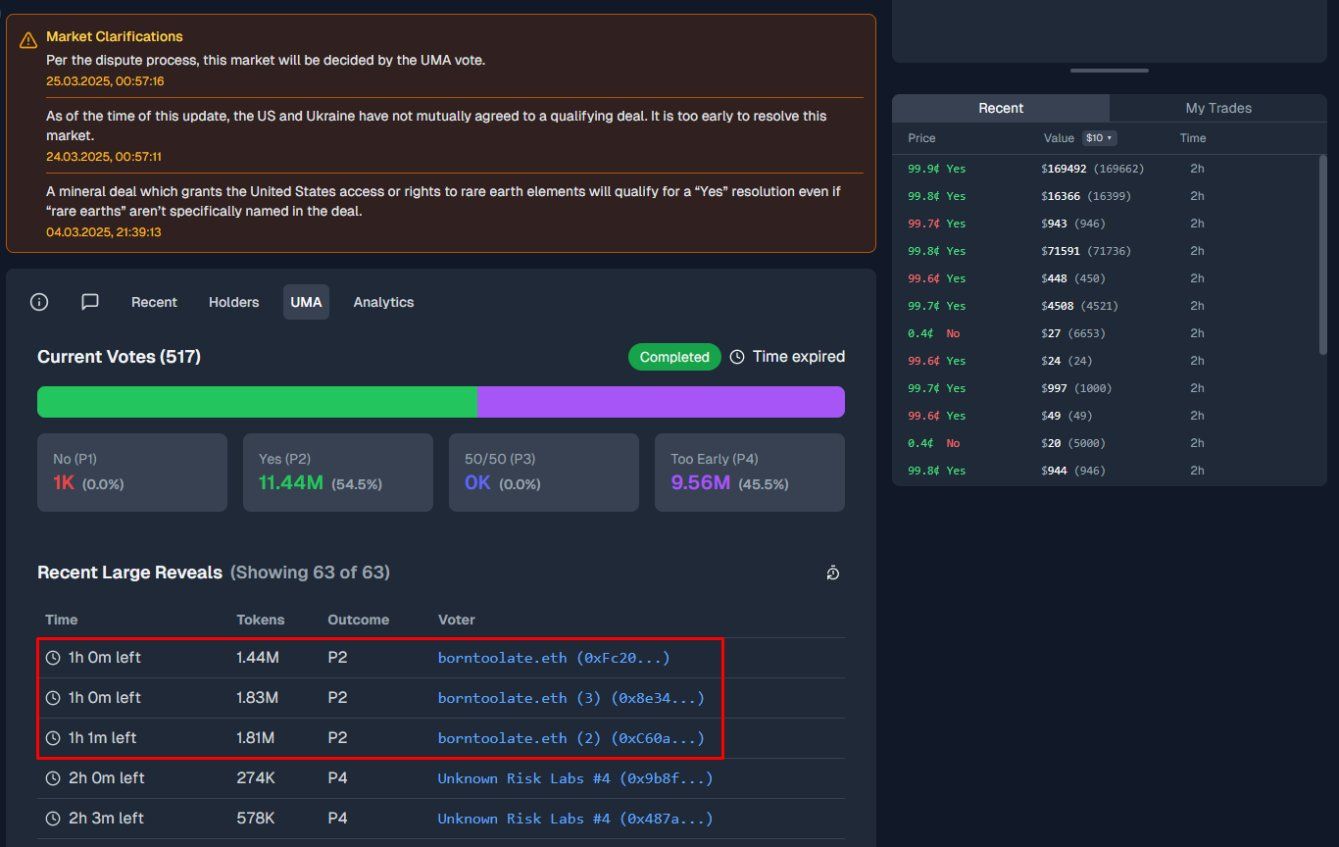
Thus, the individual effectively concentrated a significant portion of the voting power in their hands, skewing the outcome in favor of the “Yes” option.
Polymarket’s response has done little to assuage user concerns. The team issued an announcement on their official Discord server, acknowledging the situation. However, they stated that they could not issue refunds to affected users because the situation was not a market failure.
“This is an unprecedented situation, and we have been in war rooms all day internally and with the UMA team to make sure this won’t happen again. This is not a part of the future we want to build: we will build up systems, monitoring, and more to make sure this doesn’t repeat itself,” the statement read.
Is Polymarket Rigged? A History of Insider Allegations
Meanwhile, this isn’t the first time Polymarket has been accused of manipulation. A detailed thread by an X user, Folke Hermansen, shed light on several similar instances.
“Polymarket is revealing itself to be revealing itself a totally fraudulent platform. Insiders write rules, place bets, and co-ordinate with verifiers to rig markets and scam their own customers for millions daily,” he posted.
Hermansen disclosed that, in early March, manipulators resolved the “Gold missing from Fort Knox” market as “No,” stealing $3.5 million. Furthermore, in another tariff-related market, he alleged that the dispute button disappeared during the 2-hour window for users to challenge the resolution. This allowed insiders to push the market to a “No” outcome.
Another example he gave was the “Will Trump say China during his crypto summit?” market. Polymarket issued a rule clarification after Trump mentioned China, retroactively declaring it didn’t count and resolving the market to “No.”
Hermansen elaborated that the manipulation of Polymarket markets happens due to a combination of factors related to UMA’s dispute resolution system and the influence of insiders.
He added that UMA resolution votes are highly concentrated, with just two whales controlling over half of the voting power. Furthermore, an individual holds up to 7.5 million of the 20 million staked UMA tokens.
Hermansen stressed that these whales are also active participants in Polymarket, placing large bets on outcomes.
“UMA is, in theory, a neutral third-party blockchain protocol which incentivizes truth-seeking. In reality, it incentivizes crowding towards whatever other people are voting for,” he stated.
According to him, the UMA system incentivizes voters to follow the majority to avoid losing their staked tokens. Thus, large holders’ actions drive voting rather than an independent search for the truth.
Additionally, he detailed that to propose or dispute a market resolution on Polymarket, users must post a bond, which is usually $750 USDC. Insiders with significant holdings can afford to stake large amounts and post bonds. Meanwhile, fear of losing their stake discourages others from challenging them.
As a result, most disputes in UMA end up with near-unanimous resolutions, often 95% or more.
“It’s an open secret that UMA whales can arbitrarily decide how markets resolve,” Hermansen claimed.
He also emphasized that the system’s design anonymizes voting and disputes. Therefore, this makes it difficult to trace who is responsible for incorrect resolutions, further enabling insider manipulation.
Disclaimer
In adherence to the Trust Project guidelines, BeInCrypto is committed to unbiased, transparent reporting. This news article aims to provide accurate, timely information. However, readers are advised to verify facts independently and consult with a professional before making any decisions based on this content. Please note that our Terms and Conditions, Privacy Policy, and Disclaimers have been updated.
Cardano’s price has surged by almost 10% over the past week amid the current broader market recovery. This surge is fueled by Cardano’s increasing network activity and long-term holding trends, indicating growing investor confidence.
With the broader market in recovery mode and on-chain fundamentals strengthening, ADA’s current setup suggests the potential for a sustained upside.
ADA Accumulation Grows as Traders Show Strong Conviction
ADA’s demand has soared over the past week, as reflected by the steady surge in the daily count of active addresses on the Cardano network. According to IntoTheBlock, this has risen by 12% over the past seven days, indicating a gradual uptick in the demand for the Layer-1 coin.
This trend is a bullish signal, as it highlights growing investor interest in ADA and could drive its sustained price rally.
Moreover, new demand for the altcoin has also climbed. According to IntoTheBlock, the number of new addresses on the Cardano network has increased by 5% during the review period.
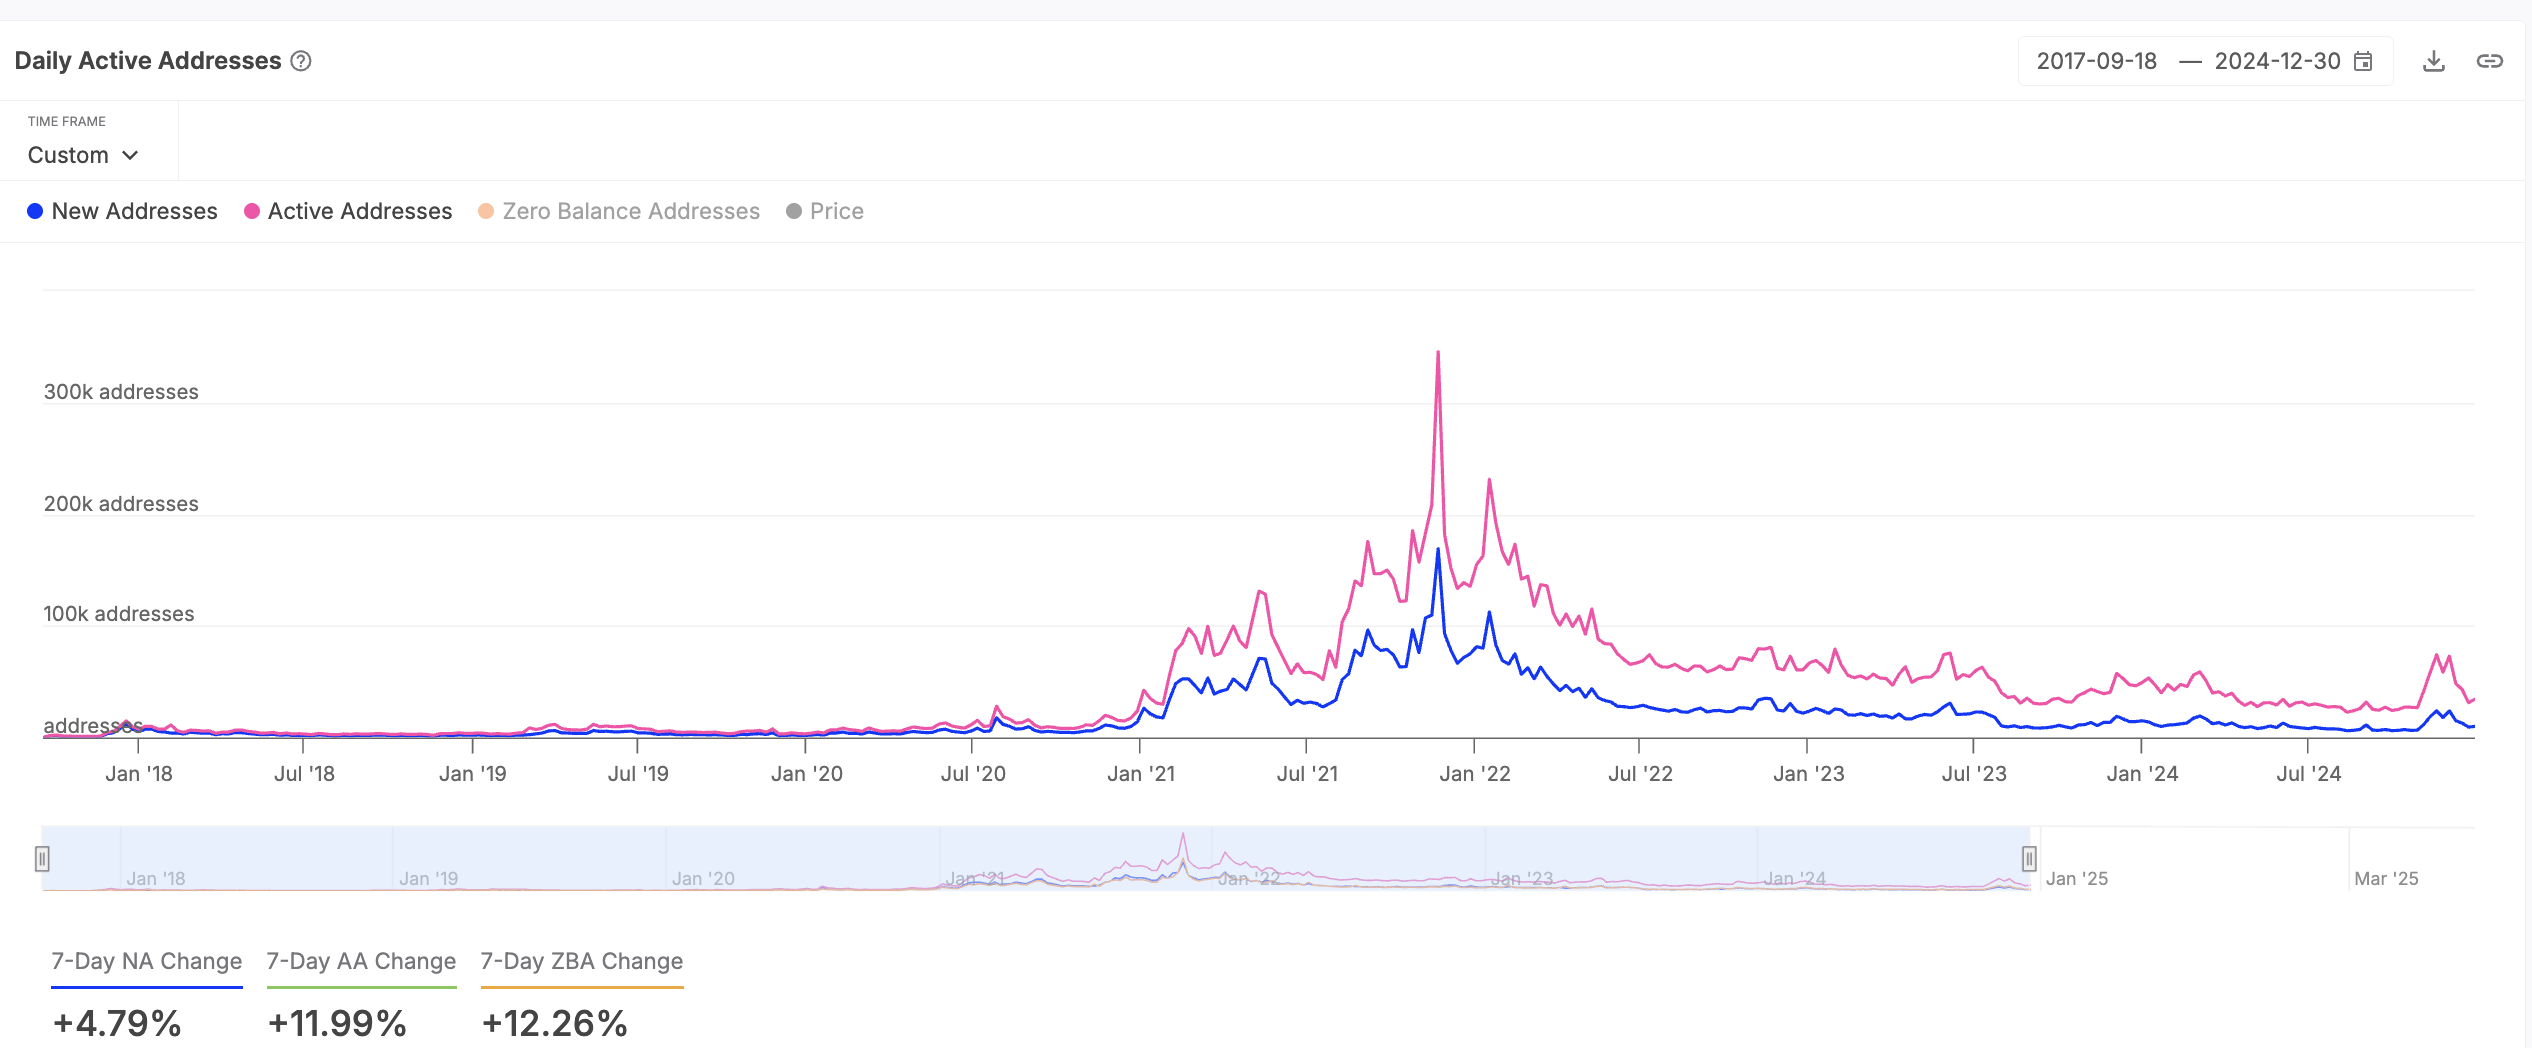
When ADA sees a gradual increase in new demand like this, it indicates the entry of new investors or traders into the market. This leads to higher trading volumes and liquidity, which in turn drives up the coin’s price.
Further, ADA investors have increased their holding time, signaling that the bullish momentum toward the altcoin is growing. According to IntoTheBlock, it has increased by 78% over the past week.
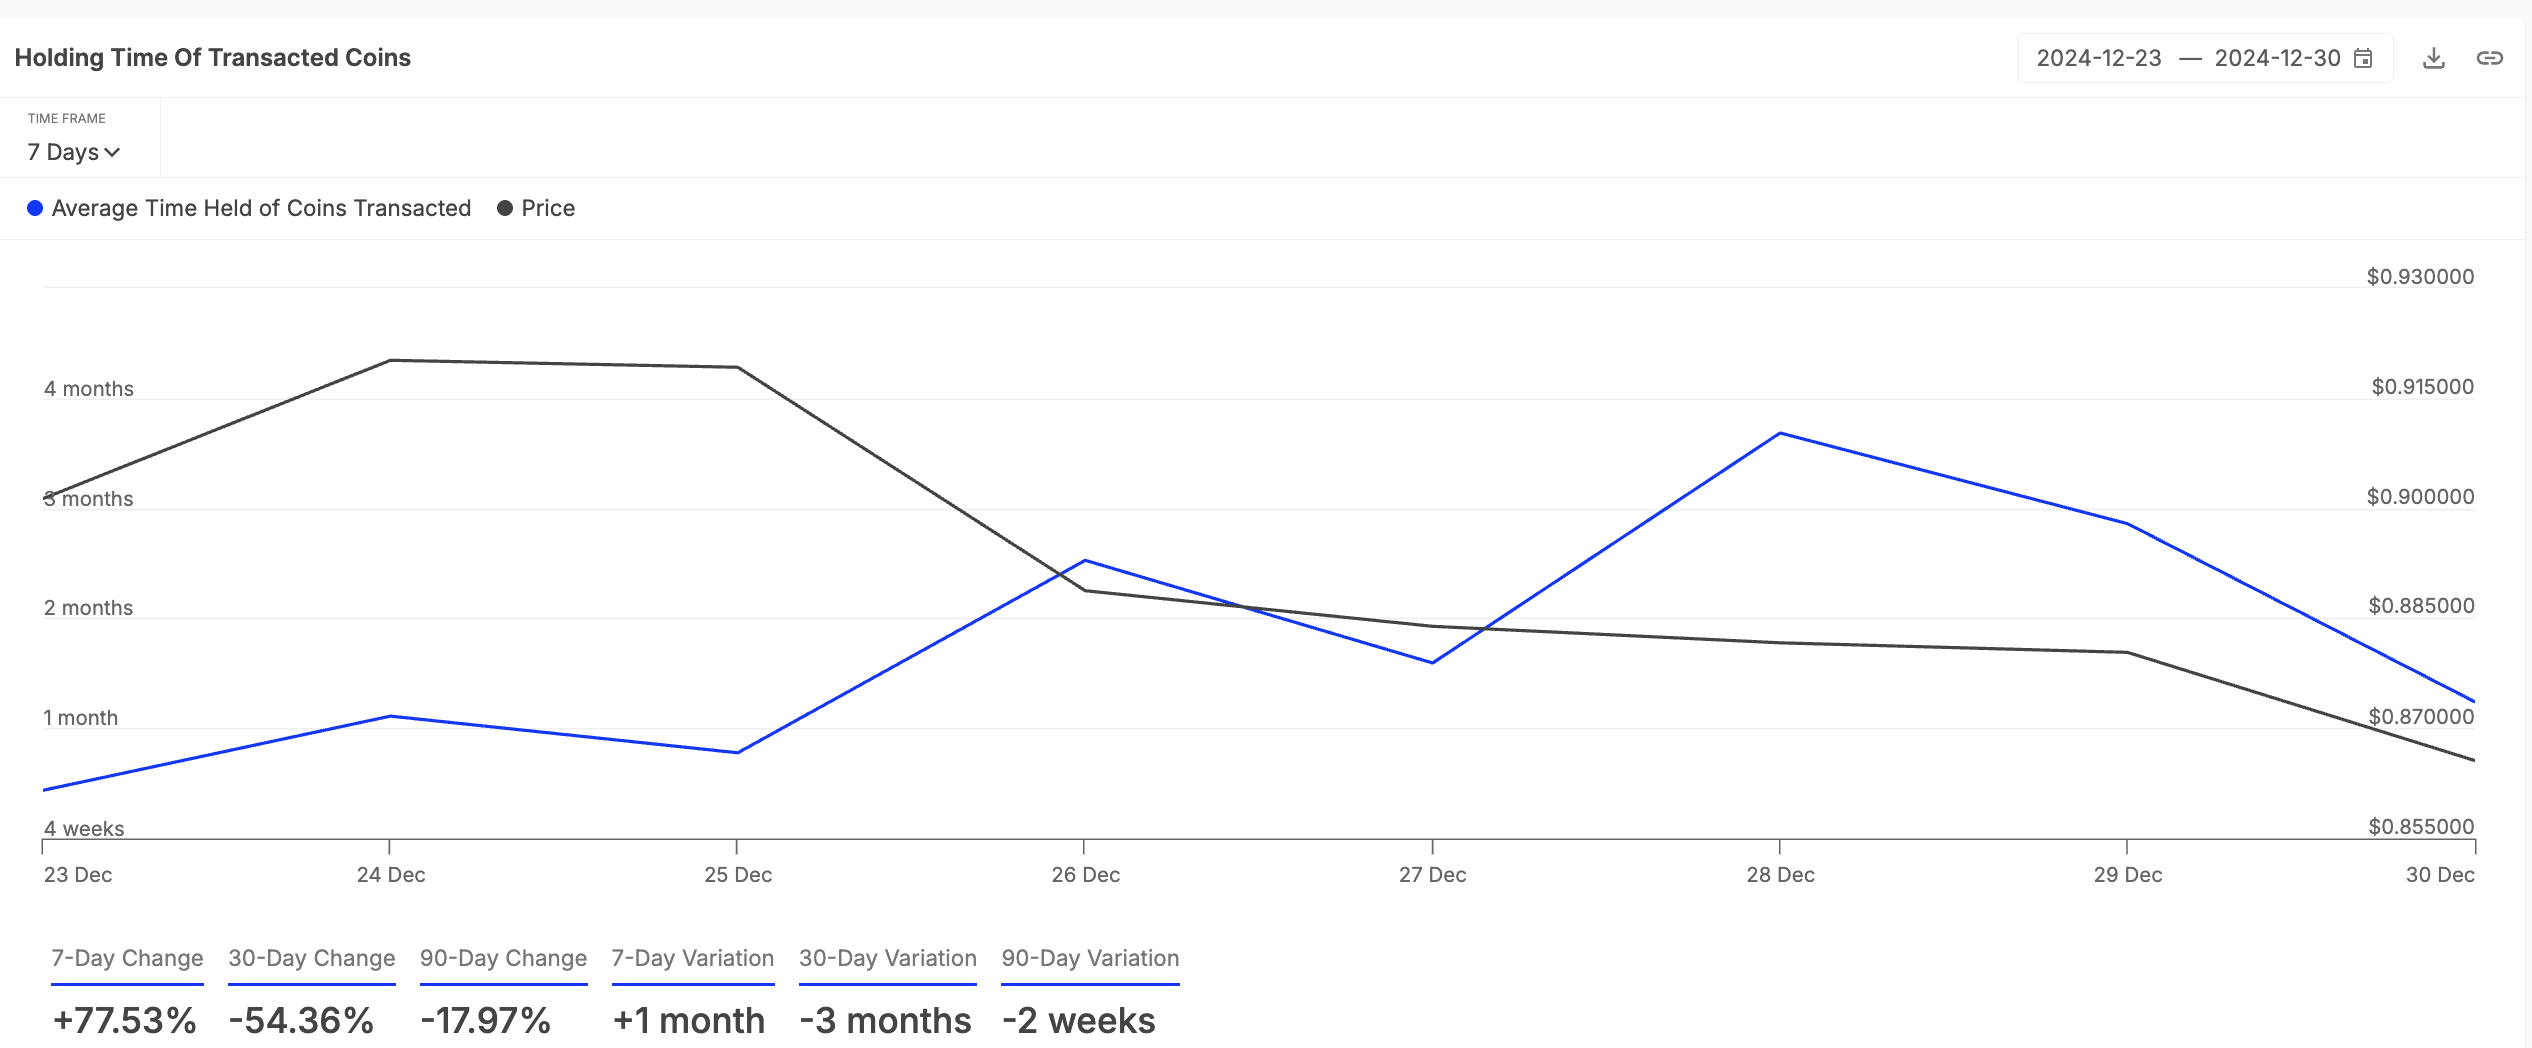
An asset’s holding time measures the average duration its coins/tokens are held before being sold or transferred. This bullish trend marks an ADA accumulation phase, with traders less inclined to sell.
It reflects strong investor conviction, as ADA investors choose to hold on to their coins rather than sell. Also, it could help reduce the selling pressure in the ADA market, driving up its value in the short term.
ADA Bulls Target Higher Gains
ADA trades at $0.76 as of this writing, extending its gains by 4% over the past day. On the daily chart, the coin’s Relative Strength Index (RSI) is in an upward trend at 52.11, confirming the buying activity.
The RSI indicator measures an asset’s overbought and oversold market conditions. It ranges between 0 and 100, with values above 70 indicating that the asset is overbought and due for a decline. Conversely, values below 30 indicate that an asset is oversold and due for a rebound.
At 52.11 and climbing, ADA’s RSI readings suggest strengthening bullish momentum as buying pressure builds. If accumulation continues, the coin’s price could reach $0.97.
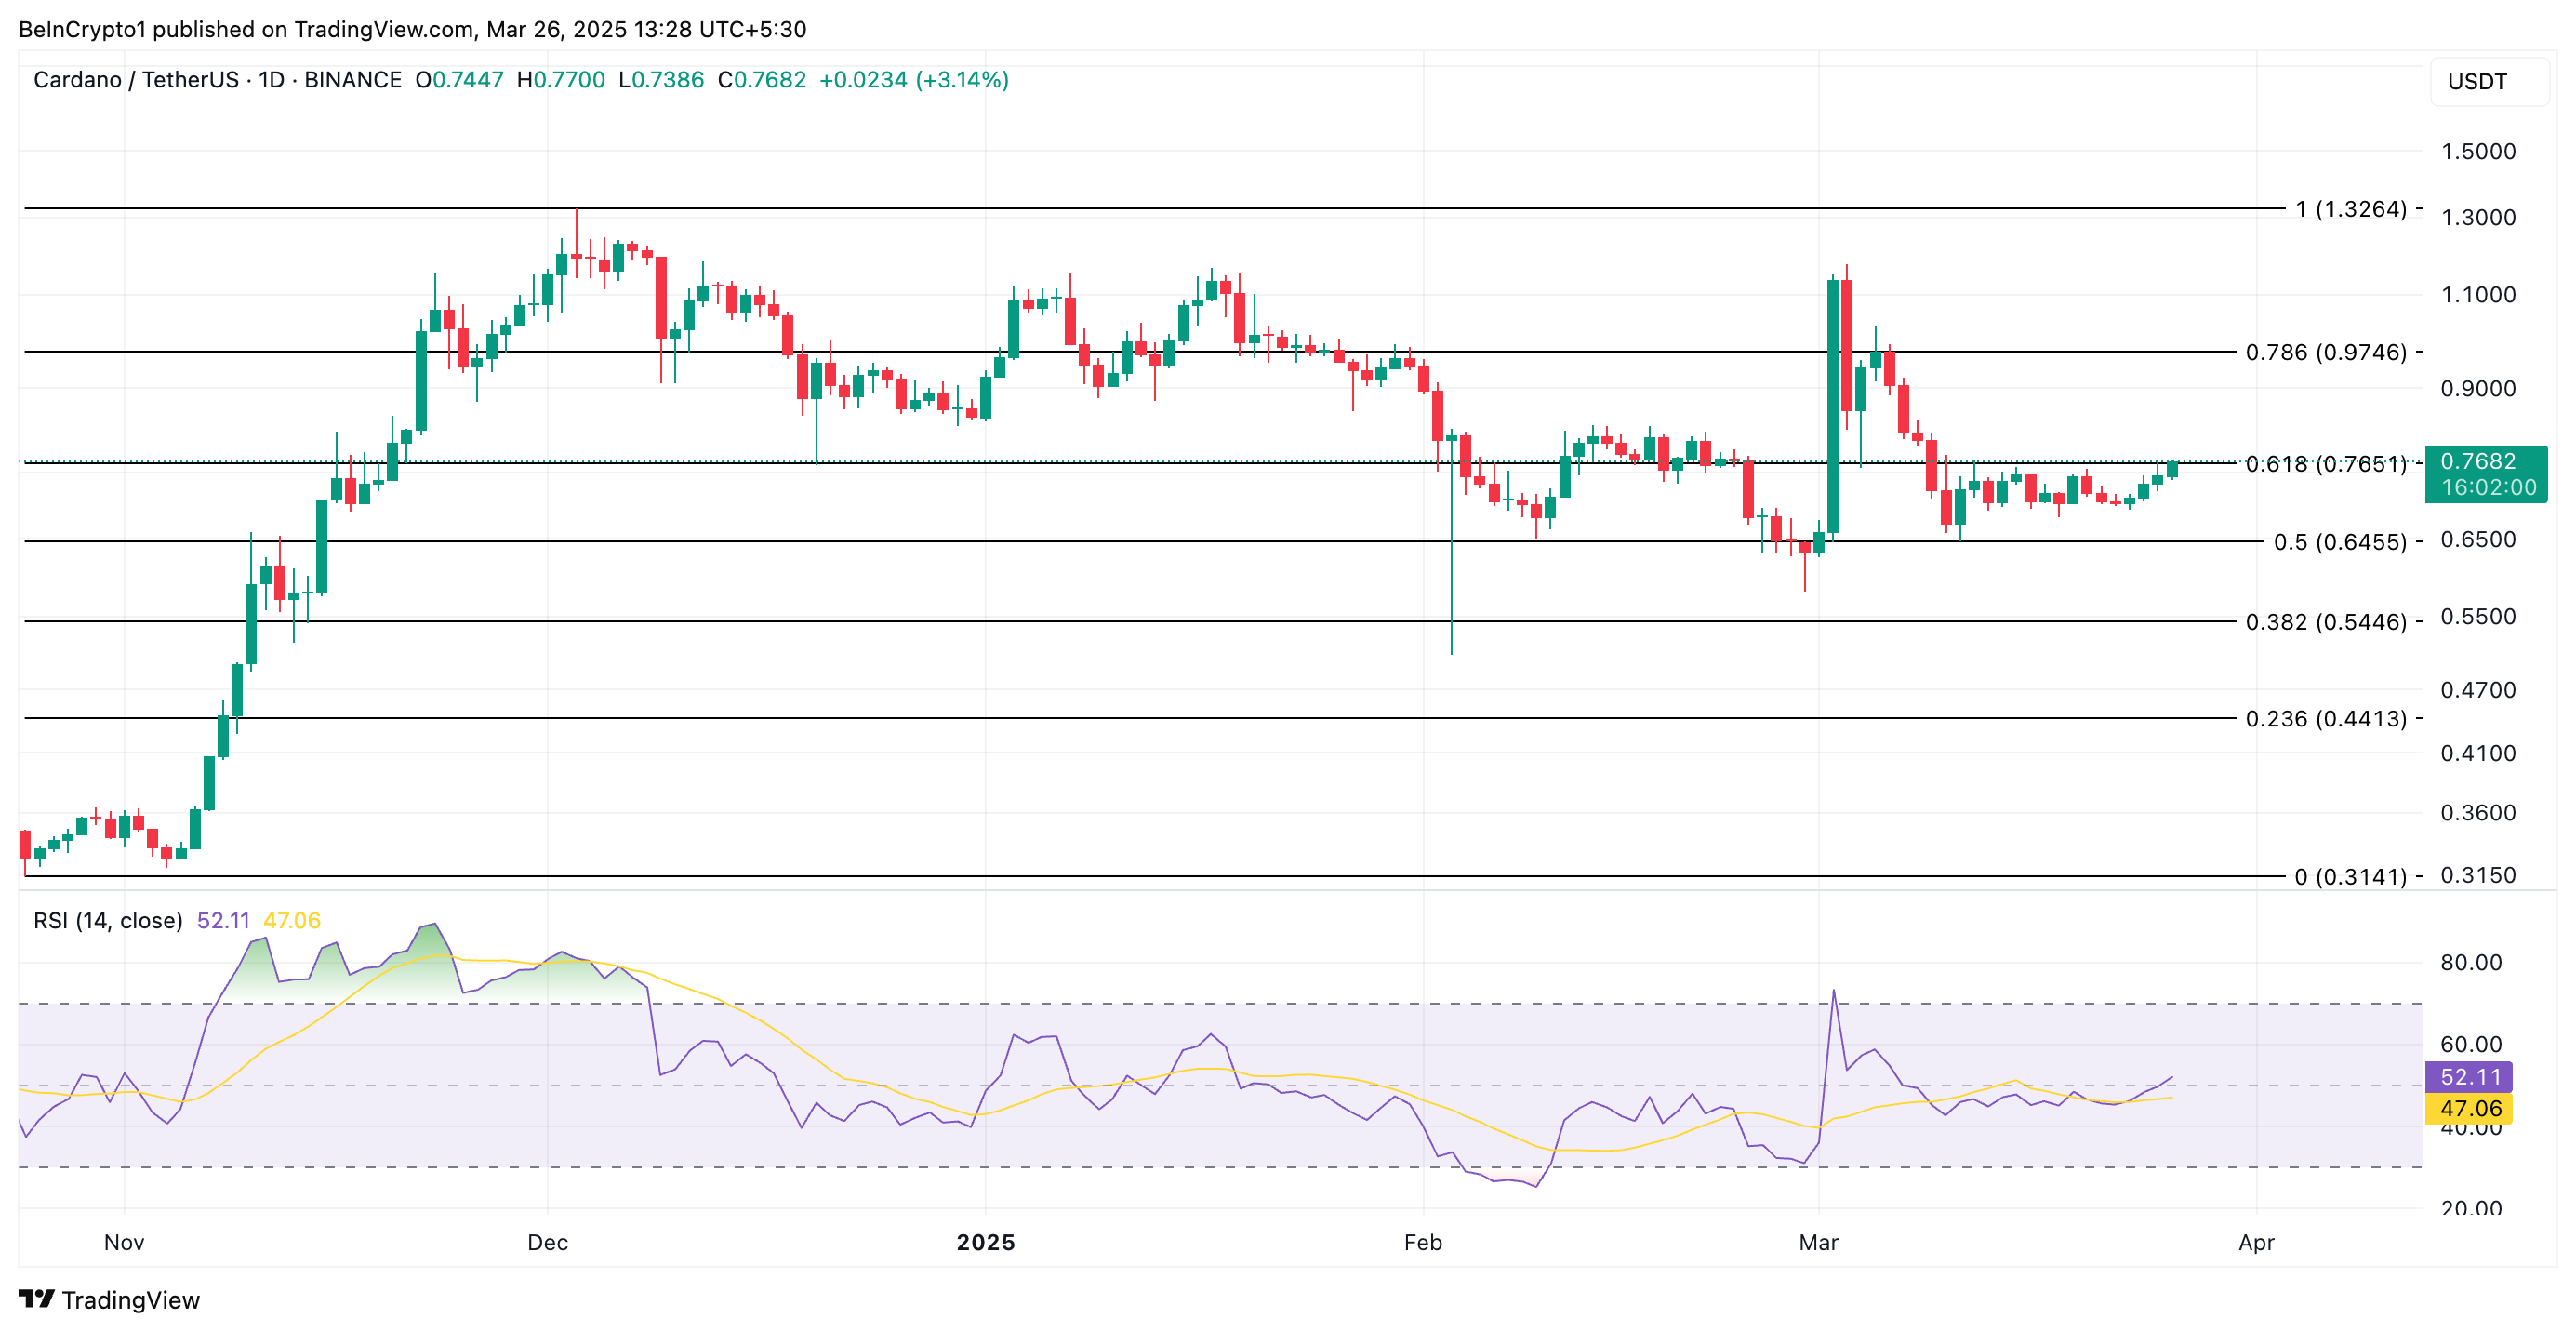
However, if profit-taking commences, this bullish projection would be invalidated. In that scenario, ADA’s price could dip to $0.64.
Disclaimer
In line with the Trust Project guidelines, this price analysis article is for informational purposes only and should not be considered financial or investment advice. BeInCrypto is committed to accurate, unbiased reporting, but market conditions are subject to change without notice. Always conduct your own research and consult with a professional before making any financial decisions. Please note that our Terms and Conditions, Privacy Policy, and Disclaimers have been updated.
3 Altcoins That Reached All-Time High Today

Binance to Delist 4 Crypto Pairs, What’s The Impact On Prices?

How a $7 Million Market Was Manipulated on Polymarket

Ripple IPO Delayed Again? Here’s The Likely IPO Date

Cardano Network Activity Indicates Bullish Momentum for ADA

SYRUP, GEOD, and Story Protocol

2.52 Million Altcoins Are Ruining Crypto’s Future

Animoca Brands Valuation Tanks 75% In Two Years, Here’s Why

Crypto exchange BingX hacked for $43 million

Are The Big Players Losing Interest?

Hong Kong’s Securities Association Tips Authorities On Crypto Self-Regulation

Coinbase cbBTC Set to go Live on Solana
2.52 Million Altcoins Are Ruining Crypto’s Future
Animoca Brands Valuation Tanks 75% In Two Years, Here’s Why
Crypto exchange BingX hacked for $43 million
Are The Big Players Losing Interest?
Hong Kong’s Securities Association Tips Authorities On Crypto Self-Regulation
Coinbase cbBTC Set to go Live on Solana
-
 Altcoin23 hours ago
CBOE Files 19b-4 For Fidelity’s Solana ETF With US SEC
-

 Market23 hours ago
Uptrend Resumes After A Healthy Pullback
-
 Market17 hours ago
SEC Will Return $75 Million to Ripple in the XRP Lawsuit
-

 Market22 hours ago
Trump’s World Liberty Financial Launches USD1 Stablecoin
-
 Market18 hours ago
Top 3 PumpFun Meme Coins to Watch Before March Ends
-
 Altcoin17 hours ago
Pi Network Releases Update On Domain Auction, Pi Coin To Rebound To $1?
-

 Ethereum22 hours ago
Ethereum Accumulation Is Almost Over – Breakout Above $2,200 Could Trigger Expansion Phase
-
 Market16 hours ago
GameStop To Buy Bitcoin After Disappointing Q4 Earnings Report