
Market
Ethereum Price Below $2,000 Triggers Bullish Signal After 2 Years

Ethereum (ETH) has seen a significant decline in price, falling from $2,800 to around $1,900 in recent weeks. This drop has triggered a major bearish signal, the first of its kind in two years.
However, the current price action may also suggest that recovery could be on the horizon.
Ethereum Has A Shot At Recovery
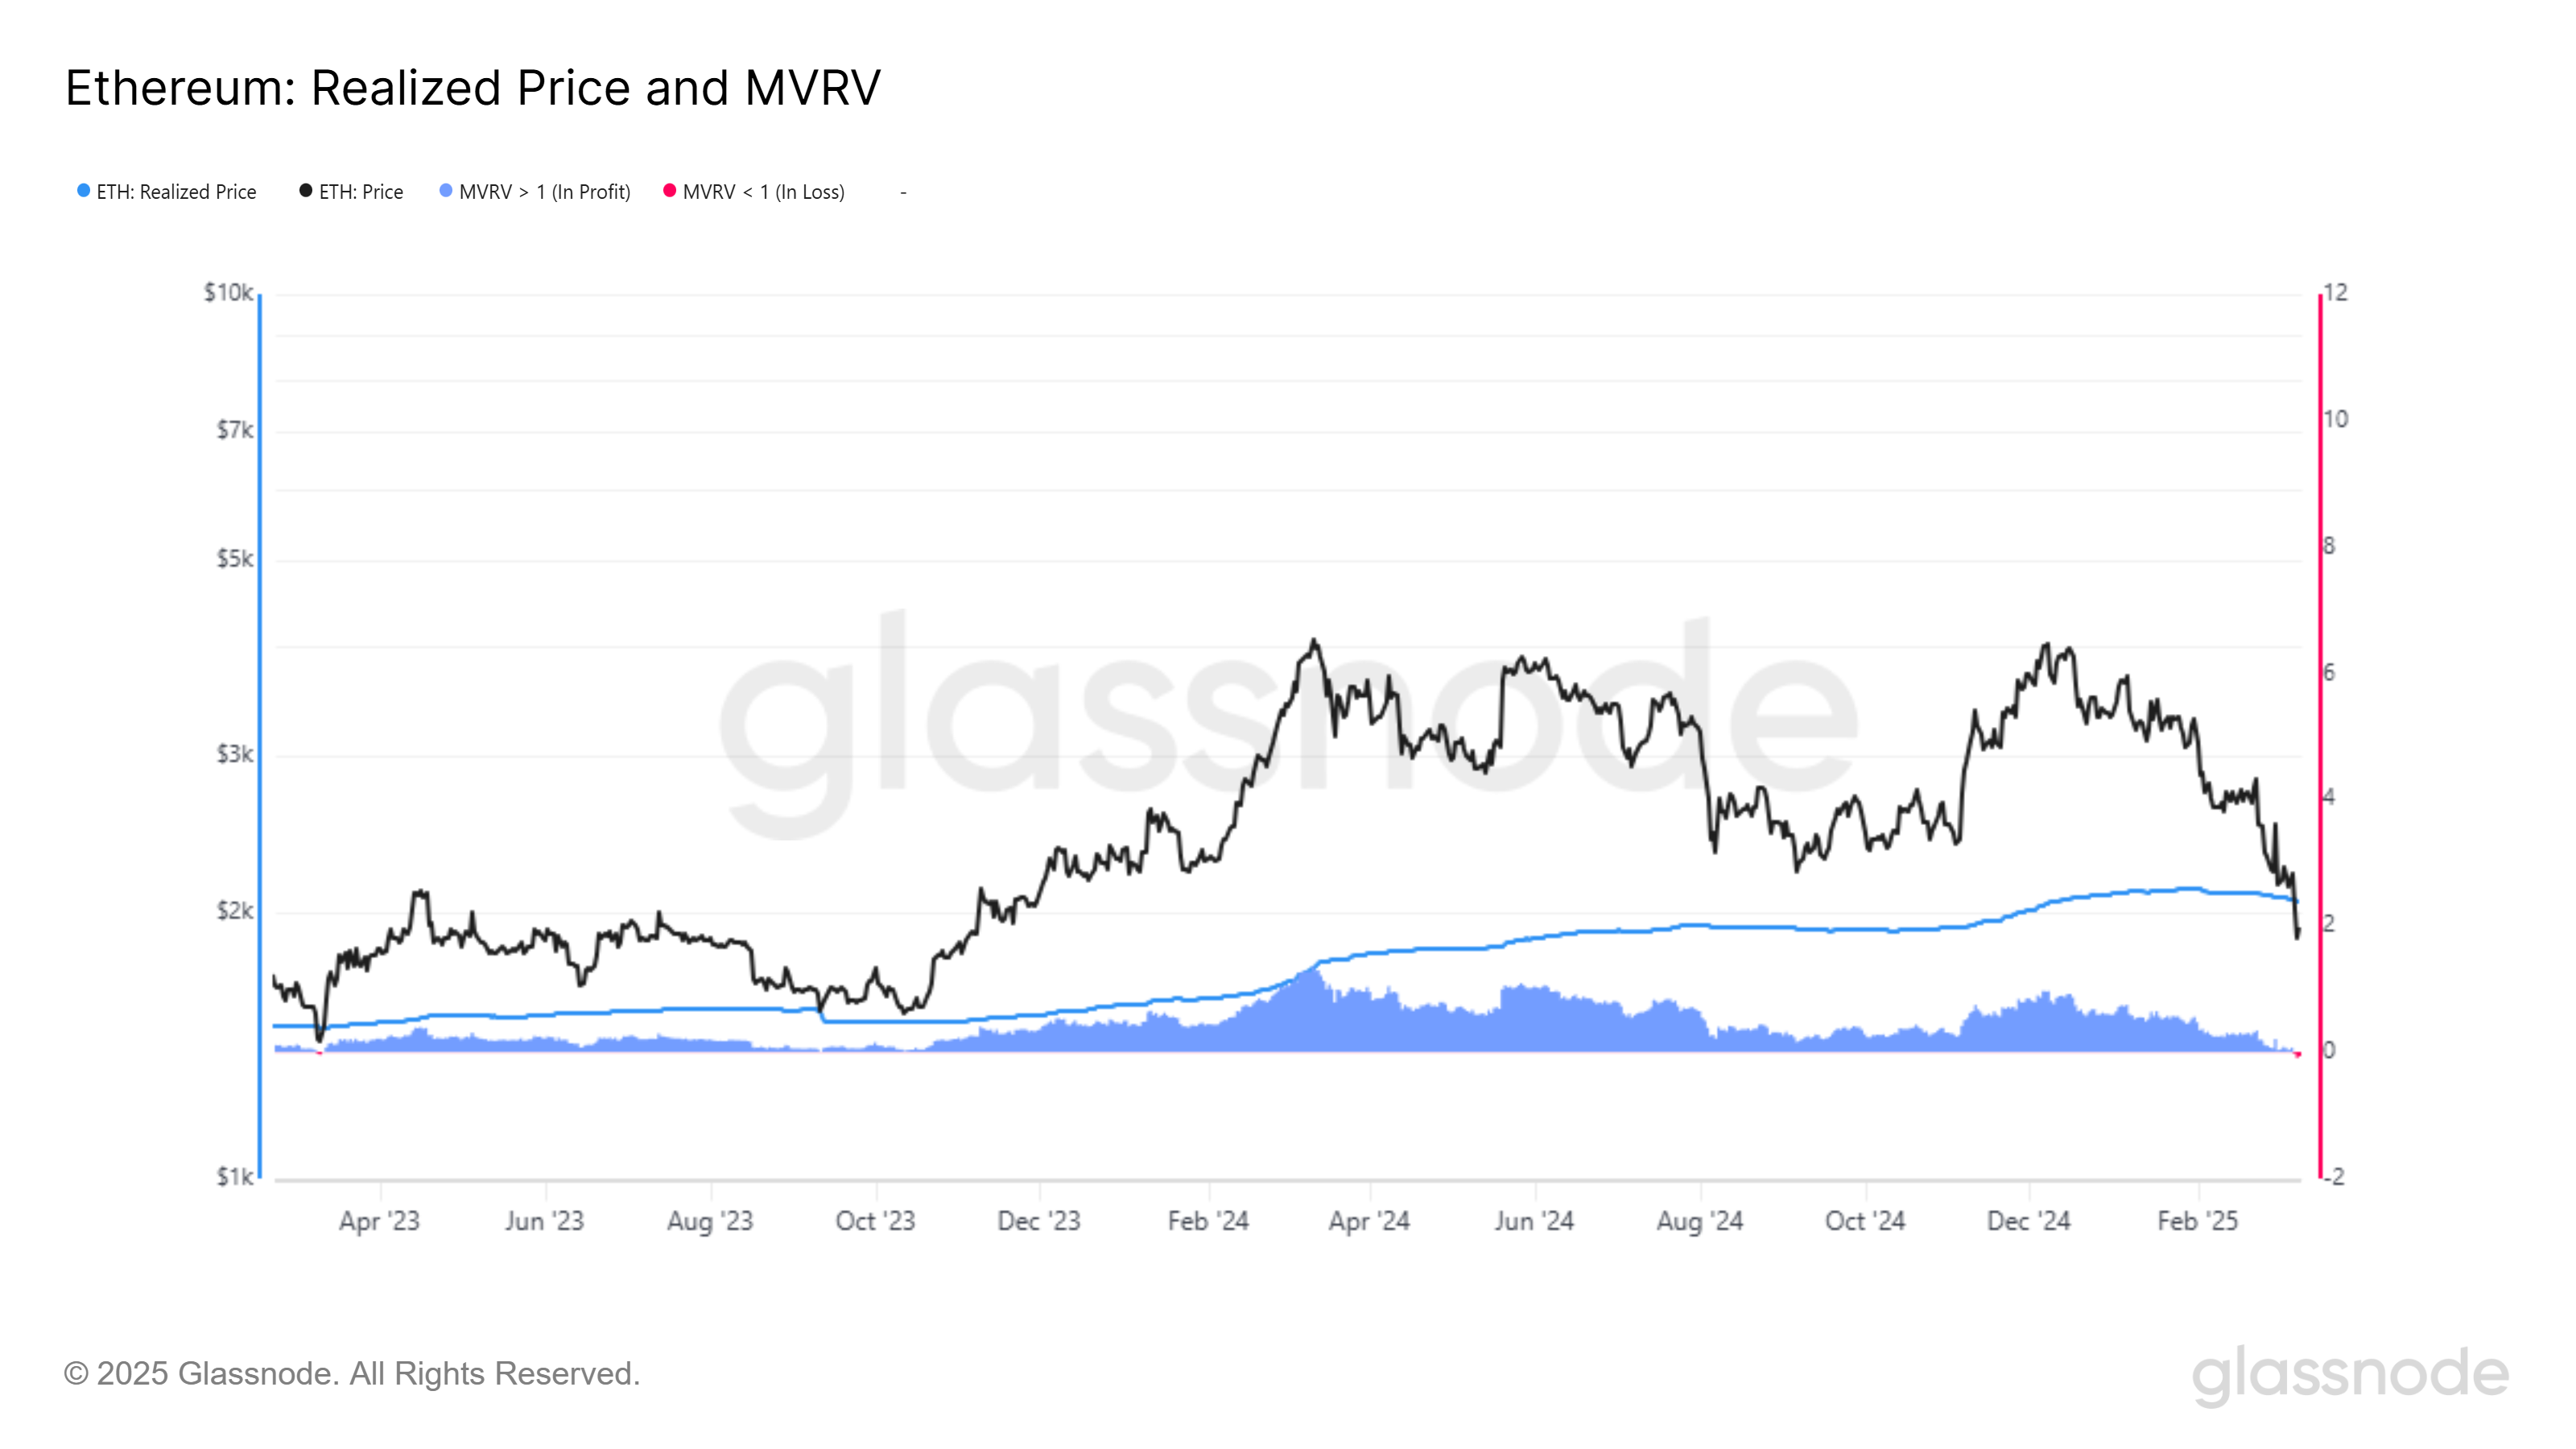
Ethereum’s price recently fell below the Realized Price for the first time in two years, a development that has sparked concern among some investors. This drop has caused the Market Value to Realized Value (MVRV) ratio to decline, indicating that investors are facing approximately 7% losses.
While this may appear bearish at first glance, it actually presents a potential bullish signal. The previous time Ethereum faced this situation, the altcoin rebounded strongly, and the MVRV ratio improved as the price recovered. This pattern has given some market participants hope that the current situation may lead to a similar recovery.
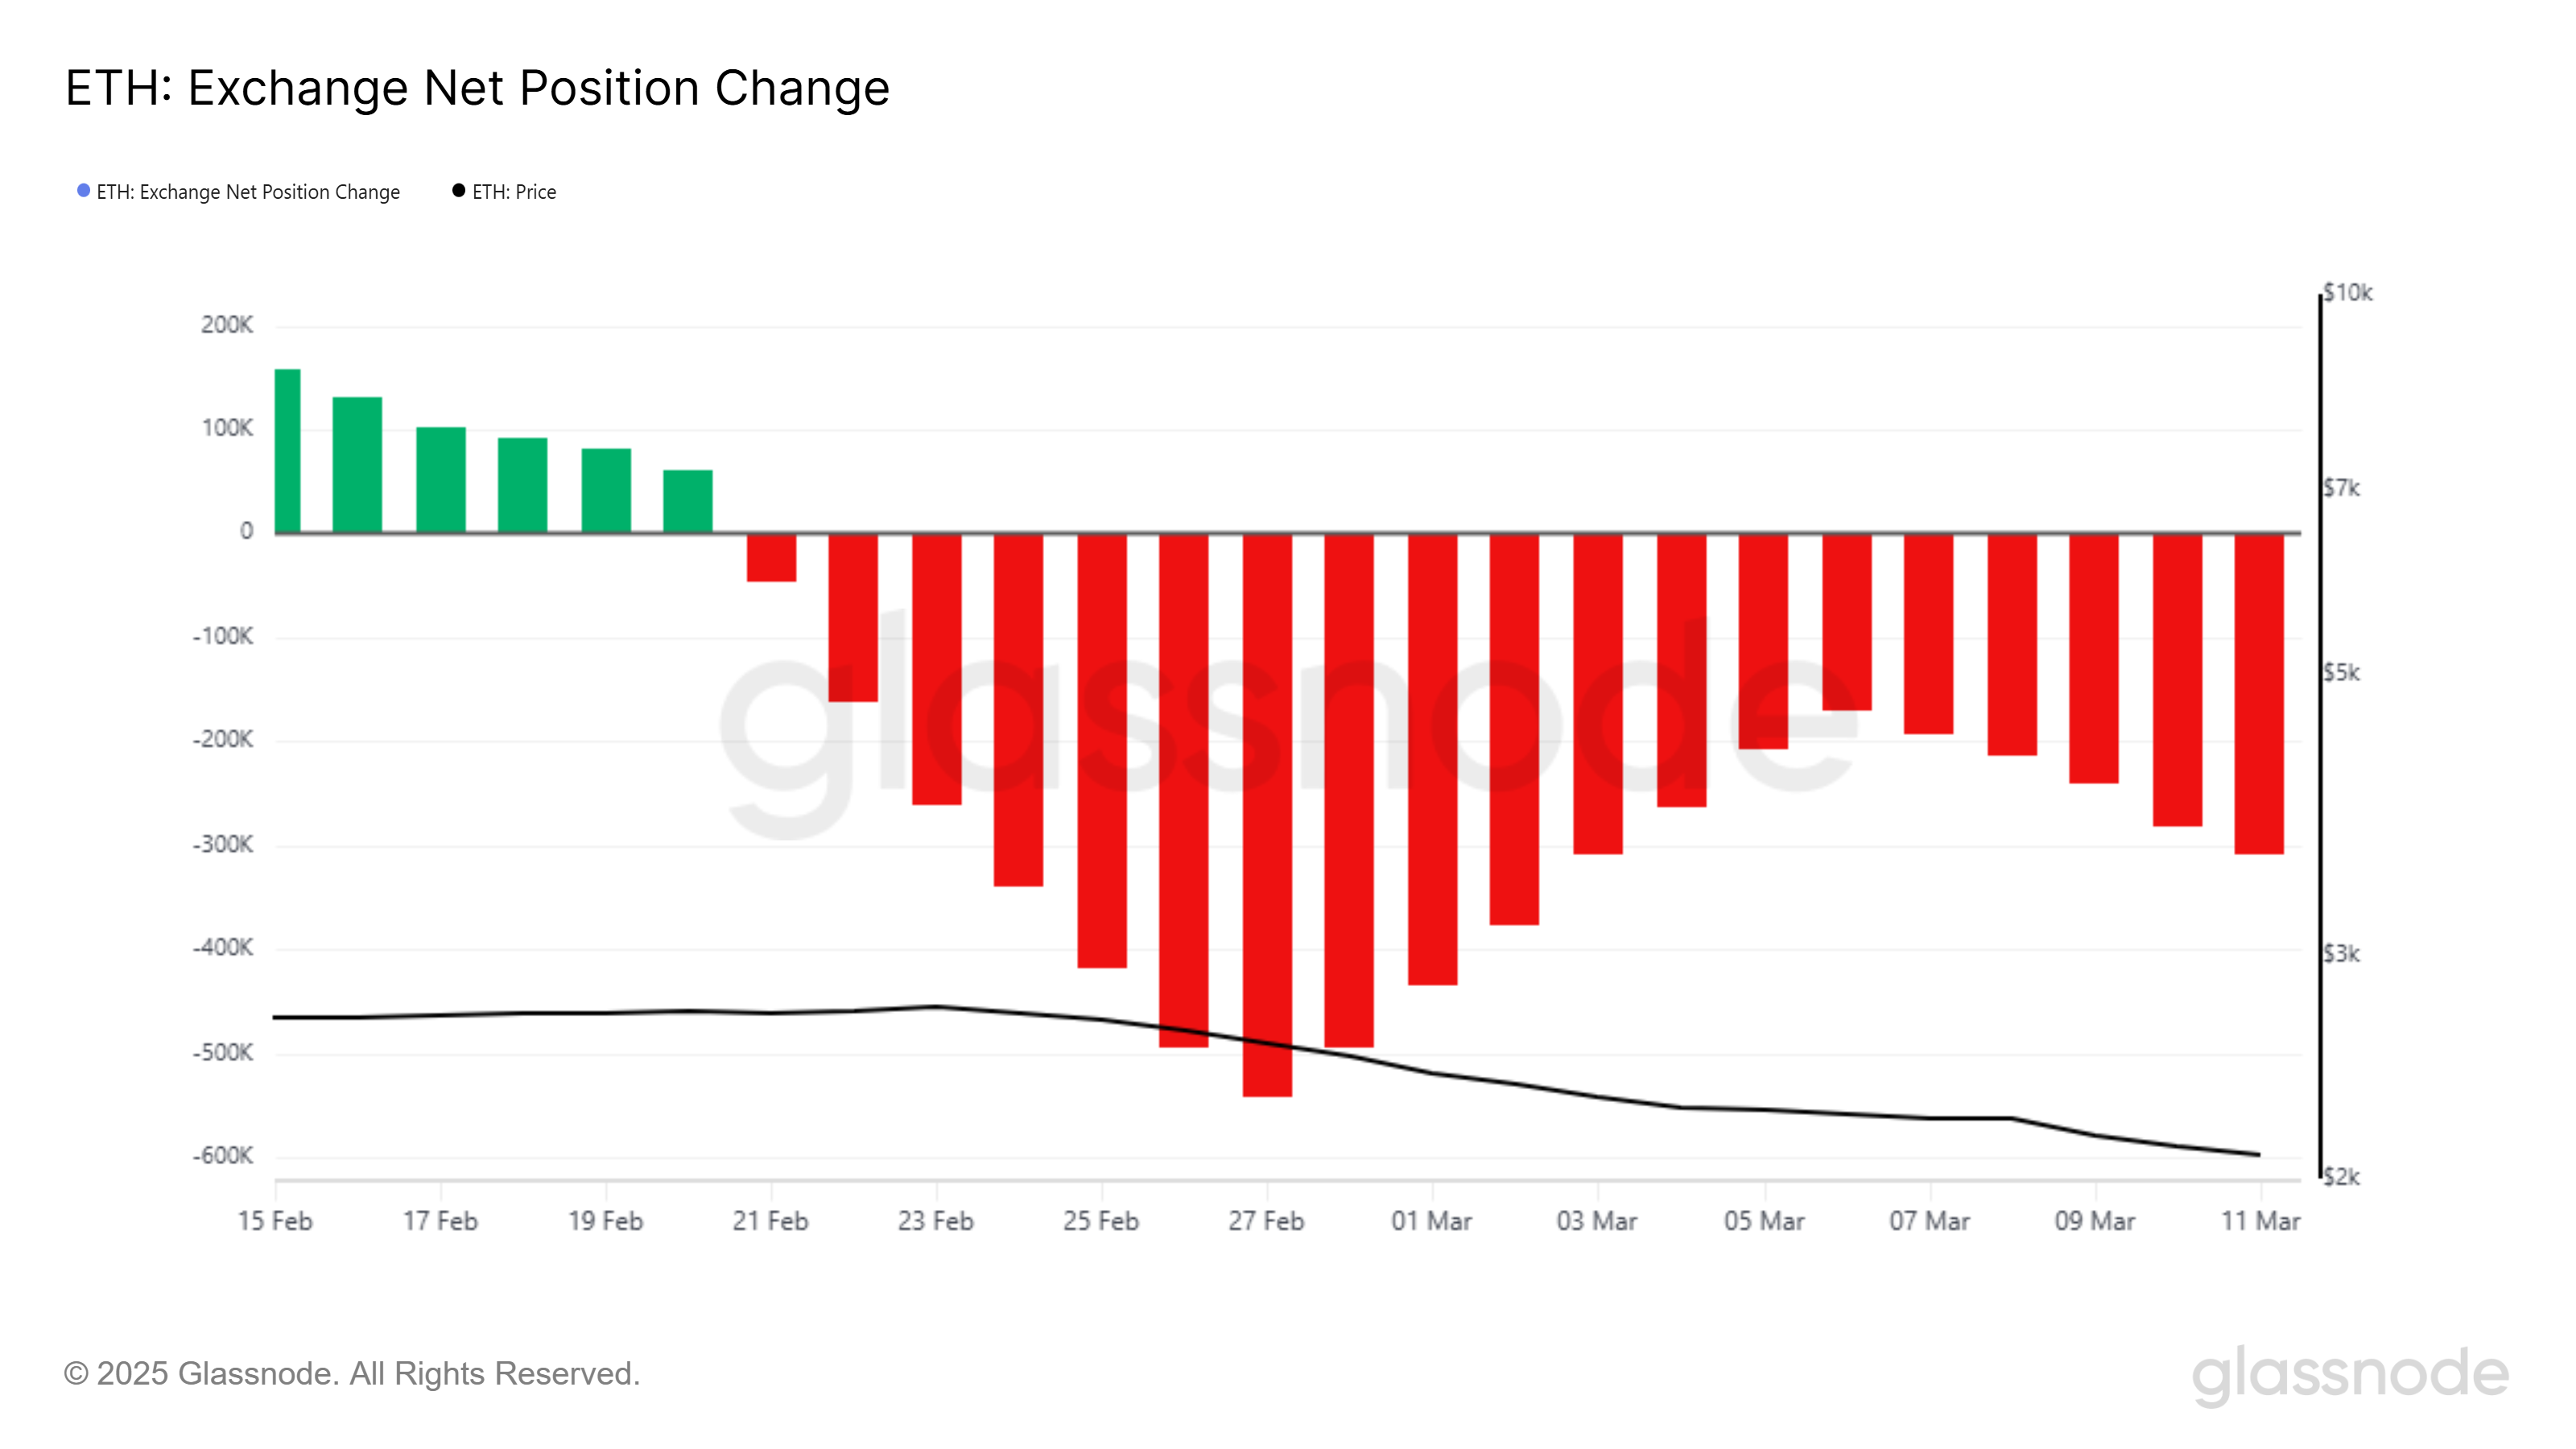
On the macro level, Ethereum’s overall momentum is showing signs of improvement despite the recent downturn. The Exchange Net Position Change, which tracks the flow of ETH into and out of exchanges, has been declining.
This indicates that investors are accumulating Ethereum rather than selling it, which is a positive sign. Investors see the current low prices as an opportunity to buy, anticipating a future price increase.
This shift in investor behavior is reflected in the purchase of 138,000 ETH worth approximately $262 million this week. The inflow of capital into Ethereum supports the idea that many investors are positioning themselves for a rebound.
ETH Price Eyes A Rally
Ethereum is currently trading at $1,897, down 32% over the last two weeks. The altcoin is holding above the support level of $1,862, which could act as a foundation for a potential bounceback. If Ethereum maintains this level, it may find its way to higher prices in the coming weeks.
For Ethereum to confirm a recovery, it must breach and flip $2,141 into support. This level is critical for ETH to move toward $2,344 and secure a more sustained upward movement. The factors discussed, including the RSI recovery and investor accumulation, are likely to contribute to Ethereum’s ability to reach this target.
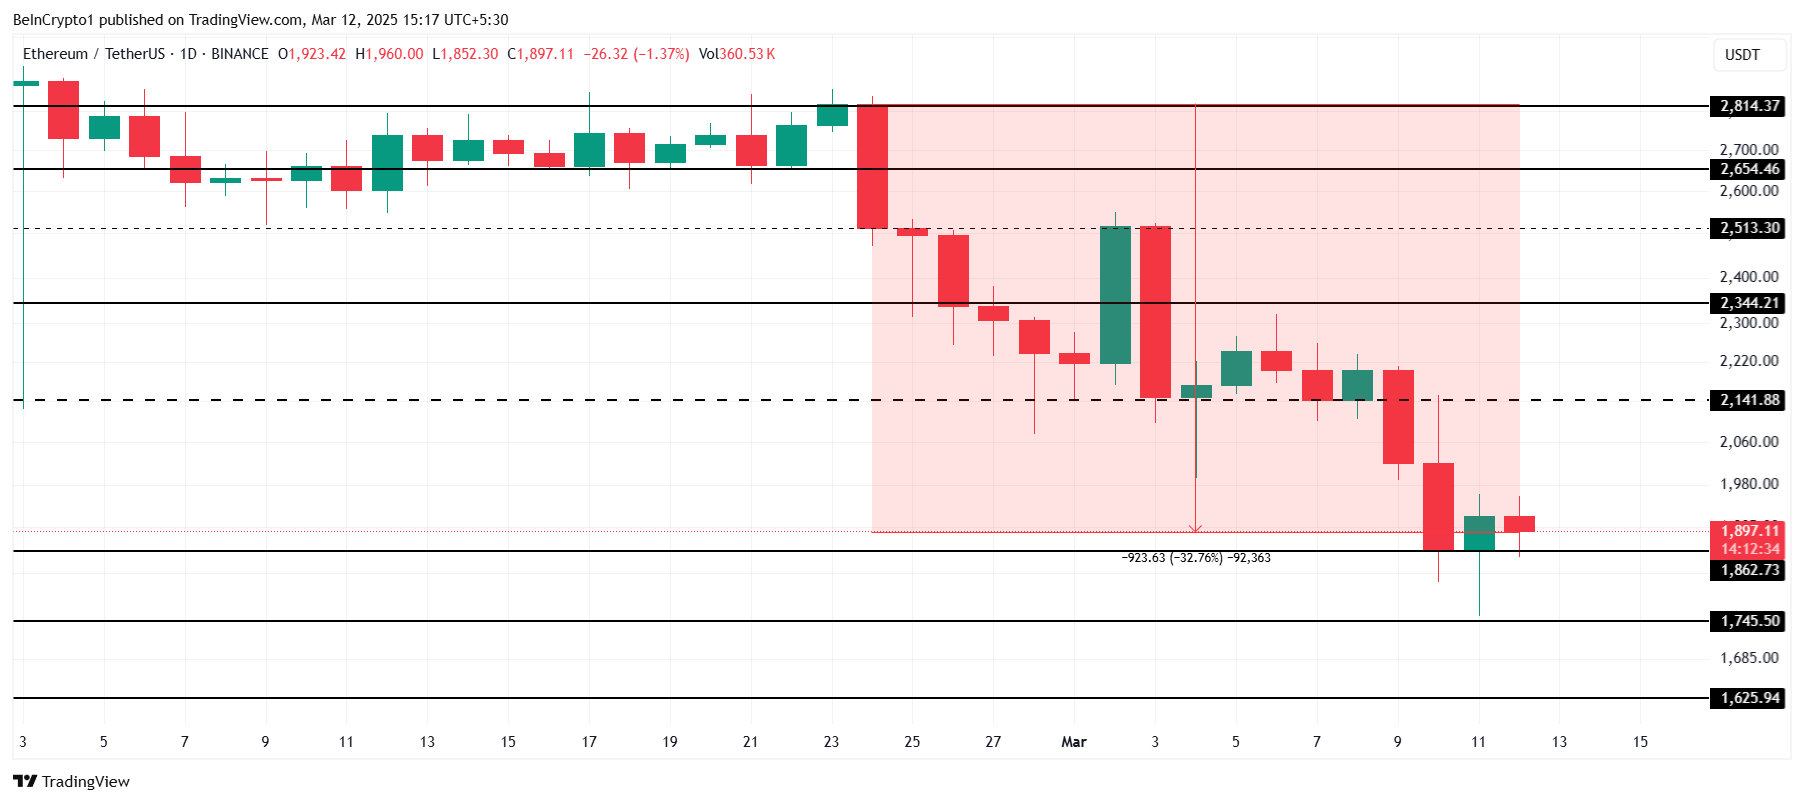
However, if broader market conditions worsen, Ethereum could fall below the $1,862 support, pushing the price to $1,745 or even $1,625. A drop to these levels would invalidate the bullish outlook and suggest further downside potential.
Disclaimer
In line with the Trust Project guidelines, this price analysis article is for informational purposes only and should not be considered financial or investment advice. BeInCrypto is committed to accurate, unbiased reporting, but market conditions are subject to change without notice. Always conduct your own research and consult with a professional before making any financial decisions. Please note that our Terms and Conditions, Privacy Policy, and Disclaimers have been updated.


Arthur Hayes, co-founder of BitMEX, has urged market participants to “buy everything” following recent signals from the US Federal Reserve.
In an April 11 post on X, Hayes suggested that investors consider broad exposure to the crypto markets as central banks show signs of stepping in to stabilize the system.
Hayes Sees Market Stress as Cue to Buy Bitcoin
Hayes previously pointed to rising bond yields, particularly the 10-year US Treasury rate climbing above 4.5%, as a potential trigger for government intervention.
He argued that such pressure could force the Fed to inject fresh liquidity, creating favorable conditions for risk assets—especially Bitcoin. According to Hayes, this scenario could lead to a prolonged upward move in crypto and broader markets.
“We will be getting more policy response this weekend if this keeps up. We are about to enter UP ONLY mode for BTC,” Hayes stated.
The Fed’s stance appears to support this view. Susan Collins, President of the Boston Federal Reserve, recently told the Financial Times that while the markets are still functioning properly, the Fed stands ready to act if liquidity becomes strained.
Collins emphasized that the central bank has tools in place to ensure market stability if disruptions emerge. However, She stressed that the rate cuts are not the Fed’s first line of defense as other tools are available to stabilize financial markets when needed.
“The core interest rate tool we use for monetary policy is, certainly not the only tool in the toolkit and probably not the best way to address challenges of liquidity or market functioning,” she said.
These developments come at a time when the global economy is already under stress. President Donald Trump’s new wave of tariffs has added fresh uncertainty to financial markets.
Though the administration paused its new tariff schedule for 90 days, it sharply increased duties on Chinese goods to 145%. China has since responded with its own tariff hikes, lifting rates on American imports from 84% to as much as 125%.
These tit-for-tat measures have raised fears of an inflation spike in the US, along with possible job losses and weaker economic growth. Wall Street has already experienced a significant selloff, and US Treasury markets are showing signs of strain.
Meanwhile, despite the short-term suspension of new trade penalties, underlying tensions remain high. For Hayes, however, the combination of macro stress and central bank intervention presents a clear signal: this may be the moment to accumulate assets before the tide turns.
Disclaimer
In adherence to the Trust Project guidelines, BeInCrypto is committed to unbiased, transparent reporting. This news article aims to provide accurate, timely information. However, readers are advised to verify facts independently and consult with a professional before making any decisions based on this content. Please note that our Terms and Conditions, Privacy Policy, and Disclaimers have been updated.

Leading coin Bitcoin has had a turbulent past few weeks, with its price troubles prompting many short-term investors—often referred to as “paper hands”—to exit the market.
However, amidst the price volatility, the coin’s long-term holders (LTHs) remain resolute and show no signs of backing down as they attempt to push BTC back above $85,000. How soon can they realize this?
Bitcoin Long-Term Holders Shift From Selling to Stacking
In a recent report, CryptoQuant analyst Burak Kesmeci assessed BTC’s Long-Term Holder Net Position Change (30d sum) and found that since April 6, the metric has turned positive, showing clear upward momentum. As a result, Kesmeci wrote, BTC has risen by approximately 12%.
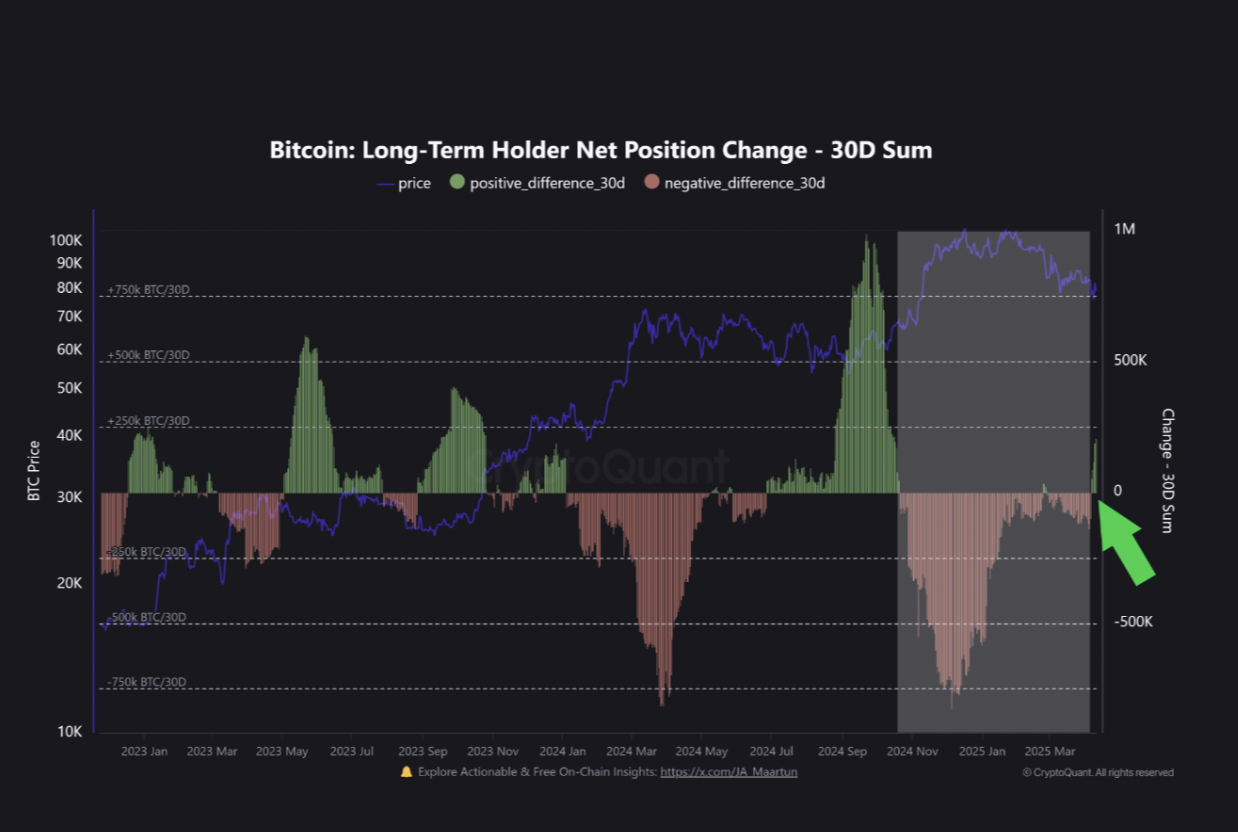
BTC’s Long-Term Holder Net Position Change tracks the buying and selling behavior of LTHs (those who have held their assets for at least 155 days) to measure the shift in the number of coins held by these investors over a specific period.
When its value is positive, it indicates that LTHs are not selling, and remain optimistic about BTC’s future price performance. Conversely, when it turns negative, it suggests that these holders are selling or distributing their coins, often in response to market pressures, which is a bearish signal.
According to Kesmeci, BTC’s Long-Term Holder Net Position Change (30d sum) flipping positive is notable. This metric had remained below zero since October last week, signaling that LTHs were consistently selling their BTCs.
The sellofs reached their lowest point on December 5, prompting a 32% dip in BTC’s price and marking the peak of a 6-month period of distribution by LTHs.
However, this trend has changed since April 6. The metric now sits above zero and is in an uptrend. Speaking on what this means, Kemesci added:
“While it’s too early to say definitively, the growing positive momentum in this metric could be a sign that long-term conviction is returning to the market.”
Moreover, BTC’s funding rate has remained positive amid its price troubles, confirming the bullish outlook above. At press time, this is at 0.0037%.
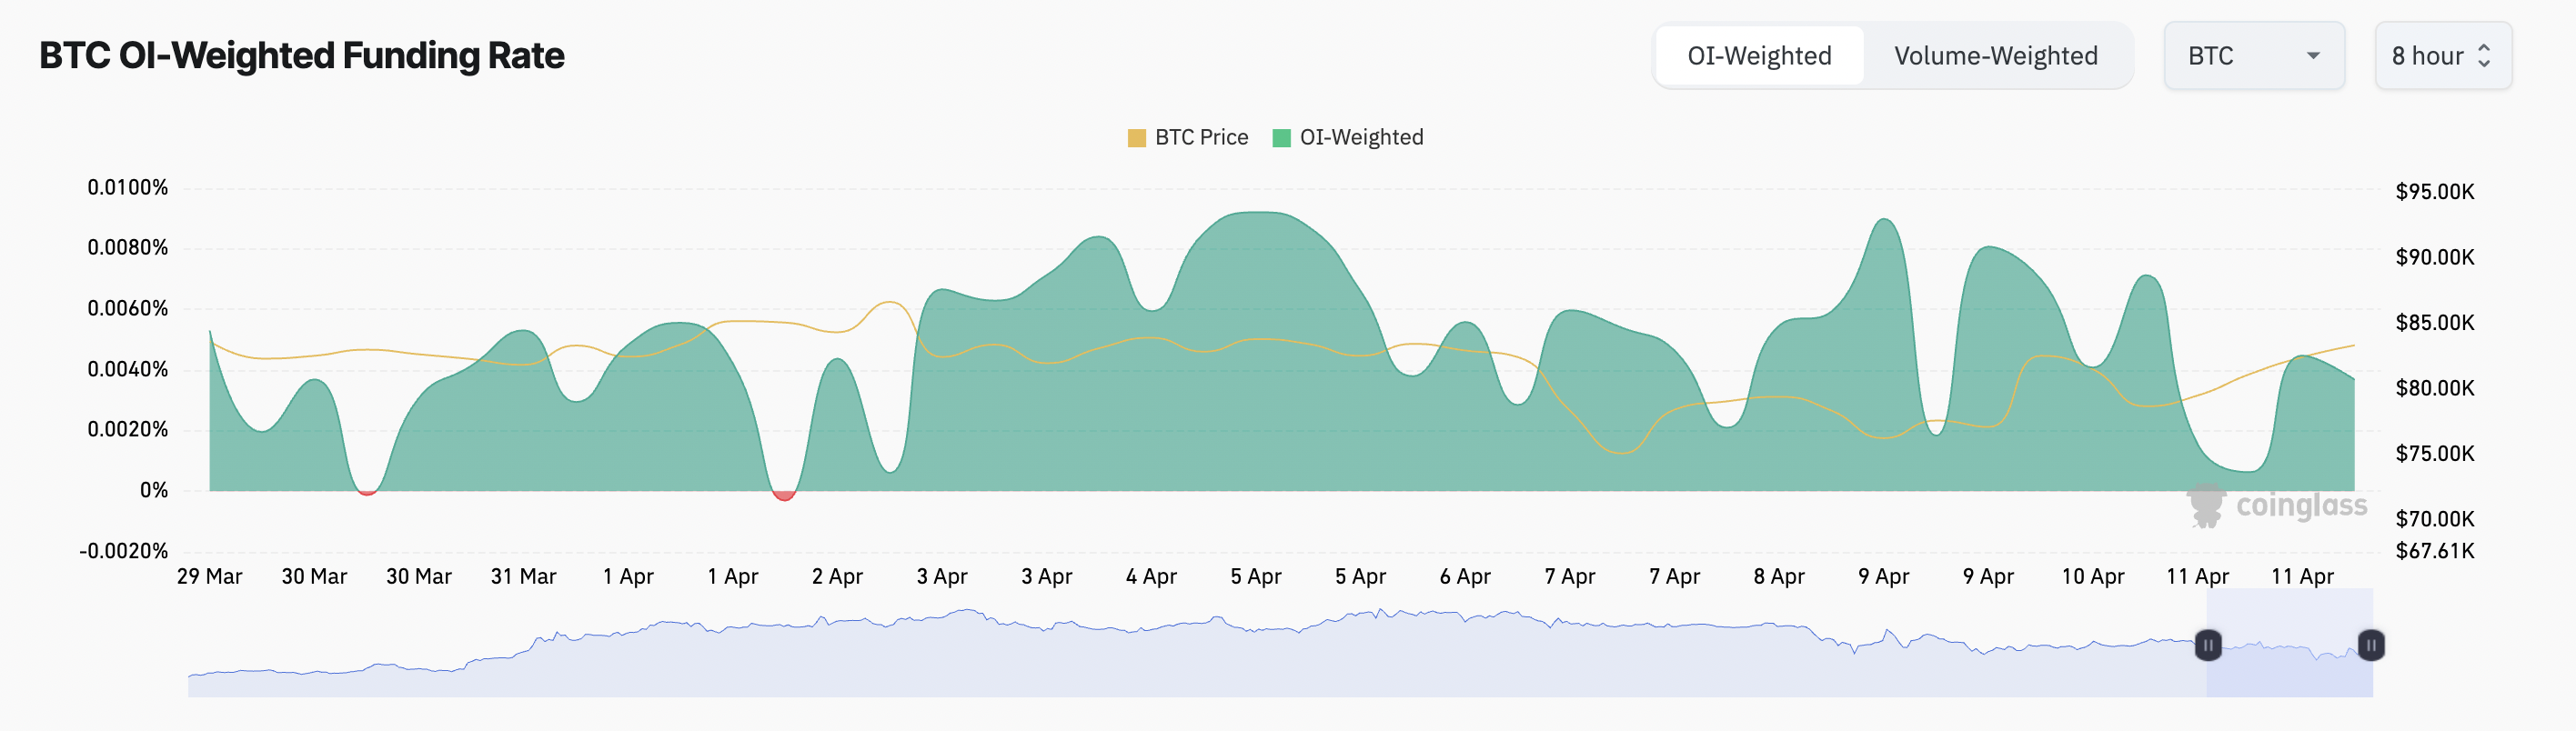
The funding rate is the periodic payment exchanged between long and short traders in perpetual futures markets. It is designed to keep the futures price close to the underlying asset’s spot price.
When it is positive like this, long traders are paying short traders. This indicates a bullish market sentiment, as more traders are betting on BTC’s price to climb.
Long-Term Holders Set the Stage for $87,000 Run
The surge in accumulation from BTC LTHs has pushed the coin’s price above the key resistance at $81,863. At press time, the king coin trades at $83,665.
As the market responds to these sustained buying pressures from LTHs, the coin’s price may be primed for a significant rally in the near future.
If retail traders follow suit and increase their coin demand, BTC could break above $85,000 to $87,730.
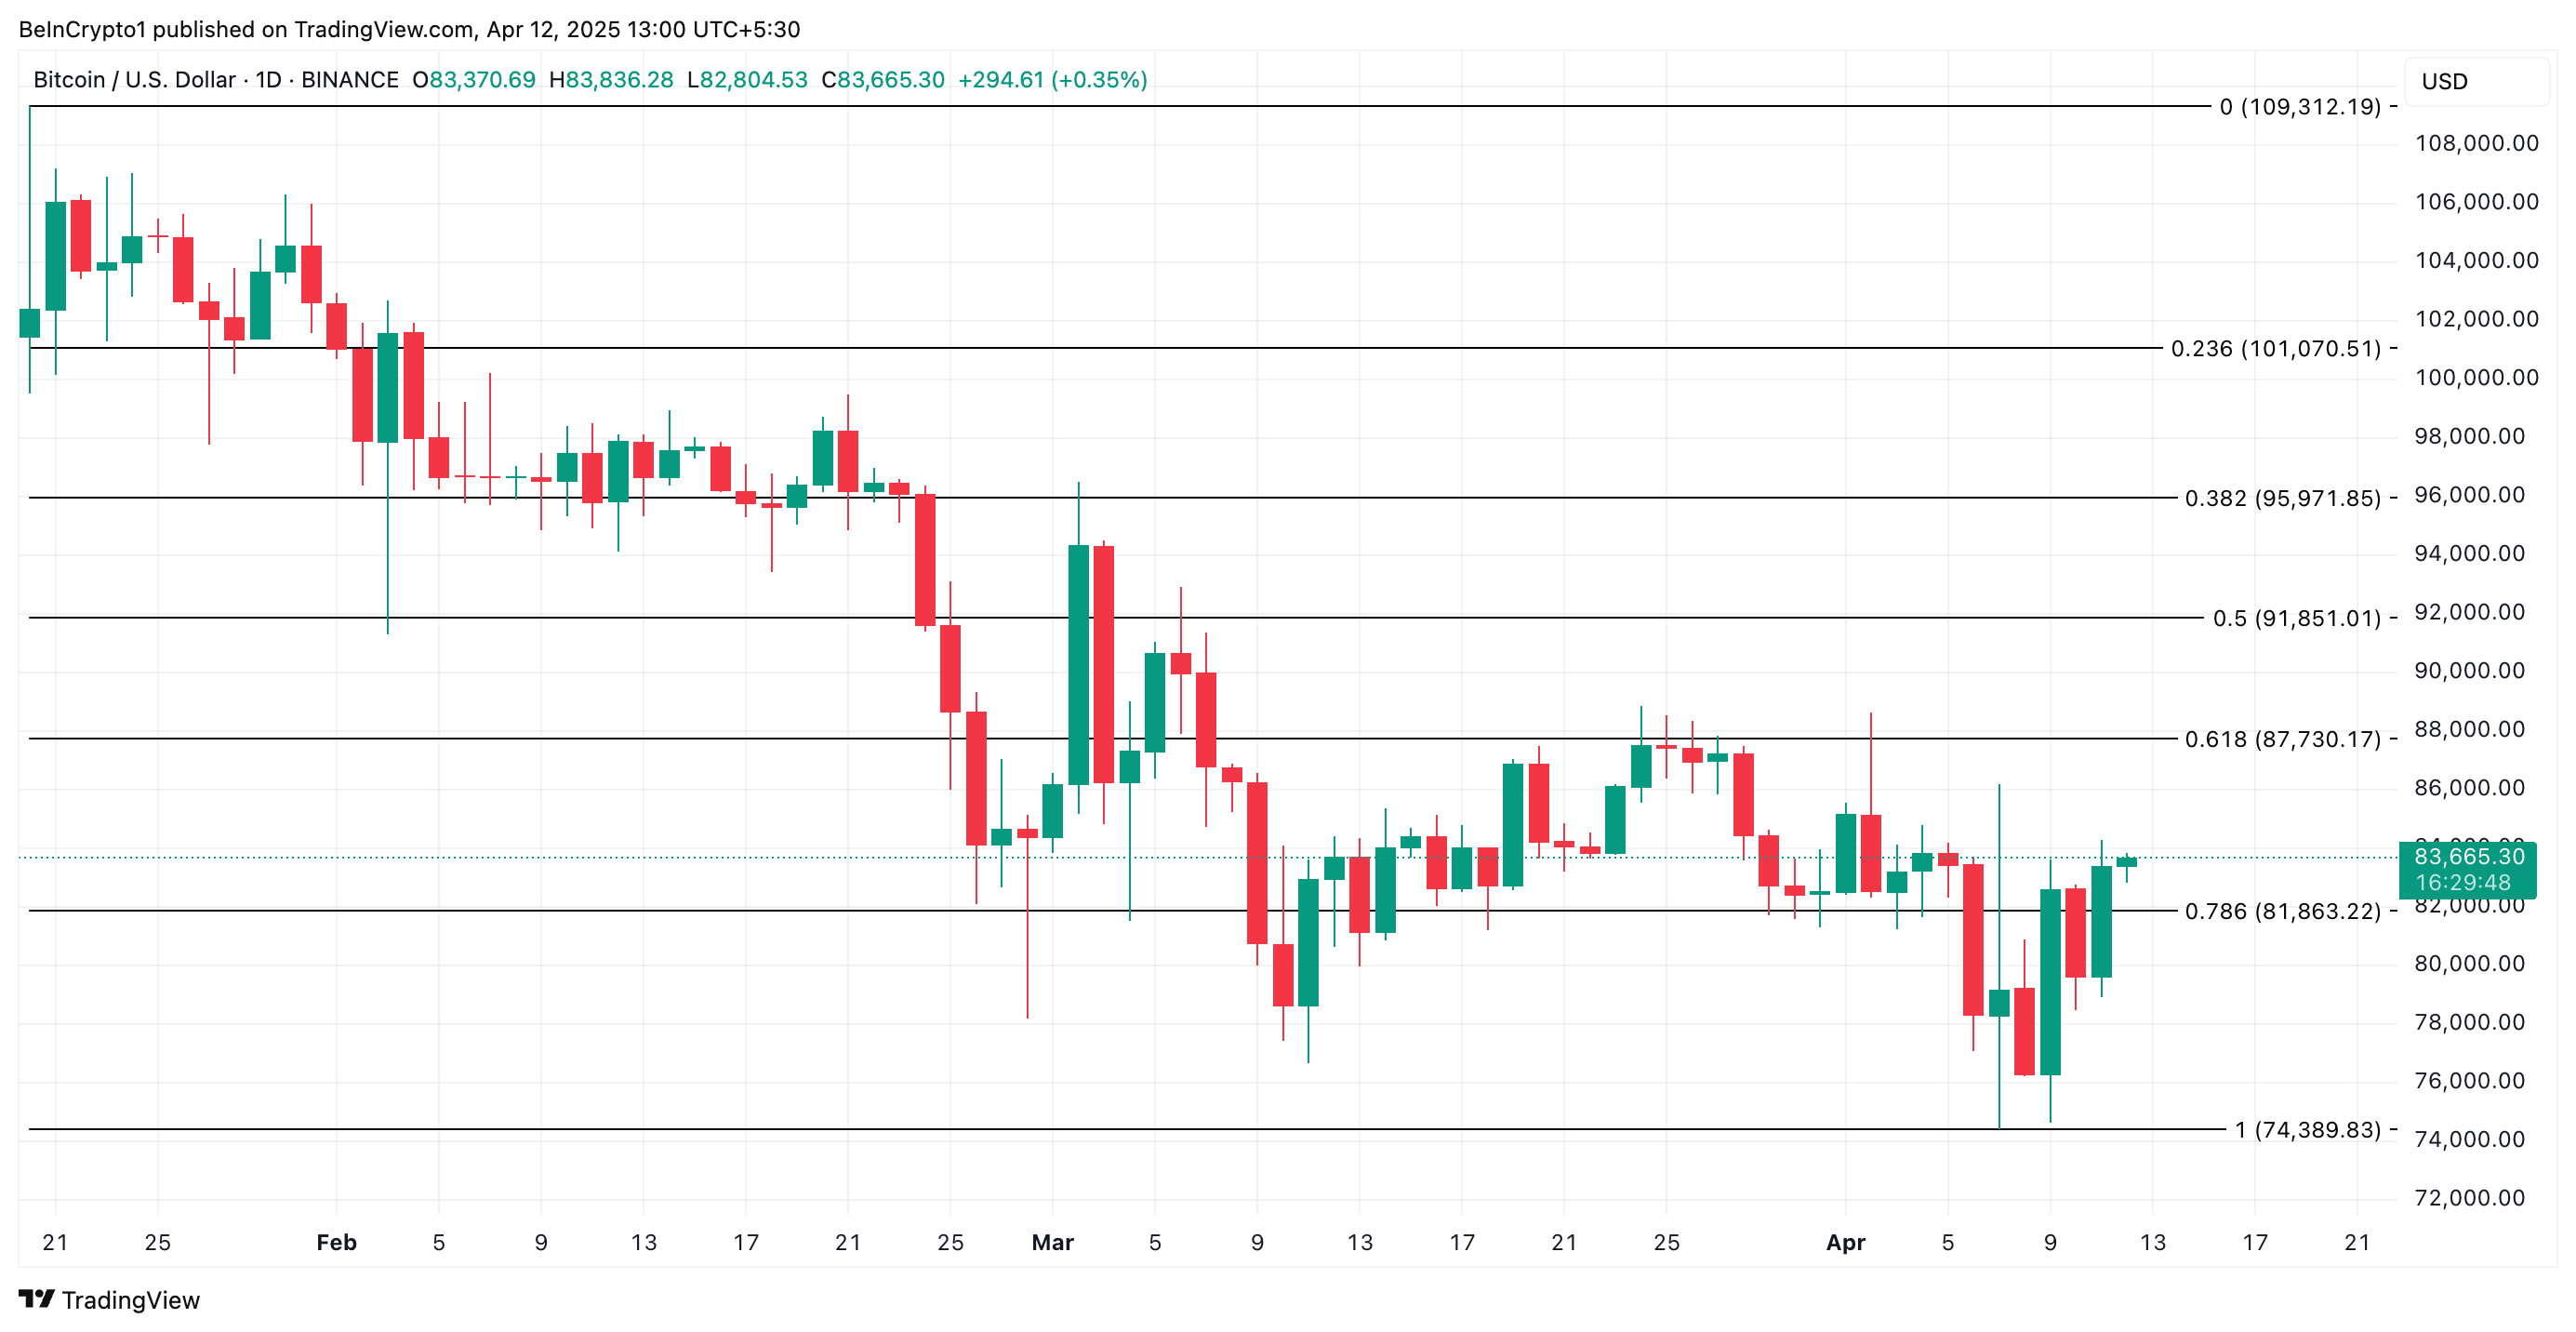
However, if the accumulation trend ends and these LTHs begin to sell for gains, BTC could resume its decline, fall below $81,863, and drop toward $74,389.
Disclaimer
In line with the Trust Project guidelines, this price analysis article is for informational purposes only and should not be considered financial or investment advice. BeInCrypto is committed to accurate, unbiased reporting, but market conditions are subject to change without notice. Always conduct your own research and consult with a professional before making any financial decisions. Please note that our Terms and Conditions, Privacy Policy, and Disclaimers have been updated.


Africa’s crypto narrative is maturing from informal peer-to-peer (P2P) trading to institution-ready infrastructure. BeInCrypto contacted Luno, a crypto exchange headquartered in South Africa that operates across over 40 global markets.
Luno’s general manager for Africa and Europe, Marius Reitz, tells BeInCrypto how the crypto exchange is positioning itself as a regional powerhouse in Africa.
Luno As Africa’s Pragmatic Pioneer
Reitz started by revealing that Luno has outlived the boom-and-bust cycles that have come to define crypto since its establishment in 2013.
Its early focus on regulatory alignment and user-friendly experiences set it apart in an industry often plagued by volatility and regulatory whiplash.
In Africa, 57% of the population remains unbanked. Based on this, Luno’s mission goes beyond trading. The exchange crafts access to a modern financial system many have been locked out of.
“We’re driven by a bold vision to upgrade Africa and the world to a better financial system. After our launch in Kenya in 2024, we’re just getting started,” Reitz told BeInCrypto.
Stablecoin Surge and Real-World Demand
While much of the West obsesses over meme coins and ETF (exchange-traded fund) speculation, Africa’s crypto story is rooted in pragmatism.
In South Africa, stablecoins like Tether’s USDT have now surpassed Bitcoin in trading volume. According to Reitz, this surge is driven by the demand for inflation-resistant, dollar-pegged assets amid local currency devaluation.
Luno, already a major on-ramp for fiat-to-crypto conversions in the region, is adapting fast.
“Over the last 12 months, we’ve seen significant demand for stablecoins on Luno. We now offer low-cost USDT transfers across Ethereum and Tron, with competitive fees and bulk trade options for professionals via our Trade Desk,” Reitz shared.
Additionally, Luno’s retail-oriented Luno Pay app integrates crypto into everyday life. South African users can now spend USDT and USDC at thousands of merchants, earning crypto-back rewards.
Regulation as a Catalyst, Not a Constraint
Unlike many exchanges that shun regulatory scrutiny, Luno embraces it. In South Africa, where crypto assets are now classified as financial products by the FSCA, Luno has secured its operating license and helped shape its framework.
“Crypto bans force the industry underground. We’ve observed that markets with regulatory clarity foster responsible innovation and consumer protection,” he explained.
However, challenges remain. If misaligned with market realities, South Africa’s upcoming classification of crypto assets as foreign or domestic investments could hinder institutional flows.
Meanwhile, the FATF Travel Rule poses technical and operational hurdles due to fragmented provider ecosystems. Still, Luno is prepared.
“As a regulated business, we’ve implemented the Travel Rule in other jurisdictions. We anticipate friction, but we’re ready,” Reitz articulated.
The FATF Travel Rule is set to take effect in May 2025, barely a month away.
Adapting to Fragmented African Realities
Across the continent, crypto adoption is outpacing infrastructure. Nigeria ranked second globally for crypto adoption, but this remains paradoxical as the country restricts naira P2P trading while fast-tracking exchange approvals under its ARIP framework.
For Luno, this means taking a hyper-local approach to compliance, education, and user experience.
“Africa faces significant challenges: regulatory fragmentation, limited banking infrastructure, and crypto-related scams. We address these with educational content, strong KYC/AML, and strong banking partnerships,” Reitz explained.
Mobile money is dominant in countries like Kenya and Nigeria. Luno’s mobile-native design and stablecoin access offer a compelling value proposition for both retail users and remittance providers.
Financial Inclusion, One Partnership at a Time
Beyond individual users, Luno is also becoming a key partner for fintechs and payment firms. Its custody and liquidity services now support cross-border on- and off-ramping for traditional and crypto-native partners.
“We receive inquiries from large multinationals wanting to shift part of their payments to crypto. Our infrastructure allows them to do so securely, compliantly, and efficiently Luno confirmed,” Reitz stated.
This is pivotal for Africa’s $48 billion annual remittance market, where stablecoins offer faster, cheaper alternatives to legacy systems.
What does the next five years look like for African crypto markets? For Luno, it’s a convergence of retail empowerment and institutional maturity.
“We expect crypto to become as ubiquitous as banks—used to save, invest, and transact. Stablecoins will anchor trade settlements, while ETFs and bank-based crypto products will dominate mature markets like South Africa,” the Luno executive told BeInCrypto.
Luno is already laying the groundwork. Its Trade Desk, custody solutions, and upcoming stablecoin expansions suggest an exchange ready to grow from a user-friendly app to an institutional-grade platform.
In a region often overlooked by global players, Luno’s longevity is compelling. While challenges around regulation and infrastructure persist, its blend of compliance, innovation, and education positions it among notable actors in Africa’s crypto arena.
Disclaimer
In adherence to the Trust Project guidelines, BeInCrypto is committed to unbiased, transparent reporting. This news article aims to provide accurate, timely information. However, readers are advised to verify facts independently and consult with a professional before making any decisions based on this content. Please note that our Terms and Conditions, Privacy Policy, and Disclaimers have been updated.

Arthur Hayes Expects Bitcoin Surge if Fed Injects Liquidity

Shiba Inu Burn Rate Explodes 1000%, Can SHIB Price Hit $0.000015?

Bitcoin Long-Term Holders Fuel Surge, Could BTC Hit $85,000?
Dogecoin Price Gearing for A 3X Rally Amid DOGE Whale Accumulation

SEC Abandons Case Against Nova Labs

How Luno is Shaping Africa’s Crypto Future

2.52 Million Altcoins Are Ruining Crypto’s Future

Animoca Brands Valuation Tanks 75% In Two Years, Here’s Why

Crypto exchange BingX hacked for $43 million

Are The Big Players Losing Interest?

Hong Kong’s Securities Association Tips Authorities On Crypto Self-Regulation

Coinbase cbBTC Set to go Live on Solana
2.52 Million Altcoins Are Ruining Crypto’s Future
Animoca Brands Valuation Tanks 75% In Two Years, Here’s Why
Crypto exchange BingX hacked for $43 million
Are The Big Players Losing Interest?
Hong Kong’s Securities Association Tips Authorities On Crypto Self-Regulation
Coinbase cbBTC Set to go Live on Solana
-

 Market22 hours ago
HBAR Buyers Fuel Surge with Golden Cross, Suggesting Upside
-

 Market21 hours ago
China Raises Tariffs on US to 125%, Crypto Markets Steady
-

 Market23 hours ago
MiCA Boosts Gemini’s Expansion Plans Across Europe
-

 Regulation17 hours ago
US Senators Reintroduce PROOF Act To Set Reserve Standards for Crypto Firms
-

 Market16 hours ago
3 Altcoins to Watch for Binance Listing This April
-
 Altcoin23 hours ago
6.96 Billion Dogecoin In 24 Hours As DOGE Price Adds 1%
-

 Altcoin22 hours ago
Sonic Surges to $1 Billion TVL in 66 Days Amid DeFi Market Slump
-

 Bitcoin21 hours ago
Is Bitcoin Ready for Another Surge?