
Market
Ethereum Founder to Sell $37 Million in ETH Before ETF Decision

Recent significant Ethereum (ETH) transfers to cryptocurrency exchanges have caught the market’s attention. This move has raised speculation about potential profit-taking, portfolio rebalancing, or market speculation.
These developments coincide with the US Securities and Exchange Commission (SEC) nearing a decision on the Vaneck Ethereum exchange-traded fund (ETF), which has heightened expectations within the industry.
Investors Transfer ETH to Exchanges
Jeffrey Wilke, one of the founders of Ethereum, has transferred 10,000 ETH, worth around $37.38 million, to the cryptocurrency exchange Kraken. While the motive behind such a significant transfer is unclear, a few hypotheses can be derived from it.
- Profit Taking: Wilke may be selling off his tokens to realize profits. This could be due to achieving his desired return on investment or anticipating a potential downturn in the market.
- Rebalancing Portfolios: Wilke might be rebalancing his portfolios by selling some tokens and buying others. This could be based on changes in market conditions, project developments, or his investment strategy.
- Market Speculation: Wilke might be speculating on short-term price movements or taking advantage of arbitrage opportunities between different cryptocurrency exchanges.
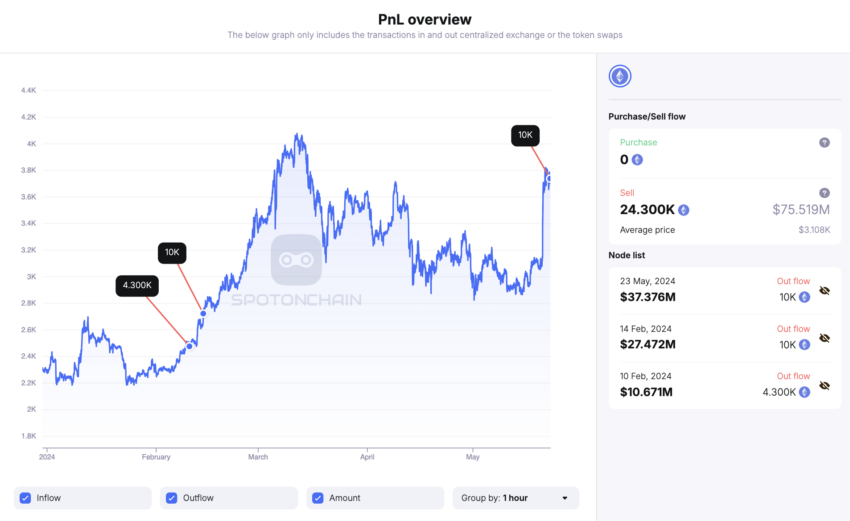
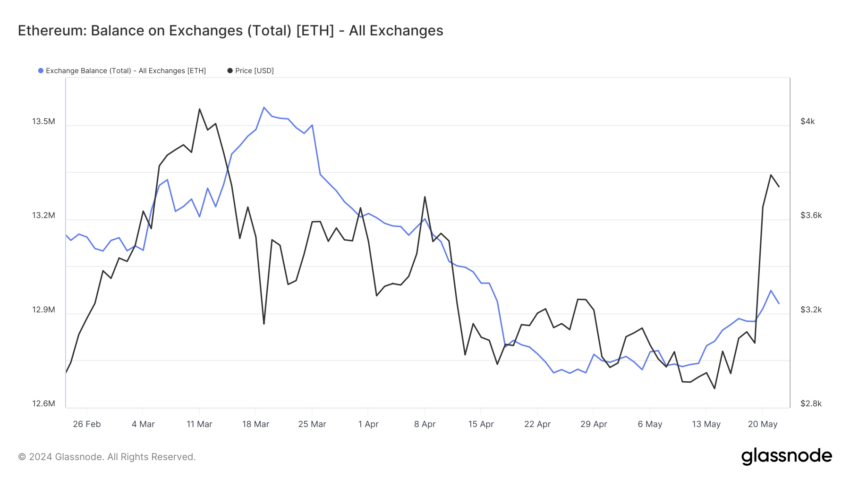
Whether Wilke aims to book profits, rebalance his portfolio, or speculate on the market, he appears not the only one. Looking at Ethereum’s balance on exchanges reveals a spike in the tokens available to sell.
- Balance on Exchanges: This refers to the total amount of Ethereum held in cryptocurrency exchange wallets.
Over the last two weeks, more than 242,000 ETH have moved to cryptocurrency exchange wallets. This indicates increased trading activity on exchanges that can contribute to price volatility.
Ethereum ETF Approval Looms
The timing of these transfers is notable, as it aligns with today’s SEC final ruling regarding the Vaneck Ethereum ETF. Interestingly, on May 20, the SEC requested Nasdaq, CBOE, and NYSE to refine their applications for listing spot Ethereum ETFs, hinting at a potential approval of these filings.
In response to this regulatory development, Eric Balchunas and James Seyffart, ETF analysts at Bloomberg Intelligence, remarked that the likelihood of approval has substantially increased, shifting from only 25% to a considerable 75%.
“Hearing chatter this afternoon that the SEC could be doing a 180 on this increasingly political issue, so now everyone is scrambling. But again, we cap it at 75% until we see more, e.g., filing updates,” Balchunas wrote.
Read more: Ethereum ETF Explained: What It Is and How It Works
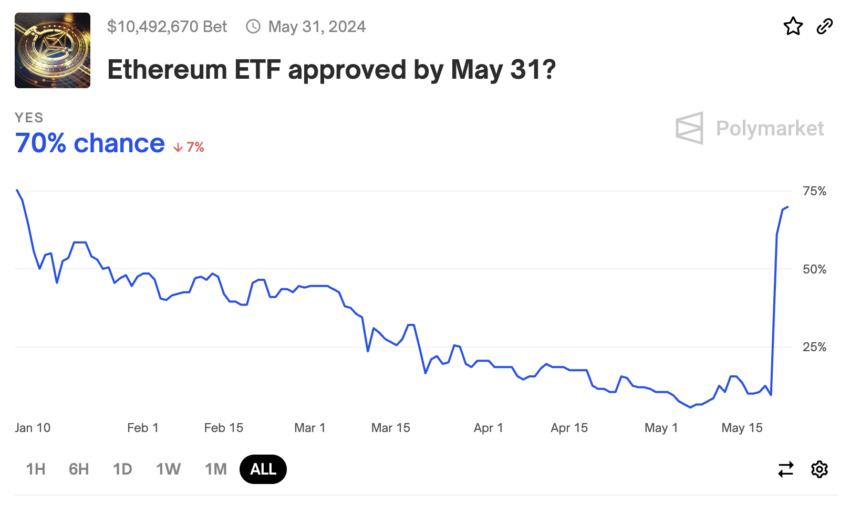
Similarly, Polymarket, a decentralized prediction market platform that allows users to place bets on world events, shows a significant increase in approval odds, which have risen from 10% to 70% over the past 72 hours.
Warning Signal for Traders
Although industry leaders like Anthony Pompliano see the Ethereum ETF approval as an “approval of the entire industry” and as “the last dam to be broken,” traders must be cautious. The increasing ETH deposits to cryptocurrency exchange wallets hint at the possibility of a sell-off or a spike in profit-taking.
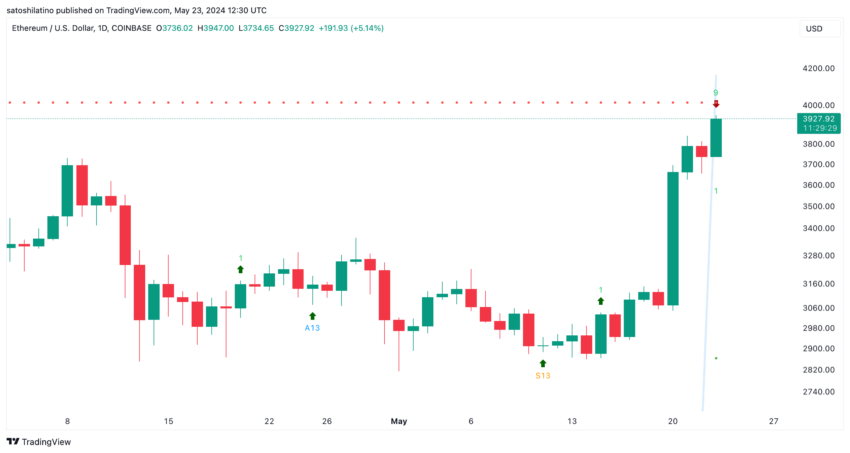
Meanwhile, the Tom DeMark (TD) Sequential indicator presents a sell signal on Ethereum’s daily chart.
- TD Sequential Indicator: This is a technical analysis tool used to identify potential market trend exhaustion points and upcoming price reversals.
- Setup Phase: This involves counting a series of nine consecutive price bars, where each bar closes higher (for an uptrend) or lower (for a downtrend) than the bar four periods earlier.
- Countdown Phase: Following the setup phase, a countdown begins where a series of thirteen additional price bars are counted if they close lower (in a downtrend) or higher (in an uptrend) than the close two bars earlier.
The current green nine candlestick on the daily chart suggests that a spike in selling pressure could see Ethereum retrace for one to four daily candlesticks or even start a new downward countdown phase before the uptrend resumes.
Despite the bearish signals seen from an on-chain and technical perspective, the In/Out of the Money Around Price (IOMAP) indicator suggests that Ethereum is above significant areas of support that could hold in the event of a correction.
- IOMAP: This metric helps analyze and visualize the distribution of holders’ positions relative to the current price. It helps understand the potential support and resistance levels based on the number of addresses holding a particular cryptocurrency at different price levels.
- In the Money: Refers to addresses that acquired the cryptocurrency at a price lower than the current market price, indicating potential support levels as holders are likely to sell at a profit.
- Out of the Money: Refers to addresses that acquired the cryptocurrency at a price higher than the current market price, indicating potential resistance levels as holders might want to break even or minimize losses.
Based on the IOMAP, over 1.81 million addresses bought around 1.66 million ETH between $3,820 and $3,700. This demand zone could keep Ethereum’s price at bay amid increasing selling pressure. But if it fails to hold, the next key area of support is between $3,580 and $3,462, where 3.13 million addresses purchased over 1.50 million ETH.
Read more: Ethereum (ETH) Price Prediction 2024/2025/2030
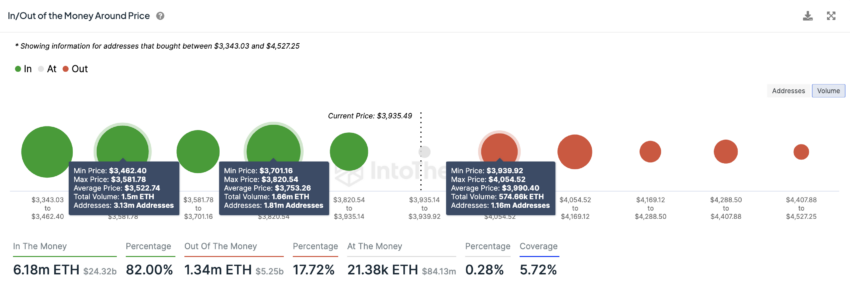
On the other hand, the most important resistance barrier for Ethereum is between $3,940 and $4,054. Here, over 1.16 million addresses had previously purchased around 574,660 ETH.
If Ethereum overcomes this hurdle and prints a daily candlestick close above $4,170, the bearish outlook will be invalidated. This could result in a new upward countdown phase toward $5,000.
Summary and Conclusions
Ethereum co-founder Jeffrey Wilke’s recent transfer of 10,000 ETH to Kraken is indicative of broader market activities, where investors are moving significant amounts of ETH to exchanges. This trend aligns with increased trading activity, suggesting potential profit-taking, portfolio rebalancing, or market speculation among Ethereum holders. The balance of ETH on exchanges has spiked, indicating a potential rise in market volatility.
This market movement comes at a critical time, as the SEC is about to make a final ruling on Vaneck’s Ethereum ETF. Analysts have noted a substantial increase in the likelihood of approval, which has surged from 25% to 75%. Such regulatory developments are seen as a positive signal for the broader cryptocurrency market, potentially paving the way for further institutional investment.
Read more: How to Buy Ethereum (ETH) and Everything You Need to Know
Despite technical indicators suggesting a possible short-term bearish trend, the IOMAP indicator shows strong support levels for Ethereum. This suggests that while there may be short-term corrections, the underlying demand for Ethereum remains robust. Long-term holders appear confident, continuing to accumulate ETH, which bodes well for its future price stability and growth.
Disclaimer
In line with the Trust Project guidelines, this price analysis article is for informational purposes only and should not be considered financial or investment advice. BeInCrypto is committed to accurate, unbiased reporting, but market conditions are subject to change without notice. Always conduct your own research and consult with a professional before making any financial decisions. Please note that our Terms and Conditions, Privacy Policy, and Disclaimers have been updated.


According to a new report from Pine Analytics, token deployers on Pump.fun systematically funded sniper wallets to buy their own meme coins. This impacted over 15,000 token launches on the platform.
These sniper wallets operated primarily during US trading hours, executing standardized, profitable strategies. Unrelated bot activity obscures their behavior, making it extremely difficult to isolate these wallets—and they can readily adapt to new countermeasures.
Snipers Roam Free on Pump.fun Meme Coins
Pump.fun has remained one of the most popular meme coin launchpads on Solana despite persistent controversies and other criticism.
However, Pine Analytics’ new report has uncovered a new controversy, discovering systematic market manipulation on the platform. These snipes include as much as 1.75% of all launch activity on Pump.fun.
“Our analysis reveals that this tactic is not rare or fringe — over the past month alone, more than 15,000 SOL in realized profit was extracted through this method, across 15,000+ launches involving 4,600+ sniper wallets and 10,400+ deployers. These wallets demonstrate unusually high success rates (87% of snipes were profitable), clean exits, and structured operational patterns,” it claimed.
Solana meme coin deployers on Pump.fun follow a consistent pattern. They fund one or more sniper wallets and grant them advance notice of upcoming token launches.
Those wallets purchase tokens in the very first block and then liquidate almost immediately—85% within five minutes and 90% in just one or two swap events.
Pump.fun meme coin developers exploit this tactic to create the appearance of immediate demand for their tokens. Retail investors, unaware of the prior sell‑off, often purchase these tokens after the snipe, giving developers an unfair advantage. This constitutes market manipulation and erodes trust in the platform.
Pine Analytics had to carefully calibrate its methods to identify genuine snipers. Apparently, 50% of meme coin launches on Pump.fun involve sniping, but most of this is probably bots using the “spray and pray” method.
However, by filtering out snipers with no direct links to developer wallets, the firm missed projects that covered their tracks through proxies and burners.
In other words, the meme coin community does not have adequate defenses against systematic abuse on Pump.fun. There are a few possible ways that the platform could flag repeat offenders and sketchy projects, but adaptive countermeasures could defeat them. This problem demands persistent and proactive action.
Unfortunately, it may be difficult to enact such policies. Meme coin sniping is so systematic that Pump.fun could only fight it with real commitment.
Analysts think that building an on-chain culture that rewards transparency over extraction is the best long-term solution. A shift like that would be truly seismic, and the meme coin sector might not survive it.
Disclaimer
In adherence to the Trust Project guidelines, BeInCrypto is committed to unbiased, transparent reporting. This news article aims to provide accurate, timely information. However, readers are advised to verify facts independently and consult with a professional before making any decisions based on this content. Please note that our Terms and Conditions, Privacy Policy, and Disclaimers have been updated.
Solana (SOL) continues to show strength across multiple fronts, maintaining a bullish structure on its Ichimoku Cloud chart while gaining momentum in key market metrics. The BBTrend indicator has turned higher again, signaling renewed buying pressure after a brief cooldown.
On-chain activity remains strong, with Solana leading all blockchains in DEX volume and dominating fee generation thanks to the explosive growth of meme coins and launchpad activity. With SOL now trading above a key resistance level, the path is open for further upside—though a loss of momentum could still trigger a retest of lower supports.
Solana Maintains Bullish Structure, but Momentum Faces Key Test
On Solana’s Ichimoku Cloud chart, the price is currently above the Kijun-sen (red base line) but has dipped below the Tenkan-sen (blue conversion line), signaling weakening short-term momentum.
The flattening Tenkan-sen and price behavior suggest possible consolidation or the early stages of a pullback. Still, with the price holding above the Kijun-sen, medium-term support remains intact.
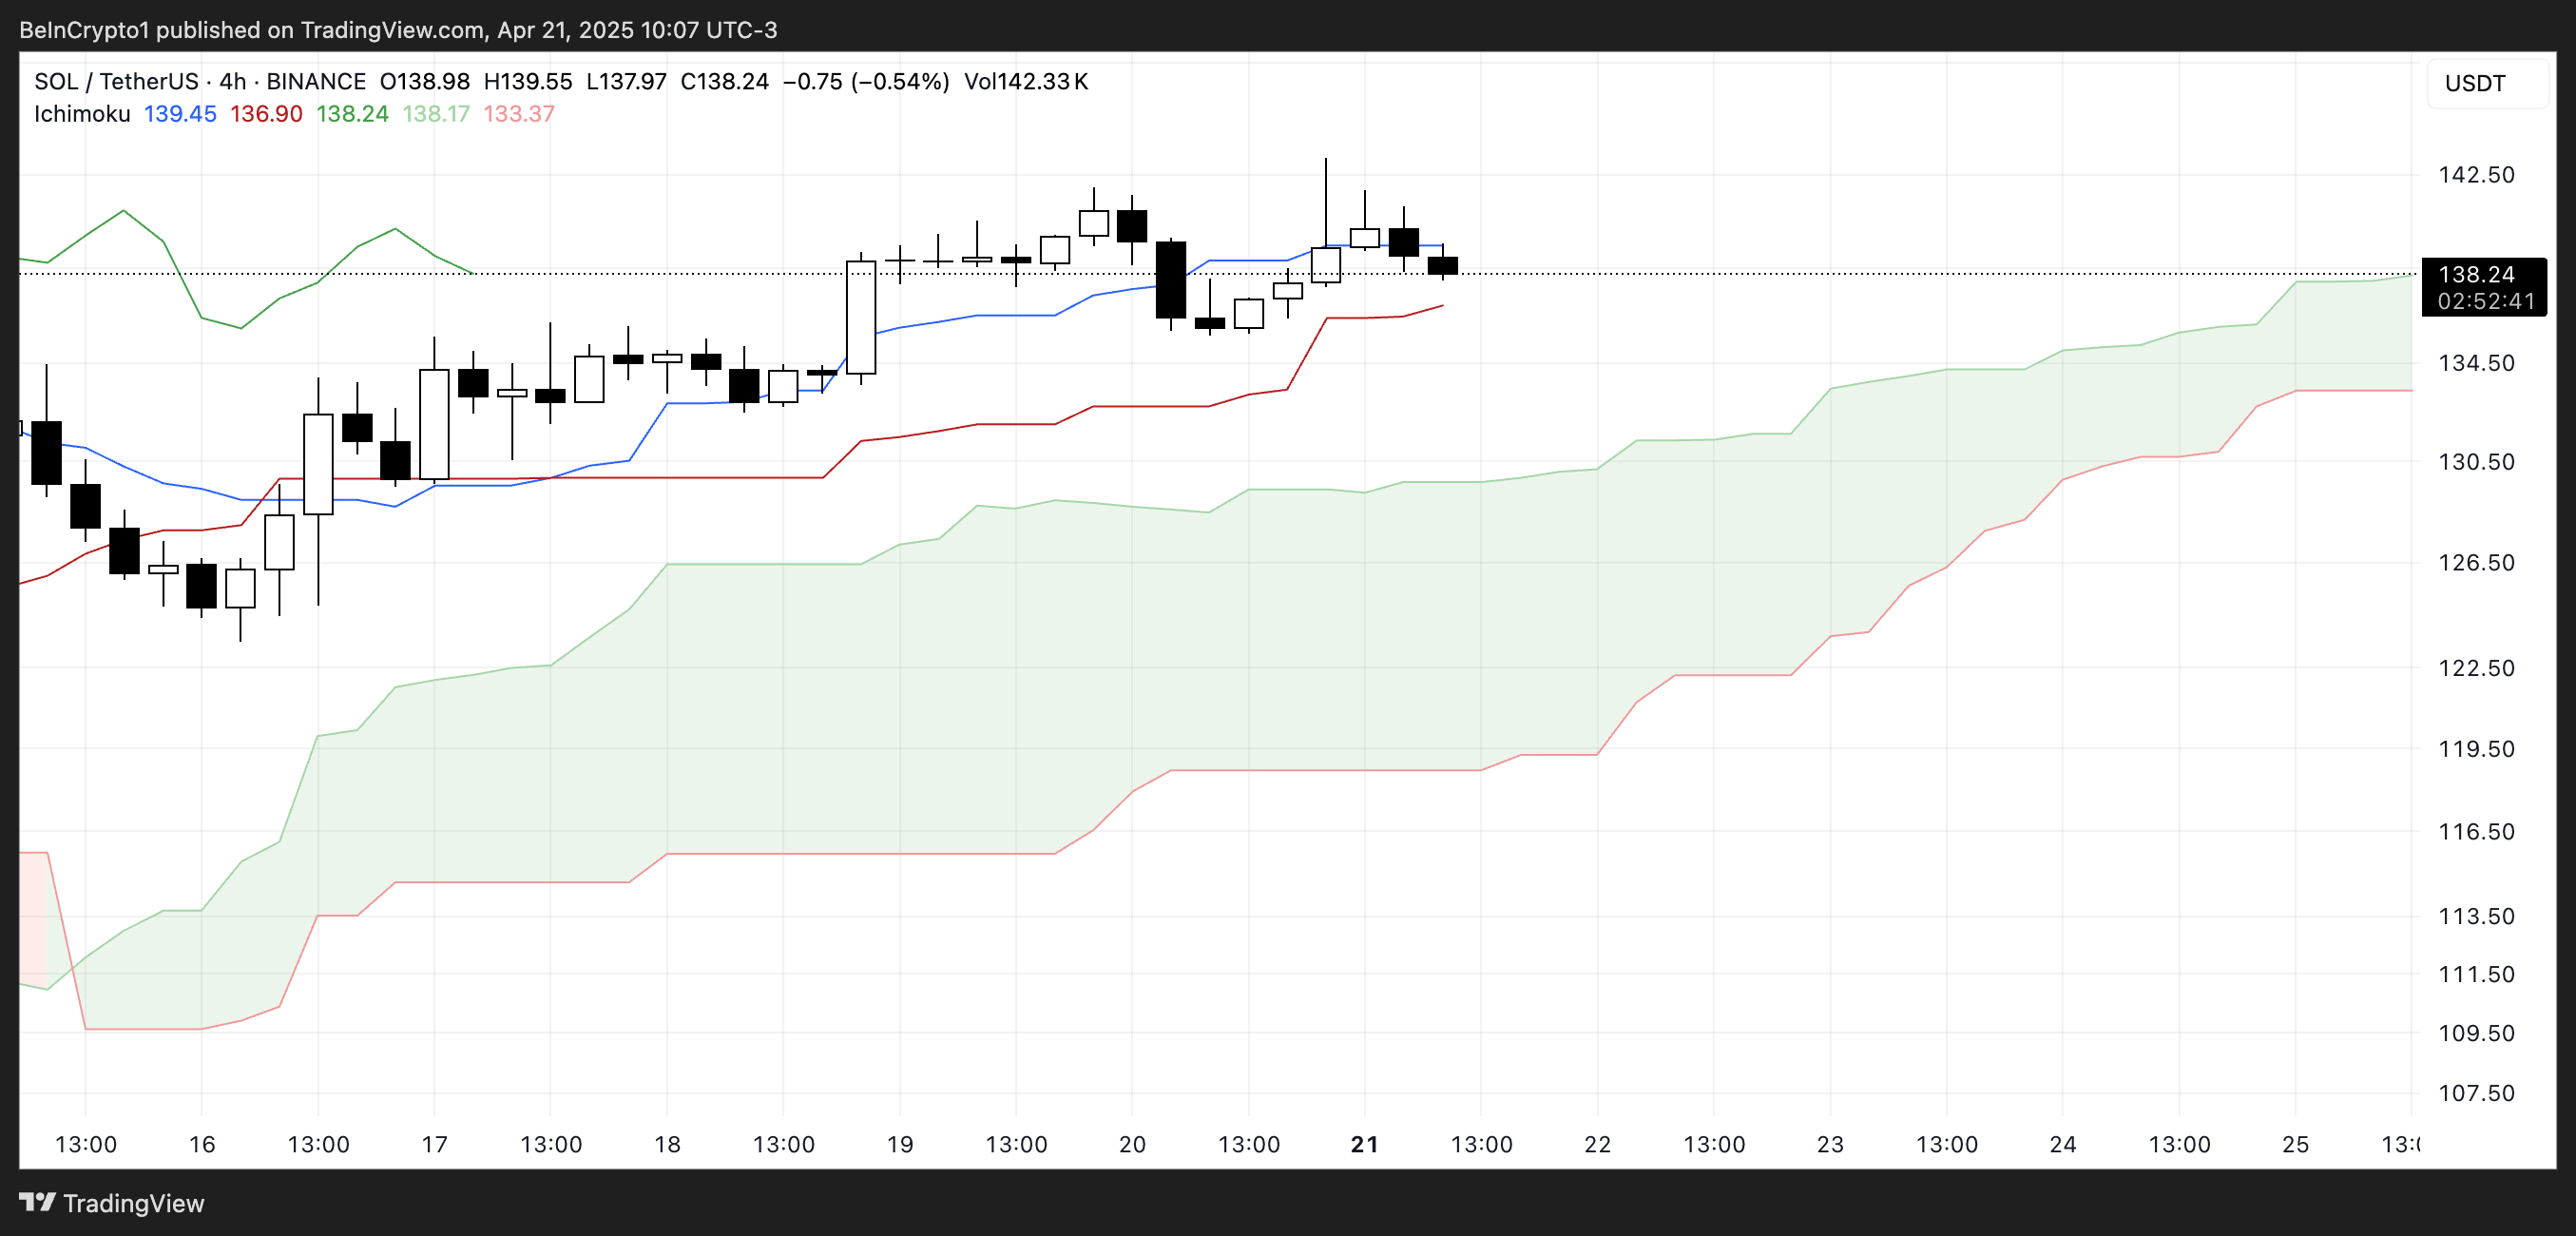
The overall Ichimoku structure remains bullish, with a thick, rising cloud and leading span A well above span B—indicating strong underlying support.
If Solana finds support at the Kijun-sen and climbs back above the Tenkan-sen, the uptrend could regain strength; otherwise, a test of the cloud’s upper boundary may follow.

Meanwhile, Solana’s BBTrend is currently at 6, extending nearly ten days in positive territory after peaking at 17.5 on April 14. The recent increase from 4.26 to 6 suggests renewed bullish momentum following a brief cooldown.
BBTrend, or Bollinger Band Trend, tracks the strength of price movement based on Bollinger Band expansion.
Positive values like the current one point to an active uptrend, and if the BBTrend continues to rise, it could signal stronger momentum and potential for another upward move.
Solana Dominates DEX Volume and Fee Generation as Meme Coins Drive Ecosystem Growth
Solana has once again claimed the top spot among all chains in DEX volume, recording $15.15 billion over the past seven days. The combined total of Ethereum, BNB, Base, and Arbitrum reached $22.7 billion.

In the last 24 hours alone, Solana saw $1.67 billion in volume, largely fueled by its booming meme coin ecosystem and the ongoing launchpad battle between PumpFun and Raydium. Adding to this good momentum, Solana recently surpassed Ethereum in Staking Market Cap.

When it comes to application fees, Solana’s momentum is just as clear. Four of the top ten fee-generating apps over the past week—PumpFun, Jupiter, Jito, and Meteora—are Solana-focused.
Pump leads the pack with nearly $18 million in fees alone.
Solana Breaks Key Resistance as Uptrend Targets Higher Levels, but Risks Remain
Solana has finally broken above its key resistance at $136, flipping it into a new support level that was successfully tested just yesterday.
Its EMA lines remain aligned in a bullish setup, suggesting the uptrend is still intact.
If this momentum continues, SOL price could aim for the next resistance zones at $147 and $152—levels that, if breached, open the door to a potential move toward $179.
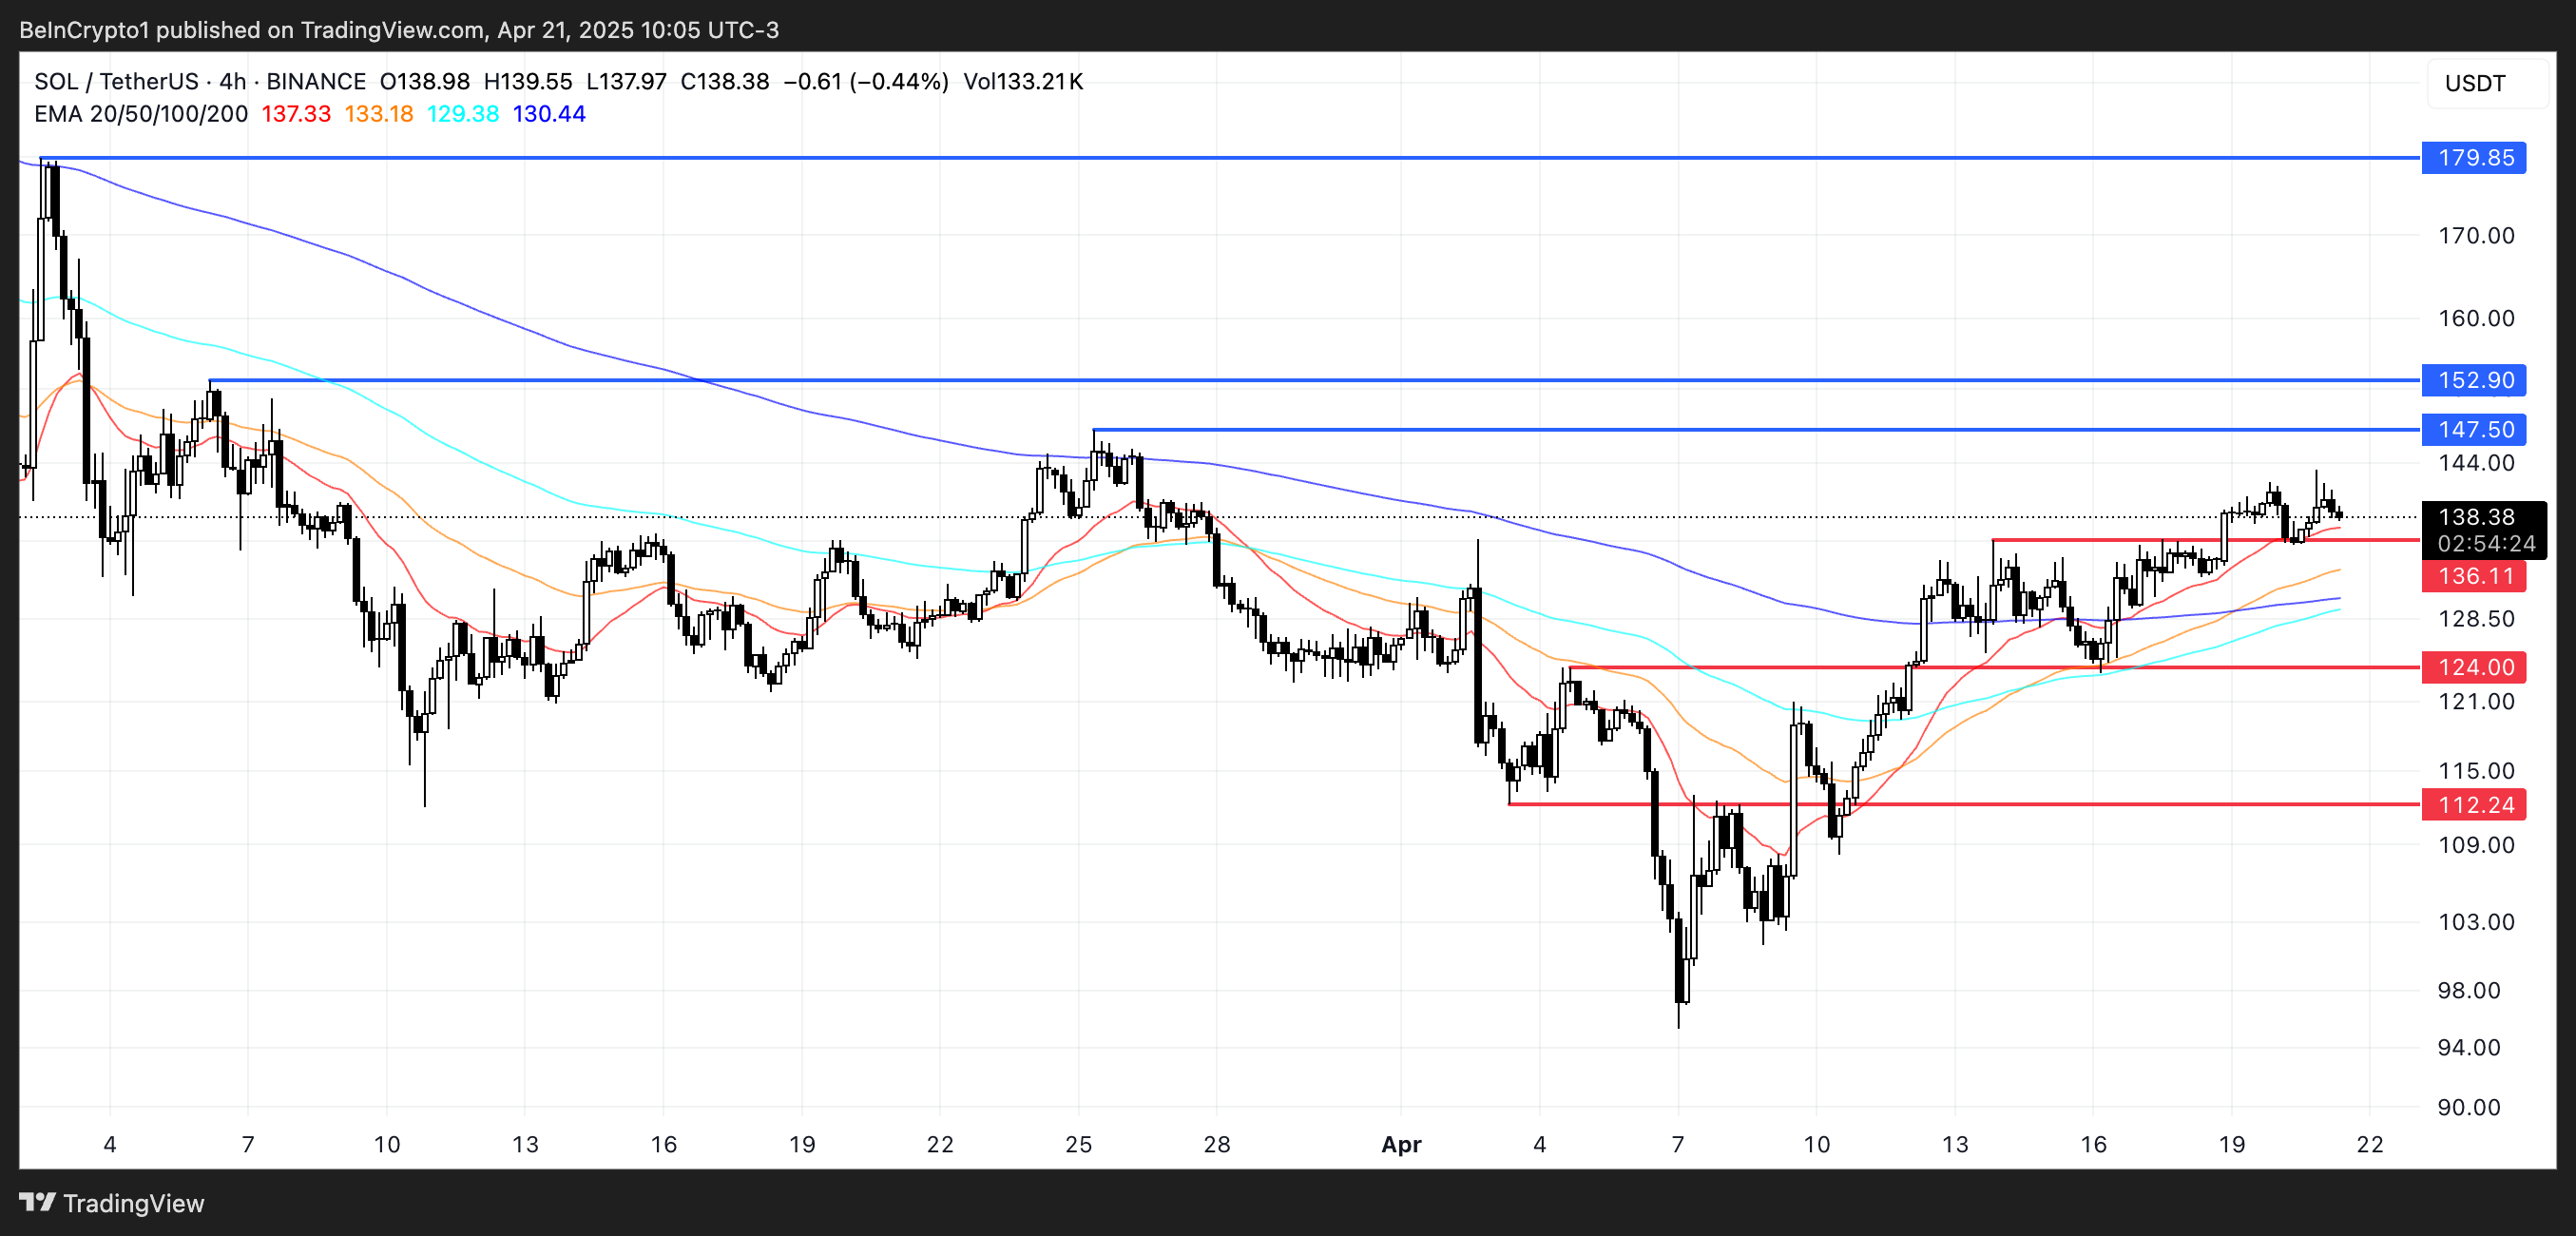
The current structure favors buyers, with higher lows and strong support reinforcing the trend.
However, if momentum fades, a retest of the $136 support is likely.
A breakdown below that level could shift sentiment, exposing Solana to deeper pullbacks toward $124 and even $112.
Disclaimer
In line with the Trust Project guidelines, this price analysis article is for informational purposes only and should not be considered financial or investment advice. BeInCrypto is committed to accurate, unbiased reporting, but market conditions are subject to change without notice. Always conduct your own research and consult with a professional before making any financial decisions. Please note that our Terms and Conditions, Privacy Policy, and Disclaimers have been updated.

According to a new report, 15 firms and individuals from the crypto industry donated more than $100,000 to President Trump’s Inauguration, totaling over $85 million.
Almost all of these companies apparently received direct or indirect benefits from Trump’s administration. This includes dropped legal proceedings, lucrative business partnerships, participation in Trump’s Crypto Summit, and more.
Crypto Industry Went All-In on Trump’s Inauguration
Since promising to bring friendlier regulations on the campaign trail, Donald Trump attracted a reputation as the Crypto President.
Trump’s Inauguration festivities included a “Crypto Ball,” and several prominent firms made donations for these events. Today, a report has compiled all crypto-related contributions of over $100,000, revealing some interesting facts.

Since taking office, President Trump and his family have been allegedly involved in prominent crypto controversies, and these donations may be linked to several of them.
For example, eight of the donors, Coinbase, Crypto.com, Uniswap, Yuga Labs, Kraken, Ripple, Robinhood, and Consensys, had SEC investigations or lawsuits against them closed since Trump’s term began.
The commission might have dropped its probe against these companies anyway due to its changing stance on crypto enforcement. However, being in the President’s good books likely helped the process.
Further Alleged Benefits for Donors
In other words, nearly half the firms that made donations to Trump’s Inauguration have seen their legal problems cleared up quickly. This isn’t the only regulation-related benefit they allegedly received.
Circle, for example, recently made an IPO after openly stating that Trump’s Presidency made it possible. Galaxy Digital received SEC approval for a major reorganization, a key step for a NASDAQ listing.
Other donors, such as Crypto.com and ONDO, got more direct financial partnerships with businesses associated with the Trump family.
Previously, Ripple’s CEO, Brad Garlinghouse, anticipated a crypto bull market under Trump. Also, XRP, Solana, and Cardano were all unexpectedly included in the US Crypto Reserve announcement.
All three of these companies made major donations to Trump’s Inauguration.
It seems that most of the firms involved got at least some sort of noticeable benefit from these donations. Donors like Multicoin and Paradigm received invitations to Trump’s Crypto Summit, while much more prominent groups like the Ethereum Foundation got snubbed.
Meanwhile, various industry KOLs and community members have already alleged major corruption in Trump’s crypto connections.
While some allegations might lack substantial proof, the crypto space has changed dramatically under the new administration, for both good and bad.
Disclaimer
In adherence to the Trust Project guidelines, BeInCrypto is committed to unbiased, transparent reporting. This news article aims to provide accurate, timely information. However, readers are advised to verify facts independently and consult with a professional before making any decisions based on this content. Please note that our Terms and Conditions, Privacy Policy, and Disclaimers have been updated.

Report Alleges Massive Meme Coin Sniping on Pump.fun

Solana Leads Blockchain Metrics as SOL Momentum Builds

Crypto Firms Donated $85 million in Trump’s Inauguration

Ethereum to Emphasize Layer-1 Efficiency and UX in Upcoming Protocol Upgrades

XRP Surpasses Ethereum In This Major Metric After Outperforming For 6 Months

PumpFun Moves $13M SOL To Kraken as Solana Price Consolidates, What Next?

2.52 Million Altcoins Are Ruining Crypto’s Future

Animoca Brands Valuation Tanks 75% In Two Years, Here’s Why

Crypto exchange BingX hacked for $43 million

Are The Big Players Losing Interest?

Hong Kong’s Securities Association Tips Authorities On Crypto Self-Regulation

Coinbase cbBTC Set to go Live on Solana
2.52 Million Altcoins Are Ruining Crypto’s Future
Animoca Brands Valuation Tanks 75% In Two Years, Here’s Why
Crypto exchange BingX hacked for $43 million
Are The Big Players Losing Interest?
Hong Kong’s Securities Association Tips Authorities On Crypto Self-Regulation