
Market
Ethereum (ETH) Can’t Breach $2,000 As Sellers Take Control

Ethereum (ETH) is still struggling below the $2,000 mark after briefly hitting the threshold following the recent FOMC meeting. The bullish momentum has quickly faded, and ETH is again showing signs of weakness.
Technical indicators, including RSI and DMI, indicate increasing bearish pressure in the short term. Traders are now monitoring key support and resistance levels to see whether ETH will continue its correction or attempt a recovery.
Ethereum RSI Is Down After Touching Overbought Levels
Ethereum’s RSI has dropped sharply to 46.63 from 71 just two days ago, signaling a shift in momentum.
The Relative Strength Index (RSI) is a momentum oscillator that measures the speed and change of price movements, typically on a scale of 0 to 100. Readings above 70 suggest an asset is overbought, while levels below 30 indicate it may be oversold.
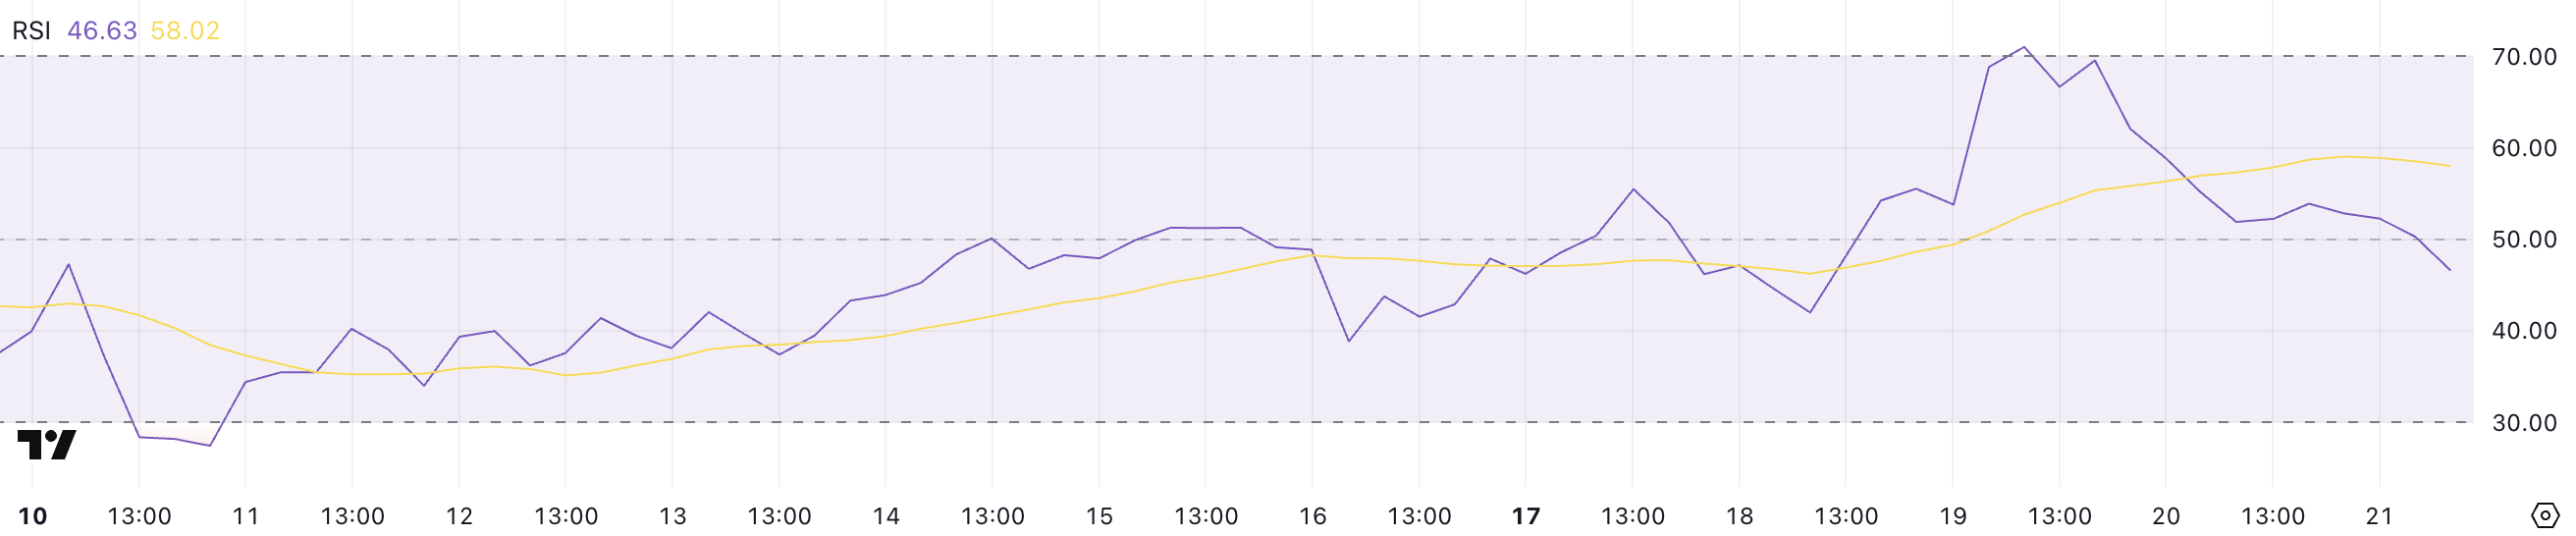
With ETH’s RSI now sitting near 46, it has entered neutral territory, showing that the recent bullish momentum has faded. This could imply a period of consolidation or further downside risk if sellers maintain control.
Traders may now expect ETH to stabilize and bounce if demand returns or continue its correction if bearish pressure grows stronger.
ETH DMI Shows Sellers Are Again In Control
Ethereum’s DMI chart shows that the ADX has dropped to 17.96 from 24.5 yesterday, indicating weakening trend strength.
The Average Directional Index (ADX) measures the strength of a trend, with values above 25 suggesting a strong trend and values below 20 pointing to a weak or ranging market.
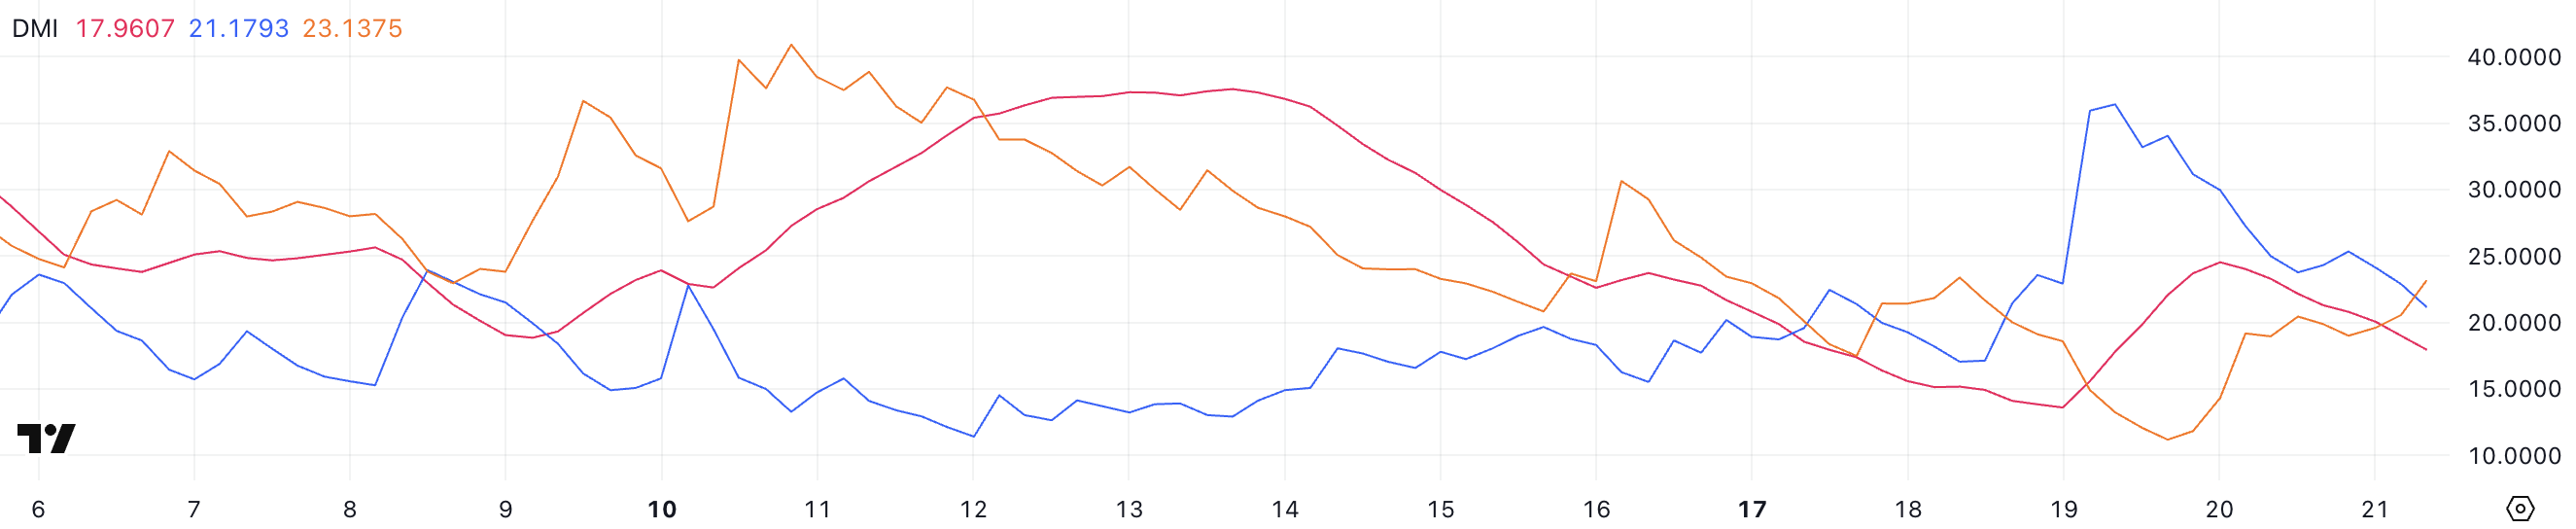
At the same time, ETH’s +DI has fallen to 21.17 from 34, signaling that bullish momentum is fading. Meanwhile, the -DI has climbed to 23.12 from 11.17, suggesting growing bearish pressure.
With ADX dropping and -DI crossing above +DI, Ethereum could face further downside or enter a consolidation phase as sellers gain more influence over price action.
Can Ethereum Surge 30% Soon?
Ethereum price is currently in a corrective phase, and if this trend continues, it could test key support levels at $1,867 and $1,823.
A break below these zones could open the door for a deeper decline toward $1,759, with the risk of ETH falling below $1,700 for the first time since October 2023.
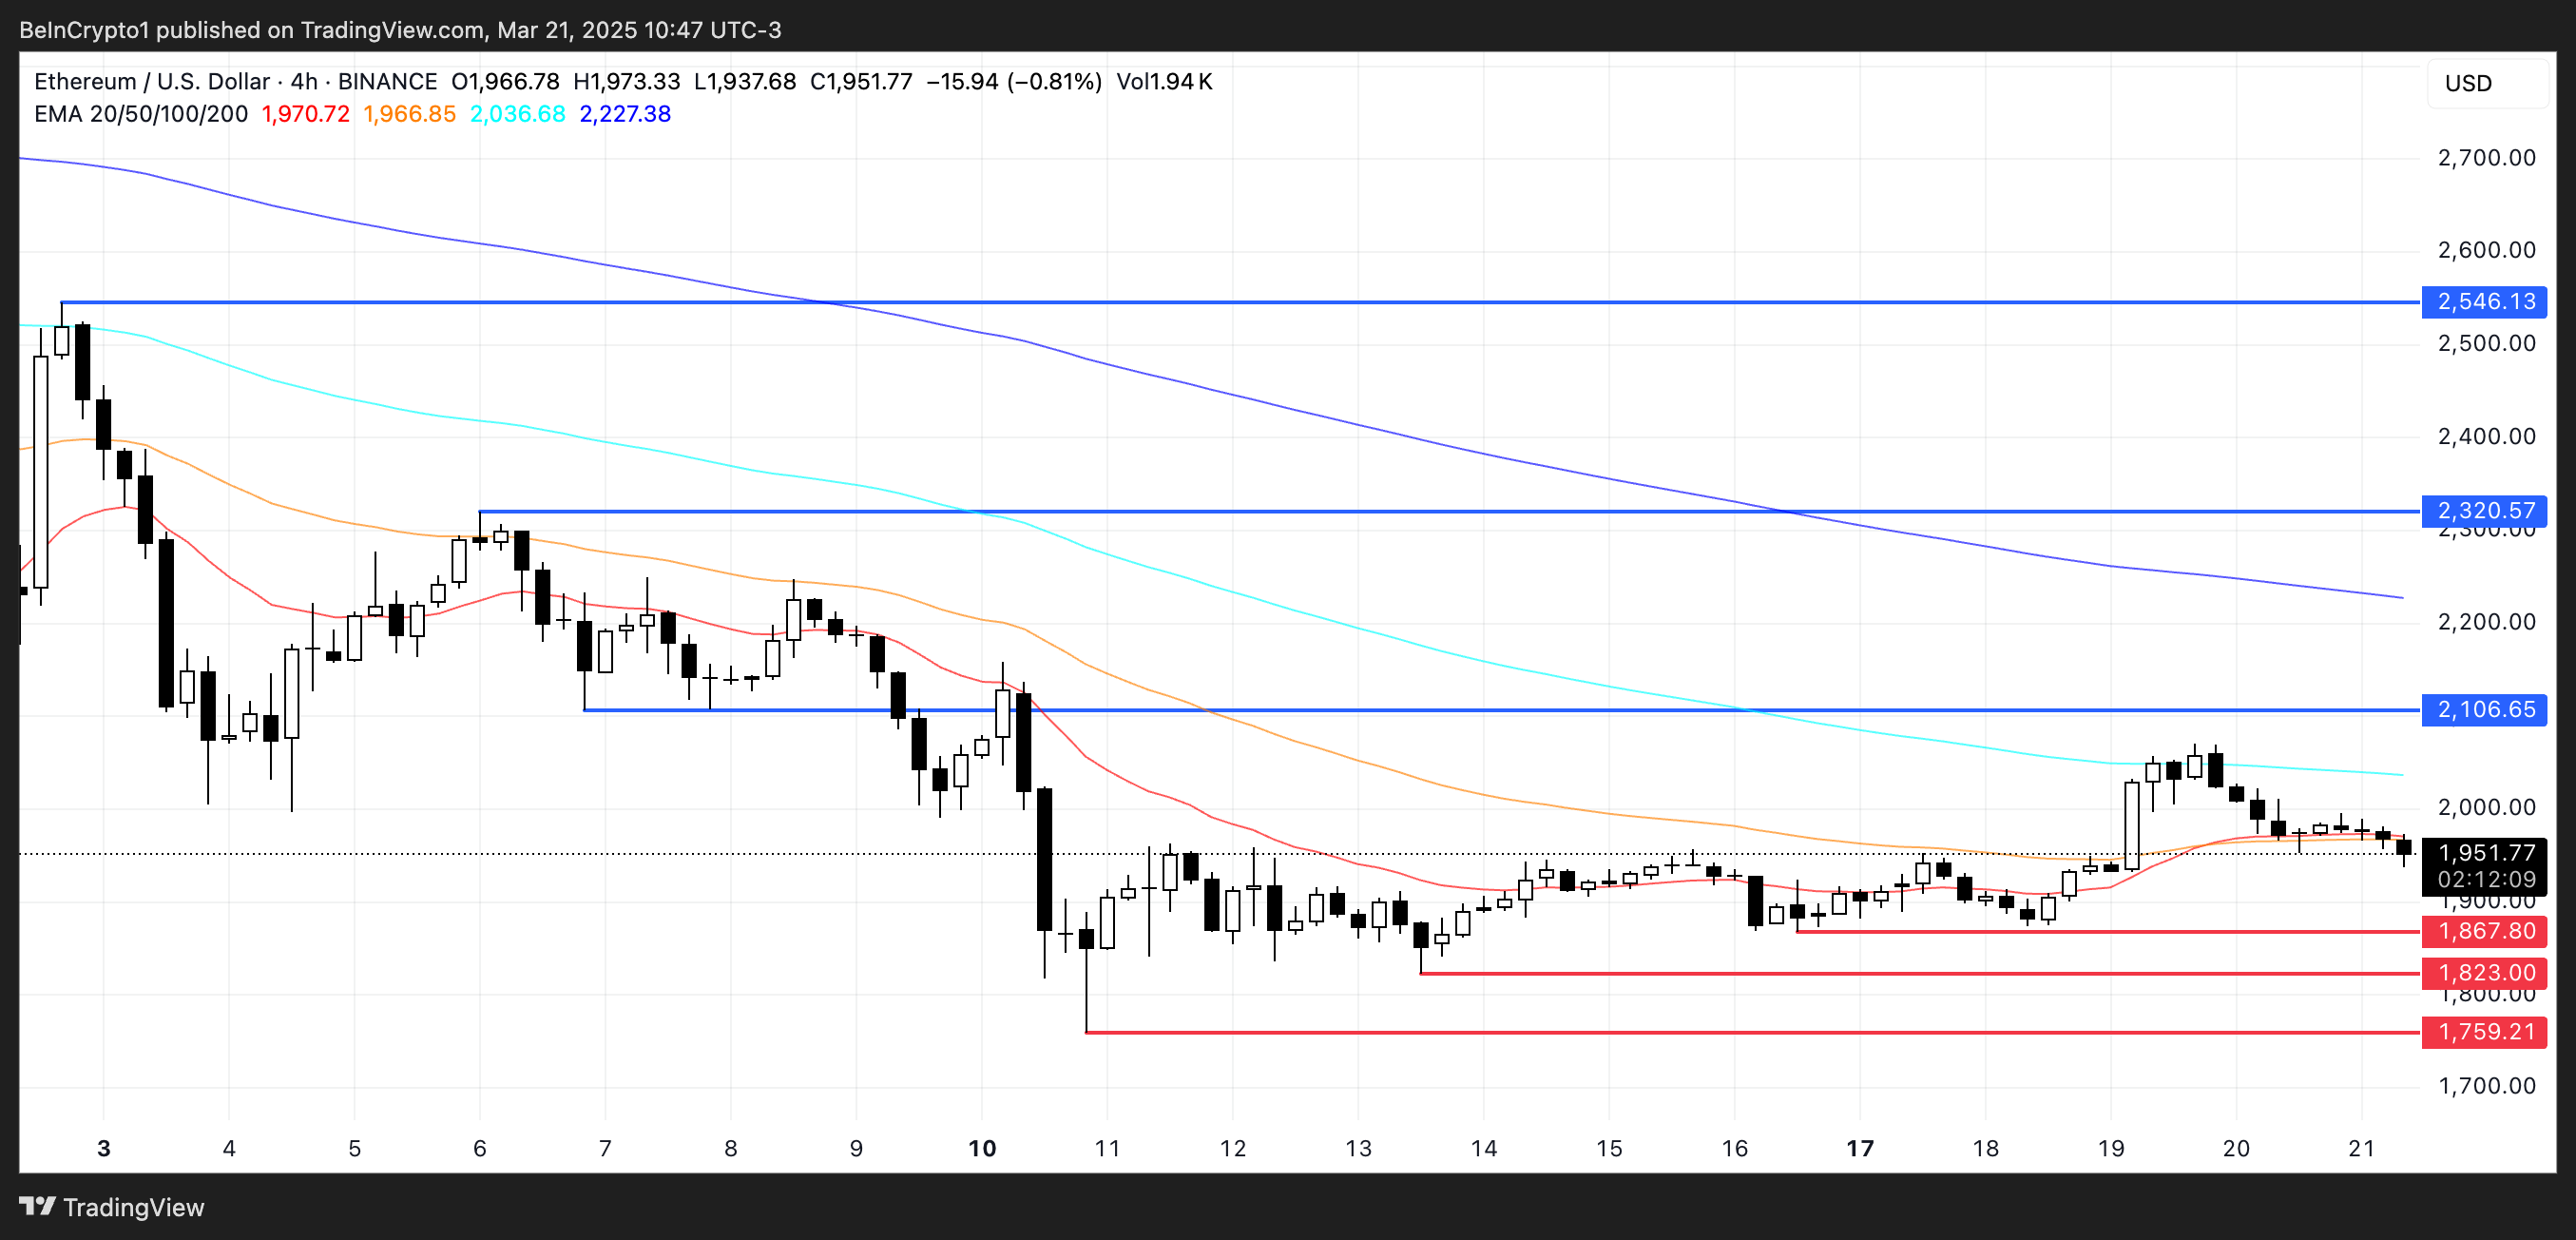
However, if Ethereum manages to reverse the current downtrend and regain bullish momentum, it could push toward resistance at $2,106.
A stronger rally could see ETH aiming for $2,320 and even $2,546, offering a potential upside of around 30% from current levels.
Disclaimer
In line with the Trust Project guidelines, this price analysis article is for informational purposes only and should not be considered financial or investment advice. BeInCrypto is committed to accurate, unbiased reporting, but market conditions are subject to change without notice. Always conduct your own research and consult with a professional before making any financial decisions. Please note that our Terms and Conditions, Privacy Policy, and Disclaimers have been updated.


Semler Scientific (SMLR), a US-based medical technology company, has revealed plans to acquire more Bitcoin (BTC) despite facing a 5.0% unrealized loss on its previous BTC investments.
The firm has filed a Form S-3 registration with the US Securities and Exchange Commission (SEC) to raise up to $500 million through a securities offering. The proceeds would be allocated for general corporate purposes, including expanding its Bitcoin portfolio.
Semler Scientific Files S-3 to Fund Bitcoin Investments
According to the official filing, the firm plans to issue common stock, preferred stock, debt securities, and warrants as part of the securities offering. The SEC filing does not specify the exact amount allocated for Bitcoin purchases. Nonetheless, Semler’s recent activity suggests a strong focus on cryptocurrency.
“We have not determined the amount of net proceeds to be used specifically for such purposes. As a result, management will retain broad discretion over the allocation of the net proceeds of any offering,” the filing read.
This move follows Semler’s previous acquisition of 871 BTC for $88.5 million at an average price of $101,616 per Bitcoin. The purchases were made between January 11 and February 3.
The acquisition increased Semler’s total Bitcoin holdings to 3,192 BTC. The holdings worth $266.1 million represent 80.6% of the company’s total market capitalization of 330.1 million. This indicates that a significant portion of its value is tied to its Bitcoin investments.
“From January 1, 2025, to February 3, 2025, Semler Scientific’s BTC Yield was 21.9%. From July 1, 2024 (the first full quarter after Semler Scientific adopted its bitcoin treasury strategy) to February 3, 2025, Semler Scientific’s BTC Yield was 152.2%,” the firm revealed.
However, the tides have shifted since then. According to Bitcoin Treasuries, Semler’s average BTC acquisition cost is $87,850 per coin. As of the latest data from BeInCrypto, Bitcoin’s market price stood at $83,397, placing Semler at a 5.0% loss on its investment.

Previously, BeInCrypto noted that the losses surged to 14.7% as BTC fell below the $80,000 mark. Despite this, Semler’s leadership appears committed to its Bitcoin strategy, viewing the cryptocurrency as a long-term store of value.
Semler’s strategic push into Bitcoin mirrors those of other firms, such as Strategy (formerly MicroStrategy) and Metaplanet. Earlier this week, the firms acquired BTC worth $285 million and $26.3 million, respectively.
However, Semler’s decision to double down on Bitcoin comes amid financial and legal challenges. On April 15, the company announced a preliminary $29.75 million settlement with the US Department of Justice (DOJ) to resolve allegations of violating federal anti-fraud laws related to marketing its QuantaFlo product.
The settlement is pending final approval. Yet, it adds pressure to Semler’s balance sheet as it navigates its ambitious fundraising and Bitcoin investment plans.
Disclaimer
In adherence to the Trust Project guidelines, BeInCrypto is committed to unbiased, transparent reporting. This news article aims to provide accurate, timely information. However, readers are advised to verify facts independently and consult with a professional before making any decisions based on this content. Please note that our Terms and Conditions, Privacy Policy, and Disclaimers have been updated.

Cardano price started a fresh decline from the $0.680 zone. ADA is consolidating near $0.620 and remains at risk of more losses.
- ADA price started a recovery wave from the $0.5850 zone.
- The price is trading below $0.640 and the 100-hourly simple moving average.
- There is a connecting bearish trend line forming with resistance at $0.6350 on the hourly chart of the ADA/USD pair (data source from Kraken).
- The pair could start another increase if it clears the $0.640 resistance zone.
Cardano Price Faces Resistance
In the past few sessions, Cardano saw a fresh decline from the $0.680 level, like Bitcoin and Ethereum. ADA declined below the $0.650 and $0.640 support levels.
A low was formed at $0.6040 and the price is now consolidating losses. There was a minor move above the $0.6120 level. The price tested the 23.6% Fib retracement level of the recent decline from the $0.6481 swing high to the $0.6040 low.
Cardano price is now trading below $0.640 and the 100-hourly simple moving average. On the upside, the price might face resistance near the $0.6260 zone and the 50% Fib retracement level of the recent decline from the $0.6481 swing high to the $0.6040 low.
The first resistance is near $0.6350. There is also a connecting bearish trend line forming with resistance at $0.6350 on the hourly chart of the ADA/USD pair. The next key resistance might be $0.6480.

If there is a close above the $0.6480 resistance, the price could start a strong rally. In the stated case, the price could rise toward the $0.680 region. Any more gains might call for a move toward $0.70 in the near term.
Another Drop in ADA?
If Cardano’s price fails to climb above the $0.6350 resistance level, it could start another decline. Immediate support on the downside is near the $0.6040 level.
The next major support is near the $0.60 level. A downside break below the $0.60 level could open the doors for a test of $0.580. The next major support is near the $0.5550 level where the bulls might emerge.
Technical Indicators
Hourly MACD – The MACD for ADA/USD is gaining momentum in the bearish zone.
Hourly RSI (Relative Strength Index) – The RSI for ADA/USD is now below the 50 level.
Major Support Levels – $0.6040 and $0.580.
Major Resistance Levels – $0.6350 and $0.6480.

The total value of real-world assets (RWAs) on the Arbitrum network has surged over 1,000-fold since the start of 2024.
From a modest $100,000 to $200,000 in early January last year, Arbitrum now hosts more than $200 million in tokenized RWAs. This reflects one of the most explosive growth trajectories in decentralized finance (DeFi) this year.
RWA Total Value on Arbitrum Increases 1,000X
This exponential expansion is largely attributed to Arbitrum DAO’s Stable Treasury Endowment Program (STEP), which is currently in its 2.0 phase. The program allocated 85 million ARB tokens to support stable, liquid, yield-generating RWAs.
“The DAO just approved 35M ARB for RWAs via STEP 2.0. This brings the total RWA investments from the DAO treasury to 85M ARB, one of the largest DAO-led RWA allocations in Web3,” Arbitrum said in February.
The strategy aims to reduce the DAO’s exposure to volatile native crypto assets and help build a more resilient treasury, and it appears to be yielding results.

US Treasuries dominate Arbitrum’s RWA ecosystem, making up 97% of the sector. Franklin Templeton’s BENJI leads the pack, which holds a 36% market share, followed by SPIKO’s European treasuries, accounting for 18%.
This diversification beyond US-centric instruments is a healthy sign for global institutional engagement with Arbitrum.
“The eco welcomes global diversification beyond US instruments,” The Learning Pill remarked.
New entrants like Dinari have also added to the ecosystem’s momentum, offering tokenized versions of traditional securities. These include stocks, ETFs (exchange-traded funds), and REITs via its dShares platform.
More than 18 tokenized RWA products live on Arbitrum, covering various asset classes from bonds to real estate. Arbitrum itself highlighted this institutional influx on X (Twitter)
“RWA and Stablecoin adoption on Arbitrum has been monumental! Some of the largest institutions are bringing their tokenized assets to the land of liquidity with $4.7 billion in Stablecoins and over $214 million in RWAs already onchain,” the network stated.
Teams like Securitize, DigiFT, and SPIKO are tokenizing everything from sovereign debt to real estate portfolios, signaling the early formation of a new financial substrate.
Yet, despite the strong ecosystem development, ARB, the network’s native token, is down 88% from its all-time high.

Further downside pressure looms, with a 92.63 million ARB token unlock imminent. With only 46% of the total supply currently in circulation, concerns about dilution and lack of direct token accrual from RWA growth remain key market overhangs.

Tokenized RWA Cross $11 Billion, Ethereum Dominates Onchain Finance Frontier
Beyond Arbitrum, the broader real-world asset sector has quietly become one of the most significant trends in crypto, even if it does not dominate headlines.
According to DeFiLlama, on-chain RWAs have surpassed $11.169 billion in total value locked, up 2.5X over the past year.

Tokenized US Treasuries and tokenized gold are the engines behind this boom. BlackRock’s BUIDL fund now holds over $2.38 billion in tokenized Treasuries alone. Meanwhile, blockchain-based gold assets, driven by both market demand and rising metal prices, have crossed $1.2 billion, according to a recent BeInCrypto report.
Ethereum remains in the frontline, hosting approximately 80% of all on-chain RWAs. As TradFi giants seek programmable exposure to dollar yields and real assets, Ethereum offers the infrastructure and liquidity needed to bridge capital markets with blockchain rails.
“The top RWA protocols aren’t chasing crypto narratives. They are offering something TradFi understands: yield, dollar exposure, and gold. This is not the future of DeFi. It’s the future of finance,” DeFi analyst Patrick Scott observed.
Builders point out that adoption is already deeply embedded in on-chain-native applications like Pendle, Morpho, Frax, and various automated market makers (AMMs) and staking layers. The “real yield” thesis has arrived, coded into the new financial system’s base layer.
“The TradFi narrative is nice, but the adoption so far is on-chain-native,” DeFi builder Artem Tolkachev noted.
While flashy DeFi experiments often mimic casinos, RWAs show that slow, stable, and scalable wins the race.
The next frontier lies in improving access, liquidity, and incentives, particularly on non-Ethereum chains like Arbitrum, where the technical groundwork is strong, but market confidence remains in flux.
Tokenized RWAs may not be the loudest narrative in crypto, but they are becoming its most consequential.
“Onchain RWAs are quietly becoming the backbone of future finance, not hype, just real value TradFi gets: yield, dollars, and gold,” Validatus.com quipped.
Disclaimer
In adherence to the Trust Project guidelines, BeInCrypto is committed to unbiased, transparent reporting. This news article aims to provide accurate, timely information. However, readers are advised to verify facts independently and consult with a professional before making any decisions based on this content. Please note that our Terms and Conditions, Privacy Policy, and Disclaimers have been updated.

Bitcoin & Others Slip As Trump Imposes Up To 245% Tariff On China

Semler Doubles Down on Bitcoin Investments Despite Losses

China Liquidates Seized Crypto to Boost Struggling Treasury
Expert Reveals Current Status Of 9 Ripple ETFs

Cardano (ADA) Pressure Mounts—More Downside on the Horizon?

Is Bitcoin the Solution to Managing US Debt? VanEck Explains

2.52 Million Altcoins Are Ruining Crypto’s Future

Animoca Brands Valuation Tanks 75% In Two Years, Here’s Why

Crypto exchange BingX hacked for $43 million

Are The Big Players Losing Interest?

Hong Kong’s Securities Association Tips Authorities On Crypto Self-Regulation

Coinbase cbBTC Set to go Live on Solana
2.52 Million Altcoins Are Ruining Crypto’s Future
Animoca Brands Valuation Tanks 75% In Two Years, Here’s Why
Crypto exchange BingX hacked for $43 million
Are The Big Players Losing Interest?
Hong Kong’s Securities Association Tips Authorities On Crypto Self-Regulation
Coinbase cbBTC Set to go Live on Solana
-

 Market23 hours ago
Can Pi Network Avoid a Similar Fate?
-
 Bitcoin24 hours ago
Bitcoin Poised for Summer Rally as Gold Leads and Liquidity Peaks
-

 Altcoin18 hours ago
Whispers Of Insider Selling As Mantra DAO Relocates Nearly $27 Million In OM To Binance
-
 Altcoin23 hours ago
Binance Delists This Crypto Causing 40% Price Crash, Here’s All
-

 Market22 hours ago
Ethereum Price Consolidation Hints at Strength—Is a Move Higher Coming?
-

 Market18 hours ago
Forget XRP At $3, Analyst Reveals How High Price Will Be In A Few Months
-

 Market17 hours ago
Trump Family Plans Crypto Game Inspired by Monopoly
-

 Bitcoin22 hours ago
Bolivia Reverses Crypto-for-Fuel Plan Amid Energy Crisis
