
Market
Ether recovers from its dip to $2,600 following Bybit’s hack

Key takeaways
- Ether dipped to the $2,600 region following Bybit’s hack on Friday but now trades above $2,700 per coin.
- iDEGEN has raised nearly $25 million as presale ends in two days.
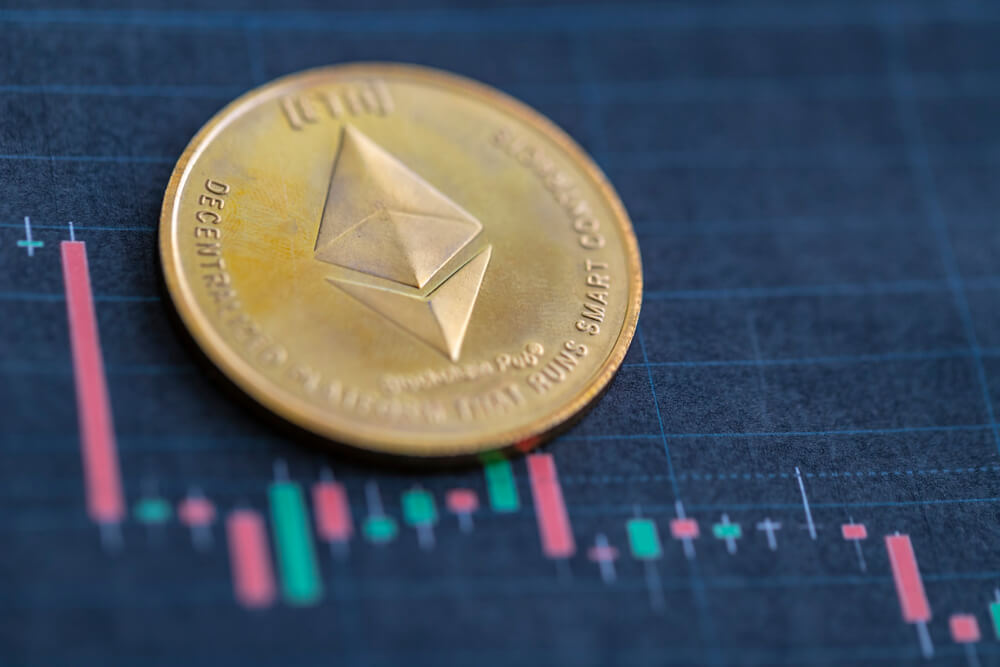
ETH could rally higher after dipping on Bybit hack
Ether, the second-largest cryptocurrency by market cap, has been volatile over the past few days. It was trading around $2,850 on Friday before crashing to $2,620 later that day after the crypto exchange Bybit was hacked.
The hack saw nearly $1.5 billion worth of ETH and stETH wiped from Bybit’s cold storage wallet. However, ETH’s price has slightly recovered since then and could rally higher in the near term. At press time, the price of Ether stands at $2,727, down nearly 2% in the last 24 hours.
What is iDEGEN?
Bybit’s hack is the biggest in the cryptocurrency market’s history so far, but how the company handled the situation inspired confidence in investors. As investors acknowledge the maturity level of the crypto market, more funds continue to flow into new and exciting projects.
iDEGEN is one of the projects that has raised millions of dollars from investors. It is a leading memecoin and AI project that would offer massive utility to its users by launching several products and services. iDEGEN has already raised nearly $25 million and will use the funds to develop its products.
In its whitepaper, the project developers revealed that iDEGEN is a meme project that leverages the benefits of AI to create the next billion-dollar memecoin. It is an AI tool that primarily functions as such.
The tool continuously evolves and adapts by leveraging community feeds on X. While iDEGEN is powered by AI, degens ultimately raise the tool. The native token, $IDGN, will power all the various activities within the ecosystem.
The team explained that $IDGN’s launch as a memecoin stems from the recent growth of the meme narrative in the crypto space. The AI and memecoin narratives were the best performers in 2024, delivering thousands of percentages in ROI to investors.
The iDEGEN token will launch on exchanges in three days, signalling the end of the presale and ushering in the project’s utility phase. With the iDEGEN tool, users can feed their data through tweets, tags, and comments.
The tool absorbs the post and adds it to its knowledge base; that’s how it learns. In addition, iDEGEN posts on X every 60 minutes and can generate and post memes.
iDEGEN’s presale nears $25m as listing date approaches
The iDEGEN token will be listed on exchanges starting from the 27th of February as it ushers in its utility phase. As the listing data approaches, the presale is coming to an end in two days, with nearly $25 million raised from investors over the last few weeks.
In the current stage, the $IDGN token is worth $0.0345, and its price will increase to $0.0380 in the next stage. The next stage will be the final one and will give early investors a massive ROI before the token launches on exchanges.
Why buy the $IDGN token now?
The iDEGEN presale ends in two days, and the token will start listing on exchanges immediately after that. Despite that, buying $IDGN tokens now could be an excellent opportunity to get in early on the project.
The project offers a unique value proposition to investors and users thanks to its numerous utilities. While it is a memecoin, iDEGEN will offer various use cases to its community and the broader crypto market.
With the right level of adoption, its native $IDGN token could gain massive adoption within the iDEGEN and broader crypto ecosystem. This could give early investors excellent ROI in the coming weeks and months.


PI has been on a steady downtrend since February 26, shedding 72% of its value as bearish sentiment continues to weigh on the token.
Bearish pressure continues to mount on the PI token, suggesting that it may be poised to enter a new phase of decline.
PI Network Risks Fresh Decline
An assessment of the PI/USD one-day chart reveals that token holders remain steadfast in their distribution. At press time, PI’s Balance of Power (BoP) is negative, reflecting the selling pressure in the market.
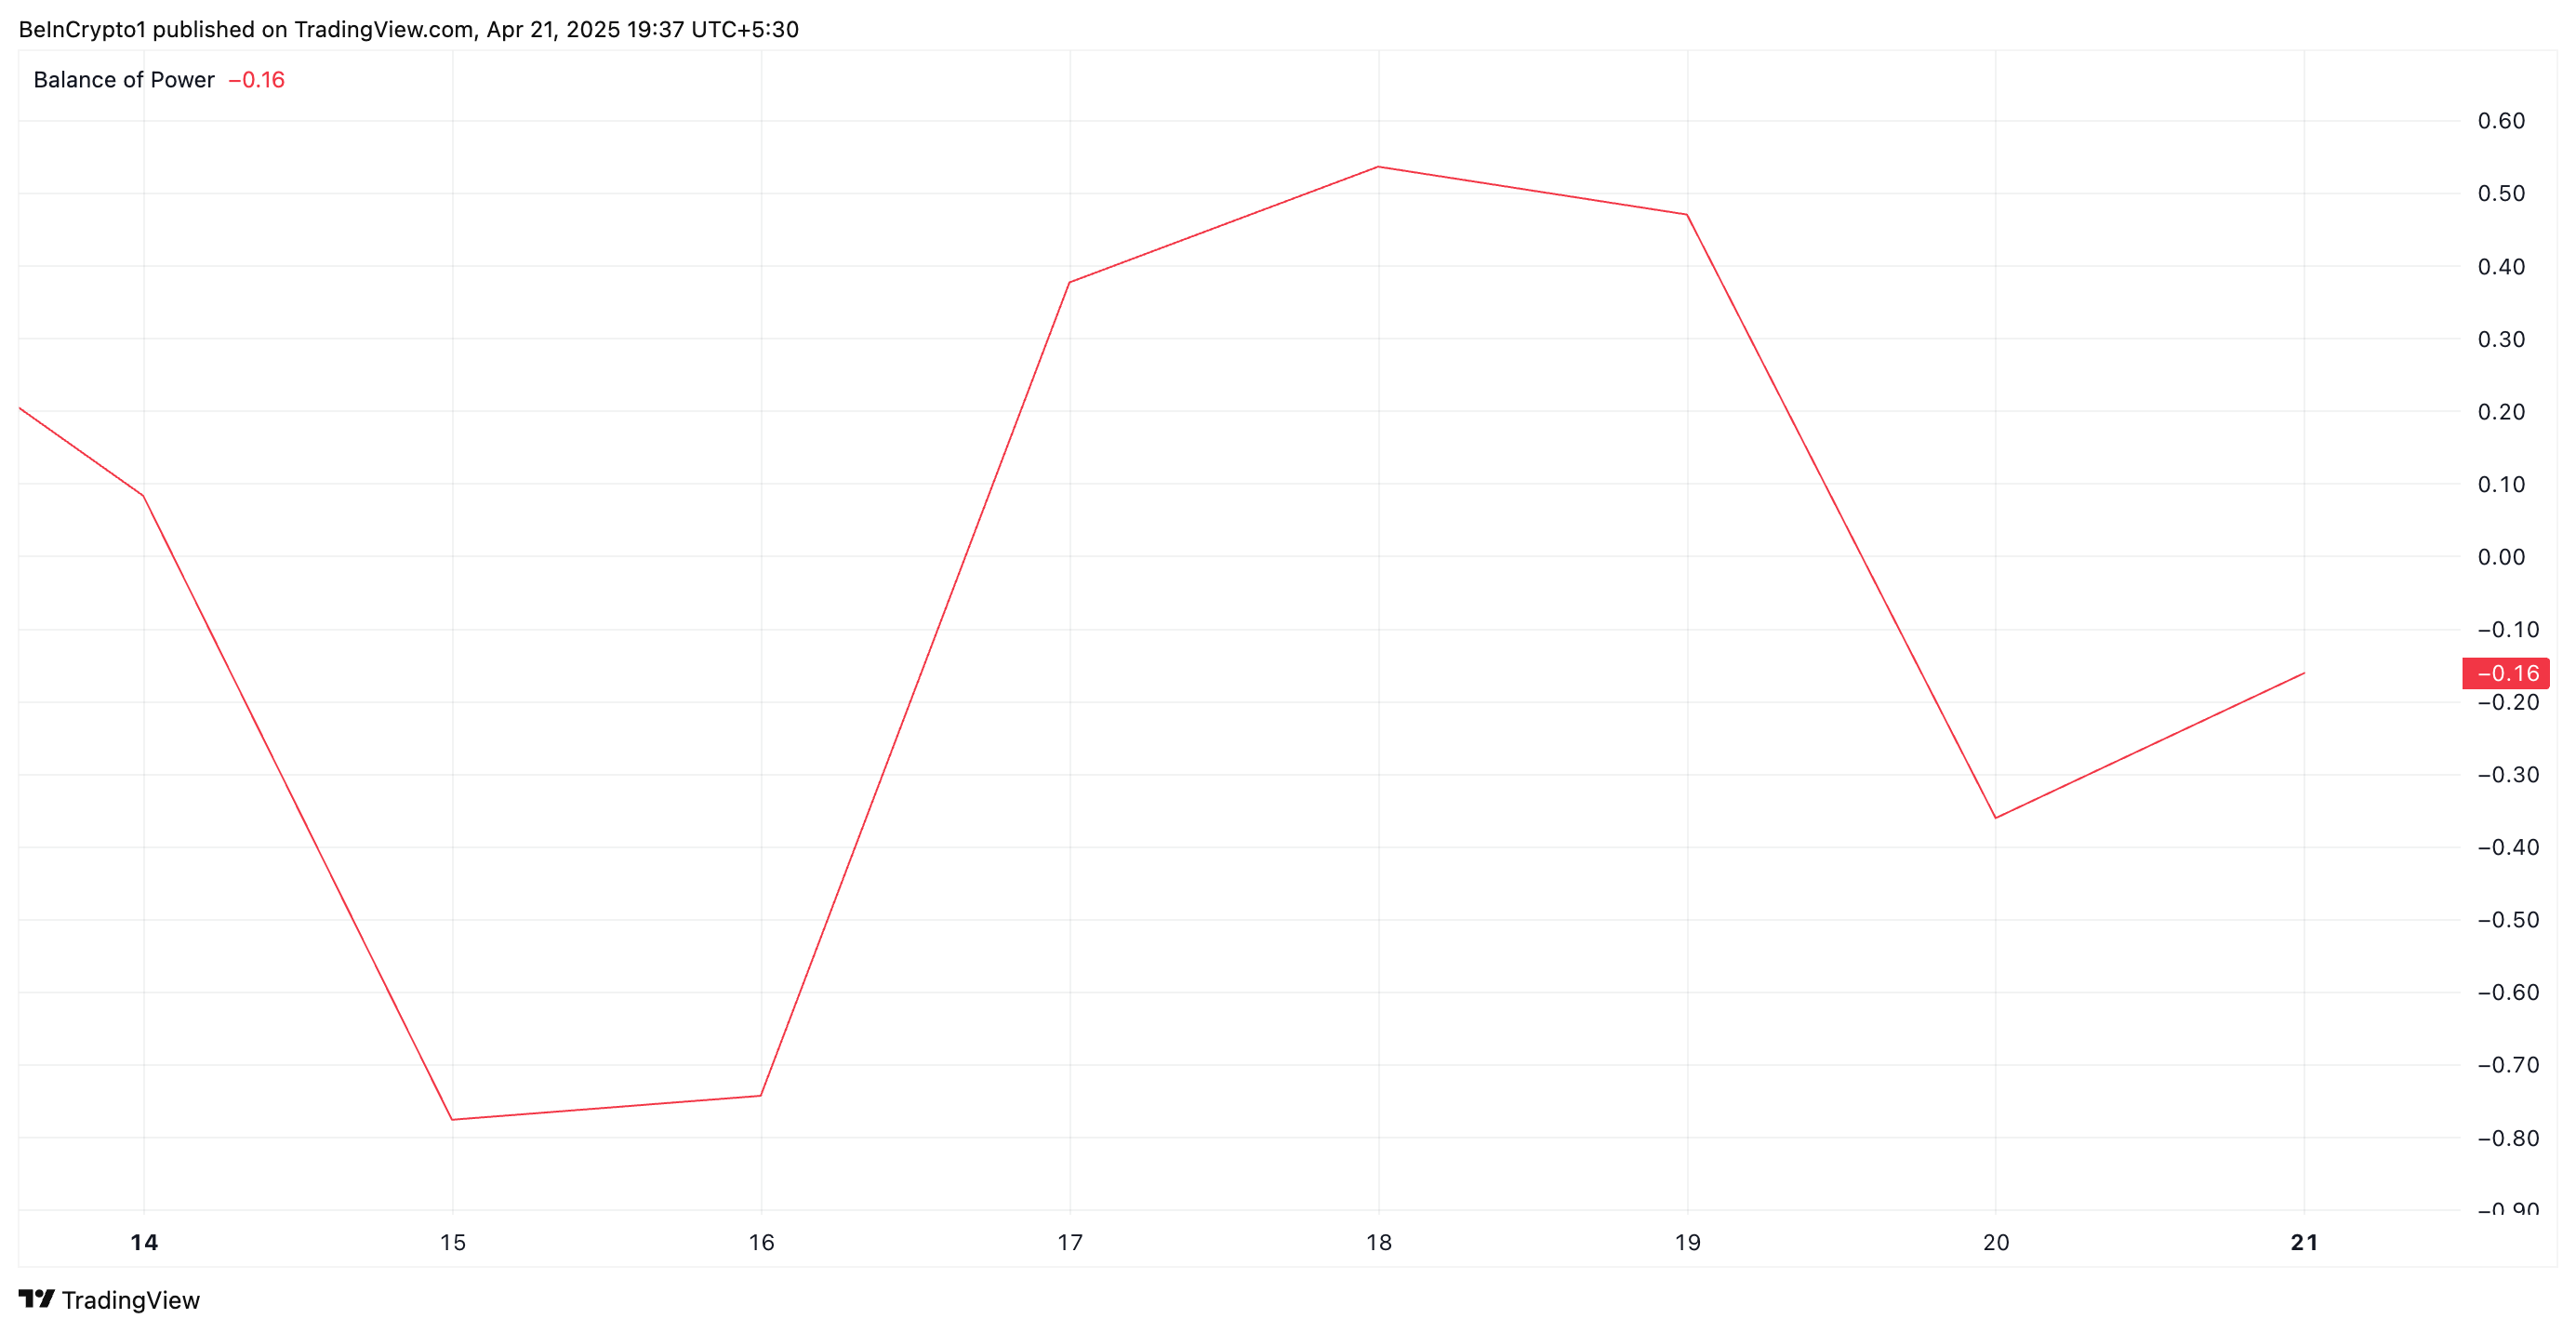
The BoP indicator measures the strength of buying versus selling pressure by comparing the close price to the trading range within a given period. When BOP is negative like this, it indicates that sellers are dominating the market, suggesting downward pressure on the asset’s price.
Further, the setup of PI’s Chaikin Money Flow (CMF) supports this bearish outlook. At press time, this is below the central line at -0.12.
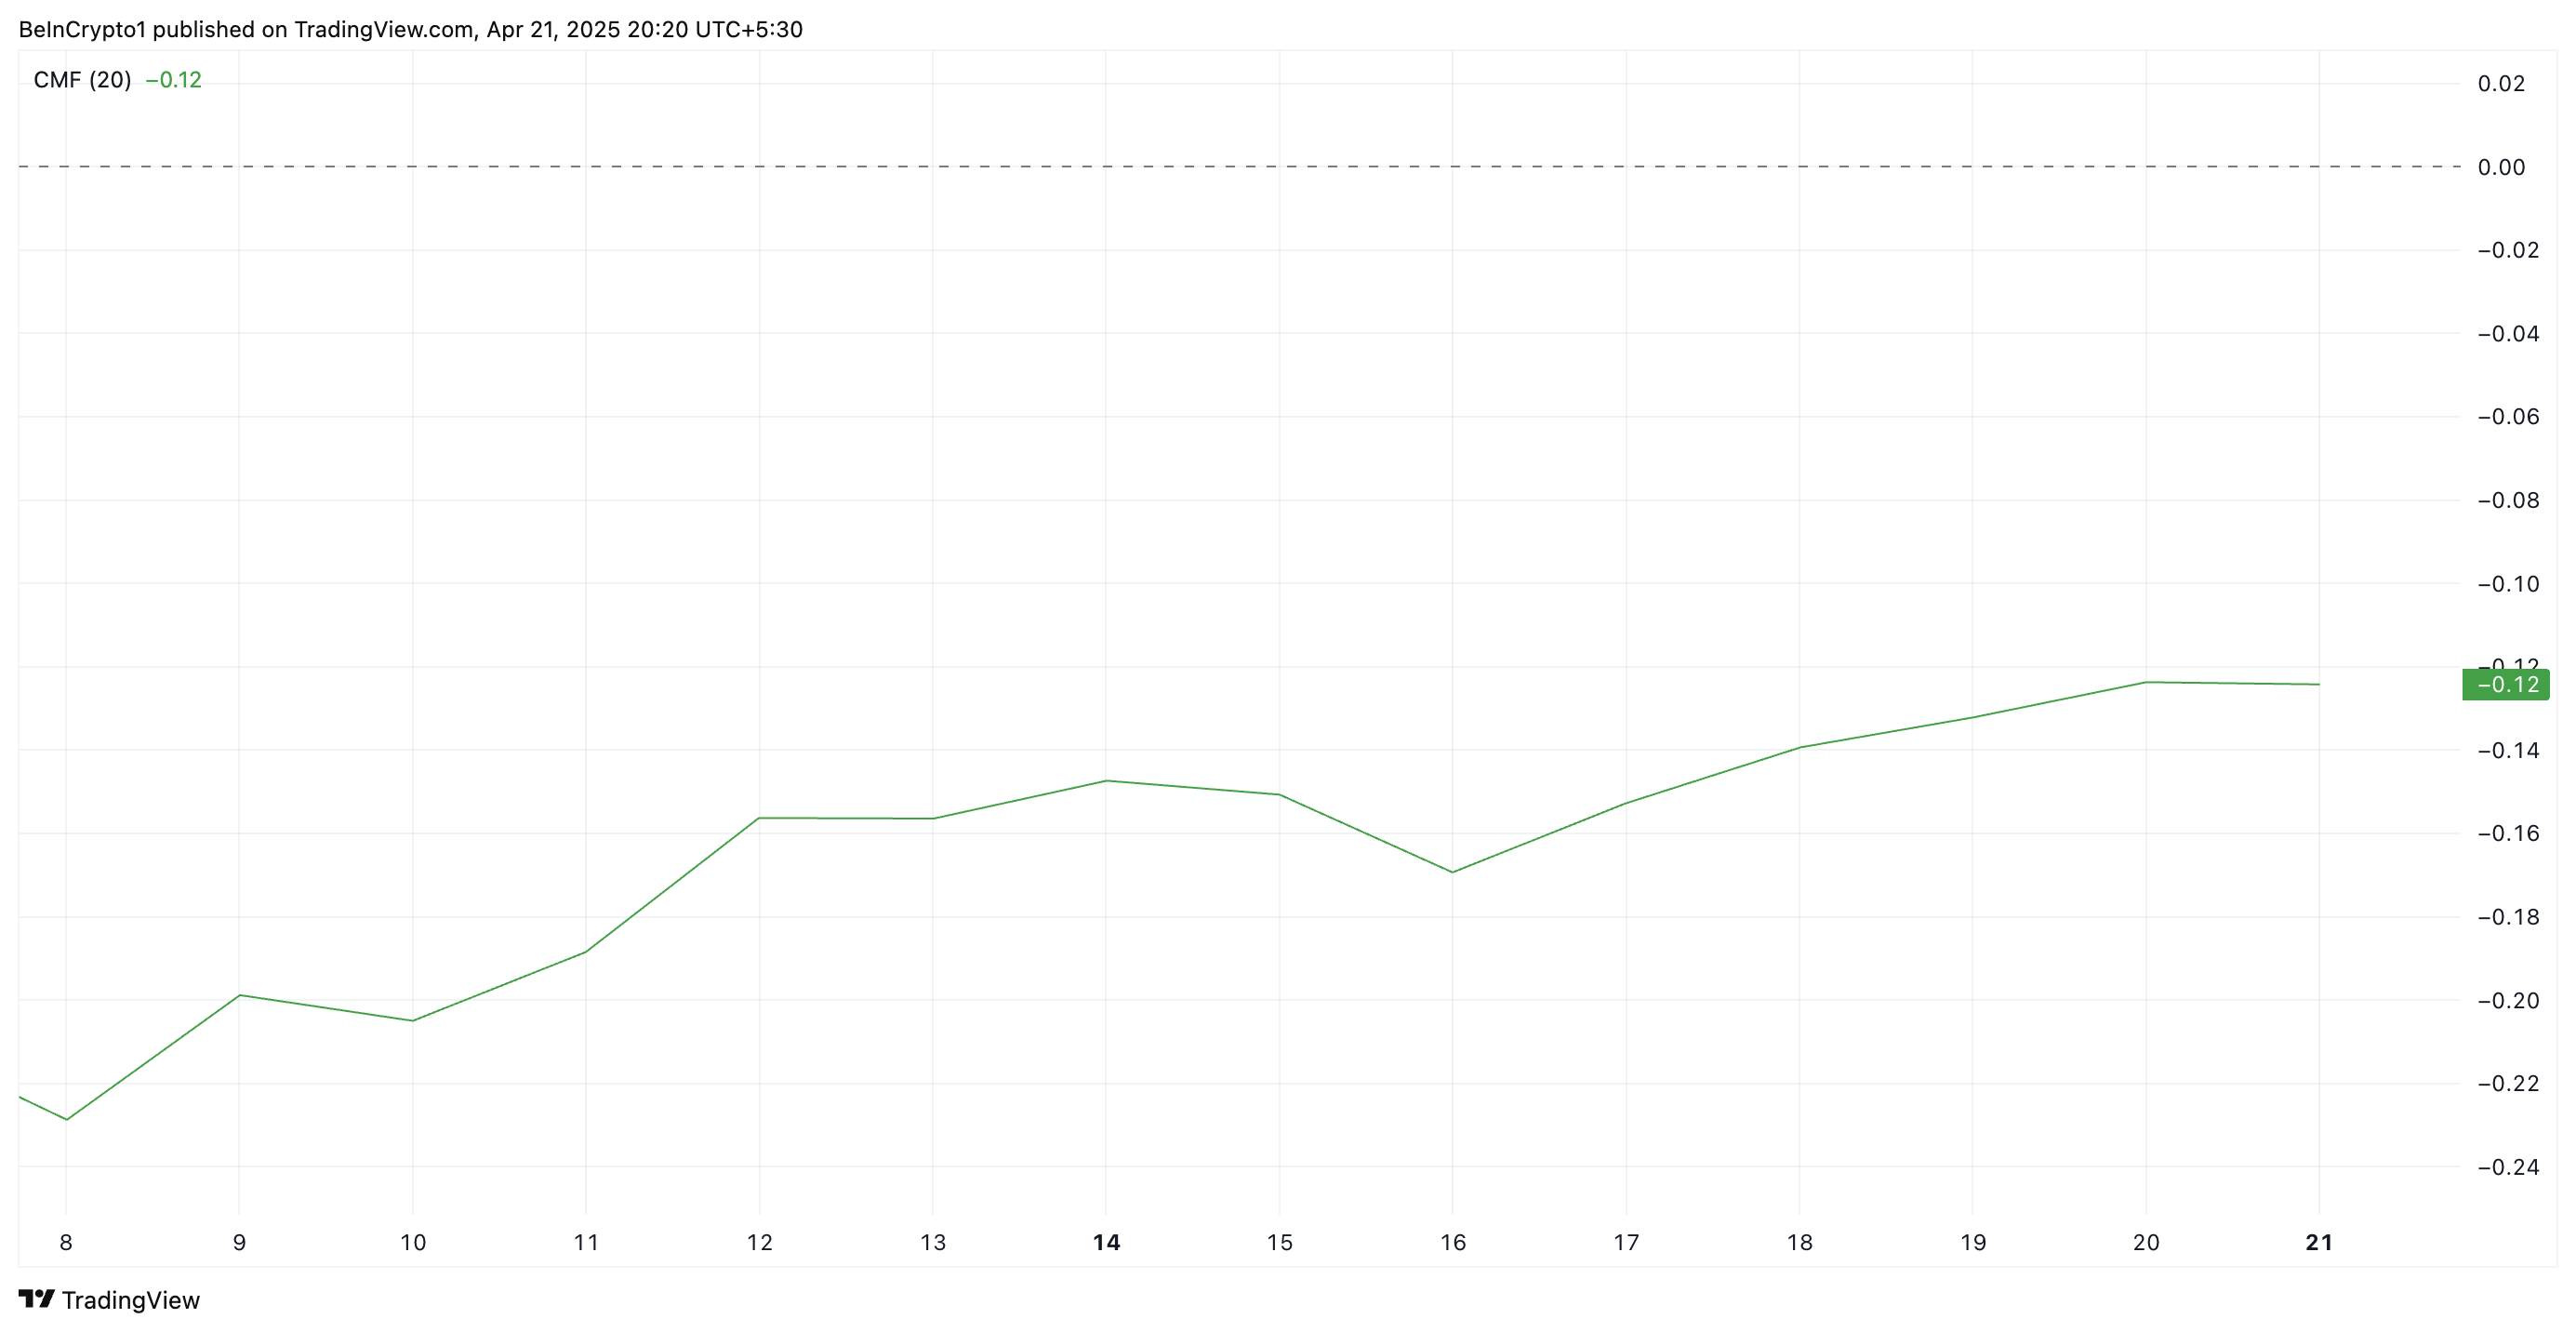
The CMF indicator measures an asset’s buying and selling pressure. A negative CMF reading suggests that the asset is experiencing more selling pressure than buying pressure. This means PI traders are distributing rather than accumulating. This signals bearish sentiment and confirms the downward momentum in the token’s price.
Sellers Tighten Grip on PI, But Recovery to $1.01 Still on the Table
At press time, PI trades at $0.63, below the dynamic support formed above it at $0.93 by its Super Trend indicator.
The Super Trend indicator helps traders identify the market’s direction by placing a line above or below the price chart based on the asset’s volatility.
When an asset’s price trades below the Super Trend line like this, it signals a bearish trend and hints at potential decline. If PI’s decline strengthens, it could revisit its all-time low of $0.40.
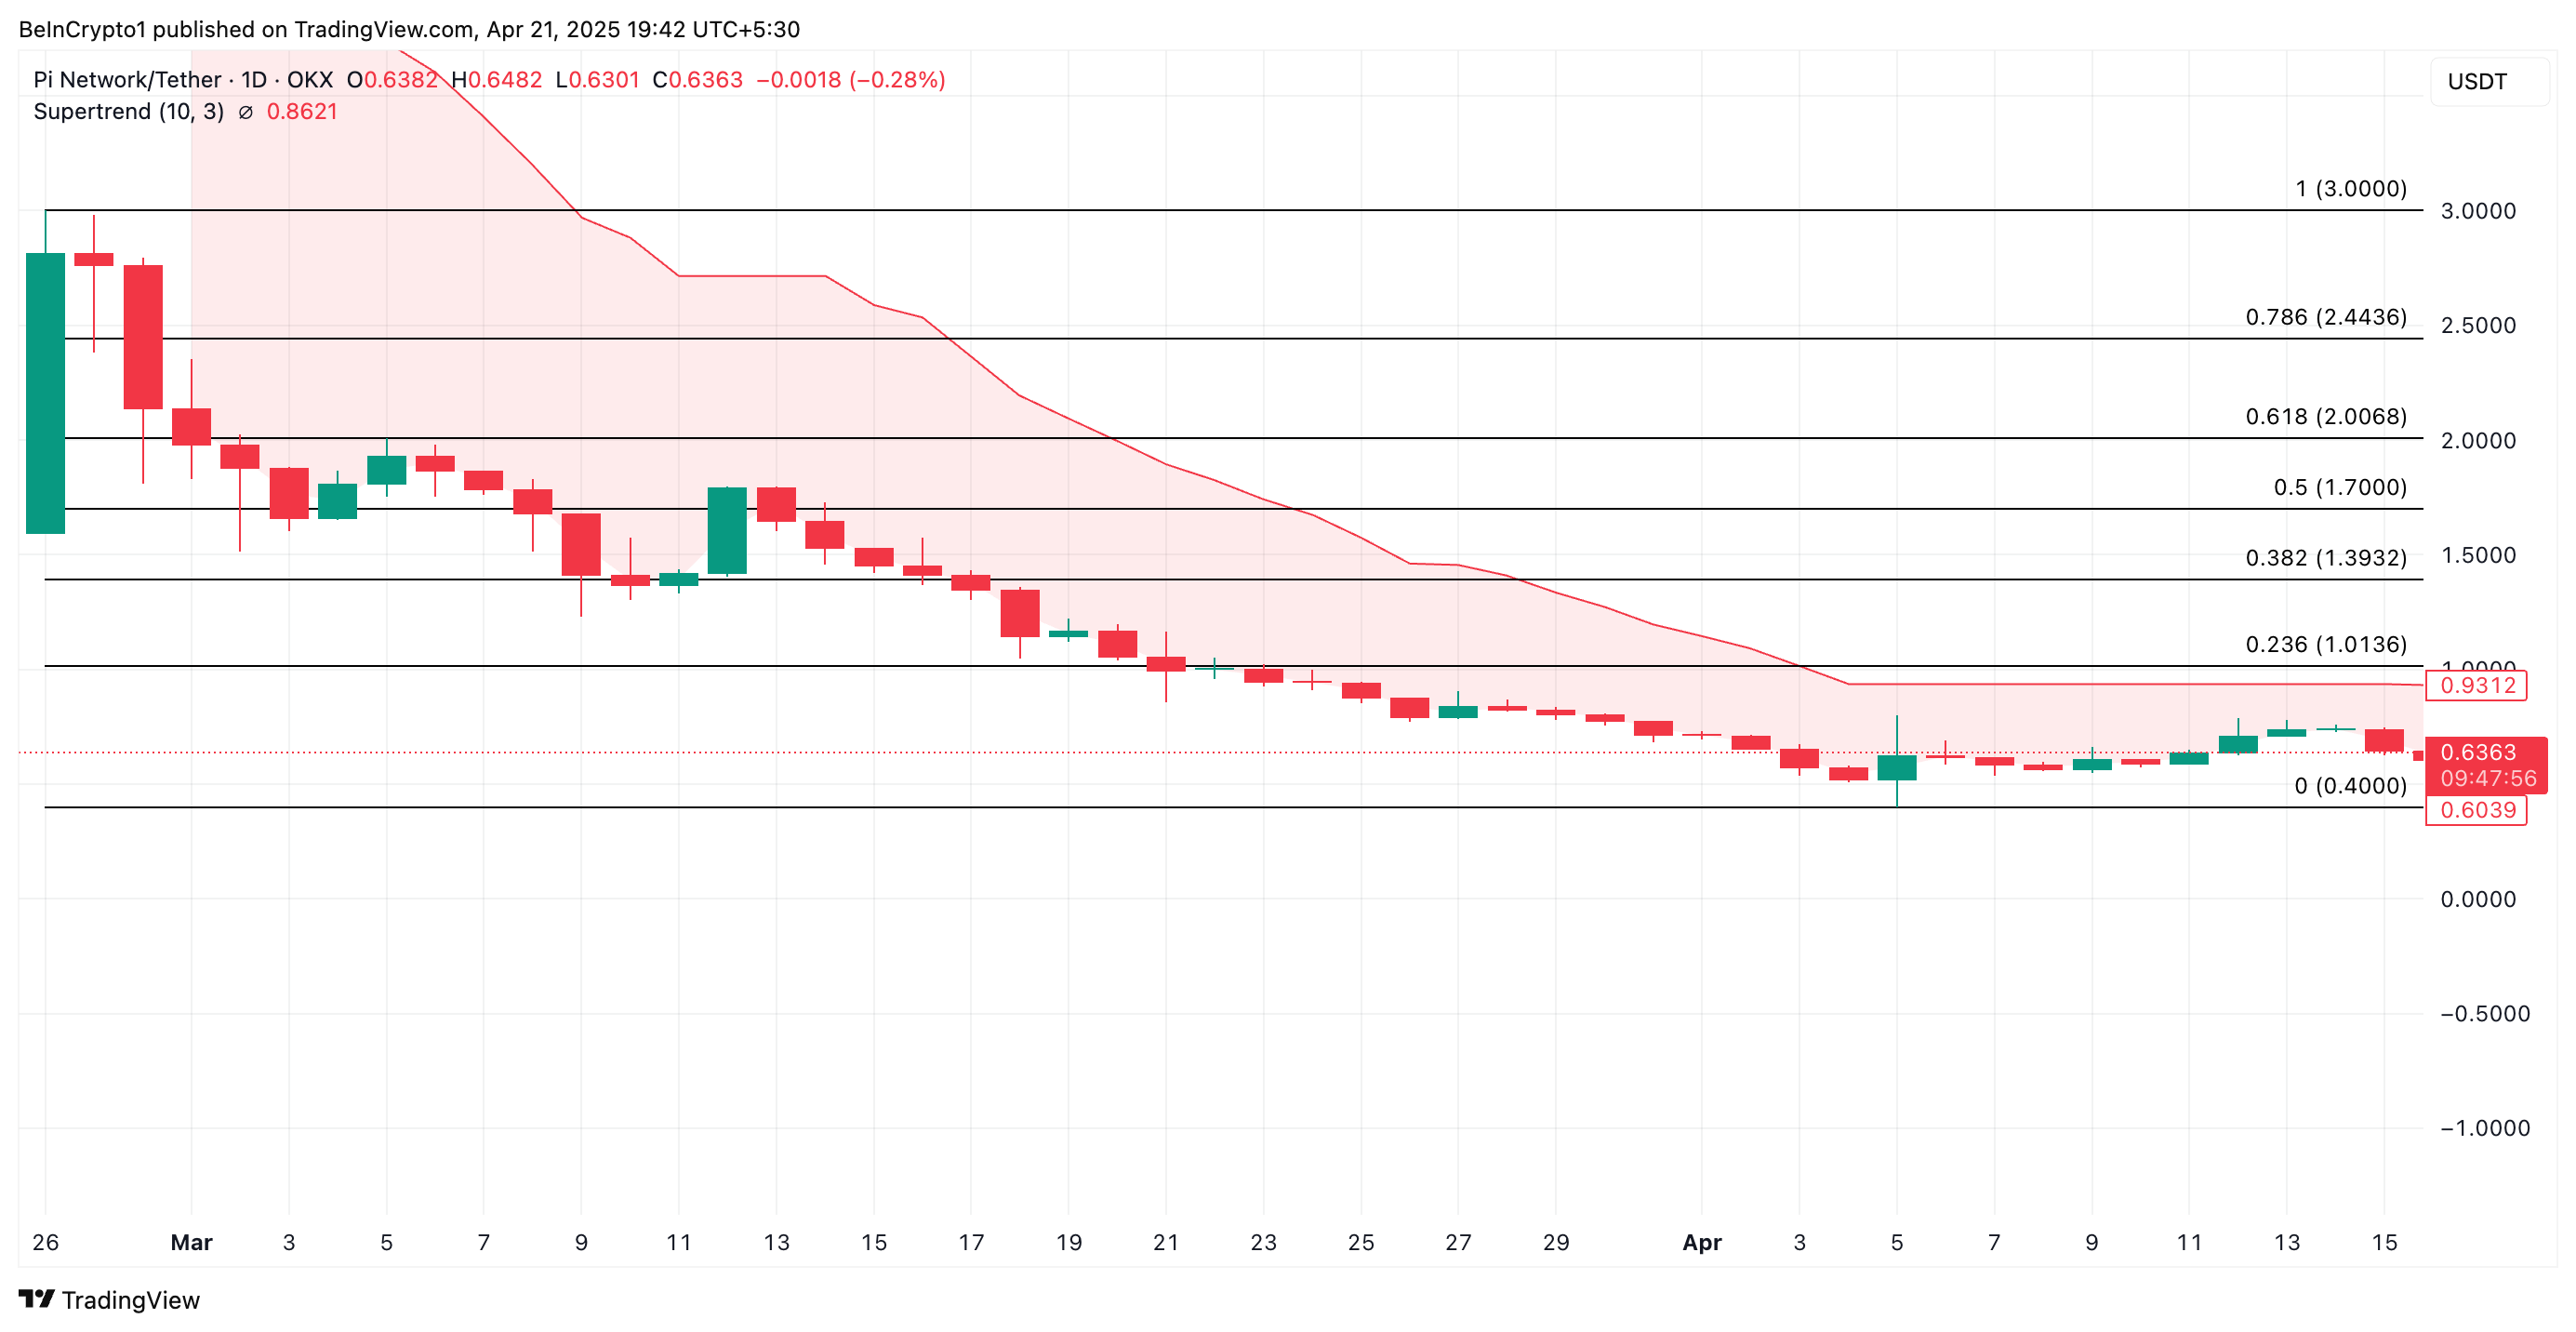
However, if demand returns to the PI market, its price could break above the resistance at $0.86 and surge to $1.01.
Disclaimer
In line with the Trust Project guidelines, this price analysis article is for informational purposes only and should not be considered financial or investment advice. BeInCrypto is committed to accurate, unbiased reporting, but market conditions are subject to change without notice. Always conduct your own research and consult with a professional before making any financial decisions. Please note that our Terms and Conditions, Privacy Policy, and Disclaimers have been updated.

With support from Trump’s White House and easing regulations, firms like Circle and BitGo are pursuing becoming full-fledged financial institutions.
Reports indicate a new wave of crypto companies knocking on the once-closed doors of the American banking system. This time, someone is listening.
Crypto Firms Seek Bank Charters as Wall Street’s Doors Reopen
After years of being sidelined, crypto companies are coming back, this time through the front door of the US banking system.
Citing sources familiar with the matter, the Wall Street Journal revealed that several major players, including Circle and BitGo, are preparing to apply for bank charters or financial licenses.
Traditional banks are also responding to the shift. US Bancorp is re-launching its crypto custody program via NYDIG, while Bank of America (BofA) said it would issue its stablecoin once the legal framework is in place.
Even global giants are watching closely. A consortium including Deutsche Bank and Standard Chartered is evaluating how to expand crypto operations into the US.
While details remain scarce, the interest signals that crypto is no longer just a niche but a competitive frontier.
These firms reportedly aim to operate with the same legitimacy and access as traditional lenders. This includes holding deposits, issuing loans, and launching stablecoins under regulatory supervision.
The timing is not random. A sharp pivot in federal policy, driven by President Trump’s pledge to make the US a Bitcoin superpower, has reopened regulatory pathways once shut after the FTX collapse.
In parallel, Congress is advancing stablecoin legislation requiring issuers to secure federal or state licenses.
The push for bank status comes amid a broader effort to legitimize crypto within US finance. Earlier this year, regulators rolled back key restrictions. Among them, the SEC’s controversial SAB 121, which had blocked banks from holding crypto on behalf of clients.
Meanwhile, Federal Reserve (Fed) Chair Jerome Powell affirmed that banks could serve crypto customers provided proper risk management strategies exist.
In another regulatory green light, the Office of the Comptroller of the Currency (OCC) clarified that banks can offer stablecoin and custody services. However, this is provided they comply with established banking rules.
These signals have emboldened crypto firms previously kept at arm’s length. Anchorage Digital, the only US crypto-native firm with a federal bank charter, says the regulatory lift is massive but worth it.
“It hasn’t been easy… the whole gamut of regulatory and compliance obligations that banks have can be intertwined with the crypto industry,” Anchorage CEO Nathan McCauley reportedly admitted.
McCauley cited tens of millions in compliance costs. Nevertheless, Anchorage has since collaborated with BlackRock, Cantor Fitzgerald, and Copper for high-profile custody and lending programs.
BitGo, which will reportedly custody reserves for Trump-linked stablecoin USD1, is nearing a bank charter application.
Circle, the issuer of USDC, is also pursuing licenses while fending off competition, just like Tether. This is a traditional finance (TradFi) venture into stablecoins.
The firm delayed its IPO this month, citing market turmoil and financial uncertainty. However, insiders say regulatory clarity remains a top priority.
Firms like Coinbase and Paxos are exploring similar routes, considering industrial banks or trust charters to expand their financial offerings legally.
At the policy level, venture firm a16z has called on the SEC to modernize crypto custody rules for investment firms, reflecting the industry’s hunger for clarity and parity.
Disclaimer
In adherence to the Trust Project guidelines, BeInCrypto is committed to unbiased, transparent reporting. This news article aims to provide accurate, timely information. However, readers are advised to verify facts independently and consult with a professional before making any decisions based on this content. Please note that our Terms and Conditions, Privacy Policy, and Disclaimers have been updated.
My name is Godspower Owie, and I was born and brought up in Edo State, Nigeria. I grew up with my three siblings who have always been my idols and mentors, helping me to grow and understand the way of life.
My parents are literally the backbone of my story. They’ve always supported me in good and bad times and never for once left my side whenever I feel lost in this world. Honestly, having such amazing parents makes you feel safe and secure, and I won’t trade them for anything else in this world.
I was exposed to the cryptocurrency world 3 years ago and got so interested in knowing so much about it. It all started when a friend of mine invested in a crypto asset, which he yielded massive gains from his investments.
When I confronted him about cryptocurrency he explained his journey so far in the field. It was impressive getting to know about his consistency and dedication in the space despite the risks involved, and these are the major reasons why I got so interested in cryptocurrency.
Trust me, I’ve had my share of experience with the ups and downs in the market but I never for once lost the passion to grow in the field. This is because I believe growth leads to excellence and that’s my goal in the field. And today, I am an employee of Bitcoinnist and NewsBTC news outlets.
My Bosses and co-workers are the best kinds of people I have ever worked with, in and outside the crypto landscape. I intend to give my all working alongside my amazing colleagues for the growth of these companies.
Sometimes I like to picture myself as an explorer, this is because I like visiting new places, I like learning new things (useful things to be precise), I like meeting new people – people who make an impact in my life no matter how little it is.
One of the things I love and enjoy doing the most is football. It will remain my favorite outdoor activity, probably because I’m so good at it. I am also very good at singing, dancing, acting, fashion and others.
I cherish my time, work, family, and loved ones. I mean, those are probably the most important things in anyone’s life. I don’t chase illusions, I chase dreams.
I know there is still a lot about myself that I need to figure out as I strive to become successful in life. I’m certain I will get there because I know I am not a quitter, and I will give my all till the very end to see myself at the top.
I aspire to be a boss someday, having people work under me just as I’ve worked under great people. This is one of my biggest dreams professionally, and one I do not take lightly. Everyone knows the road ahead is not as easy as it looks, but with God Almighty, my family, and shared passion friends, there is no stopping me.

PI Token Price Faces Bearish Pressure, Risking a Drop to $0.40
Top Solana Price Levels to Watch in the Short Term

Circle, BitGo, and Others Eye Bank Charters in US
Will Cardano Price Break Out Soon? Triangle Pattern Hints at 27% ADA Surge

BNB Springs Back From $531 With Unshaken Bullish Conviction

XRP Futures Traders Increase Bets on Upside

2.52 Million Altcoins Are Ruining Crypto’s Future

Animoca Brands Valuation Tanks 75% In Two Years, Here’s Why

Crypto exchange BingX hacked for $43 million

Are The Big Players Losing Interest?

Hong Kong’s Securities Association Tips Authorities On Crypto Self-Regulation

Coinbase cbBTC Set to go Live on Solana
2.52 Million Altcoins Are Ruining Crypto’s Future
Animoca Brands Valuation Tanks 75% In Two Years, Here’s Why
Crypto exchange BingX hacked for $43 million
Are The Big Players Losing Interest?
Hong Kong’s Securities Association Tips Authorities On Crypto Self-Regulation
Coinbase cbBTC Set to go Live on Solana
-

 Market23 hours ago
Tokens Big Players Are Buying
-

 Market22 hours ago
Dogecoin Defies Bullish Bets During Dogeday Celebration
-
 Altcoin22 hours ago
Expert Predicts Pi Network To Reach $5 As Whales Move 41M Pi Coins Off Exchanges
-

 Market20 hours ago
Will XRP Break Support and Drop Below $2?
-
 Bitcoin11 hours ago
US Economic Indicators to Watch & Potential Impact on Bitcoin
-

 Bitcoin20 hours ago
Bitcoin LTH Selling Pressure Hits Yearly Low — Bull Market Ready For Take Off?
-

 Bitcoin17 hours ago
Here Are The Bitcoin Levels To Watch For The Short Term
-

 Market13 hours ago
Bitcoin Price Breakout In Progress—Momentum Builds Above Resistance