
Market
Donald Trump Victory Could See Dan Gallagher as Next SEC Chair
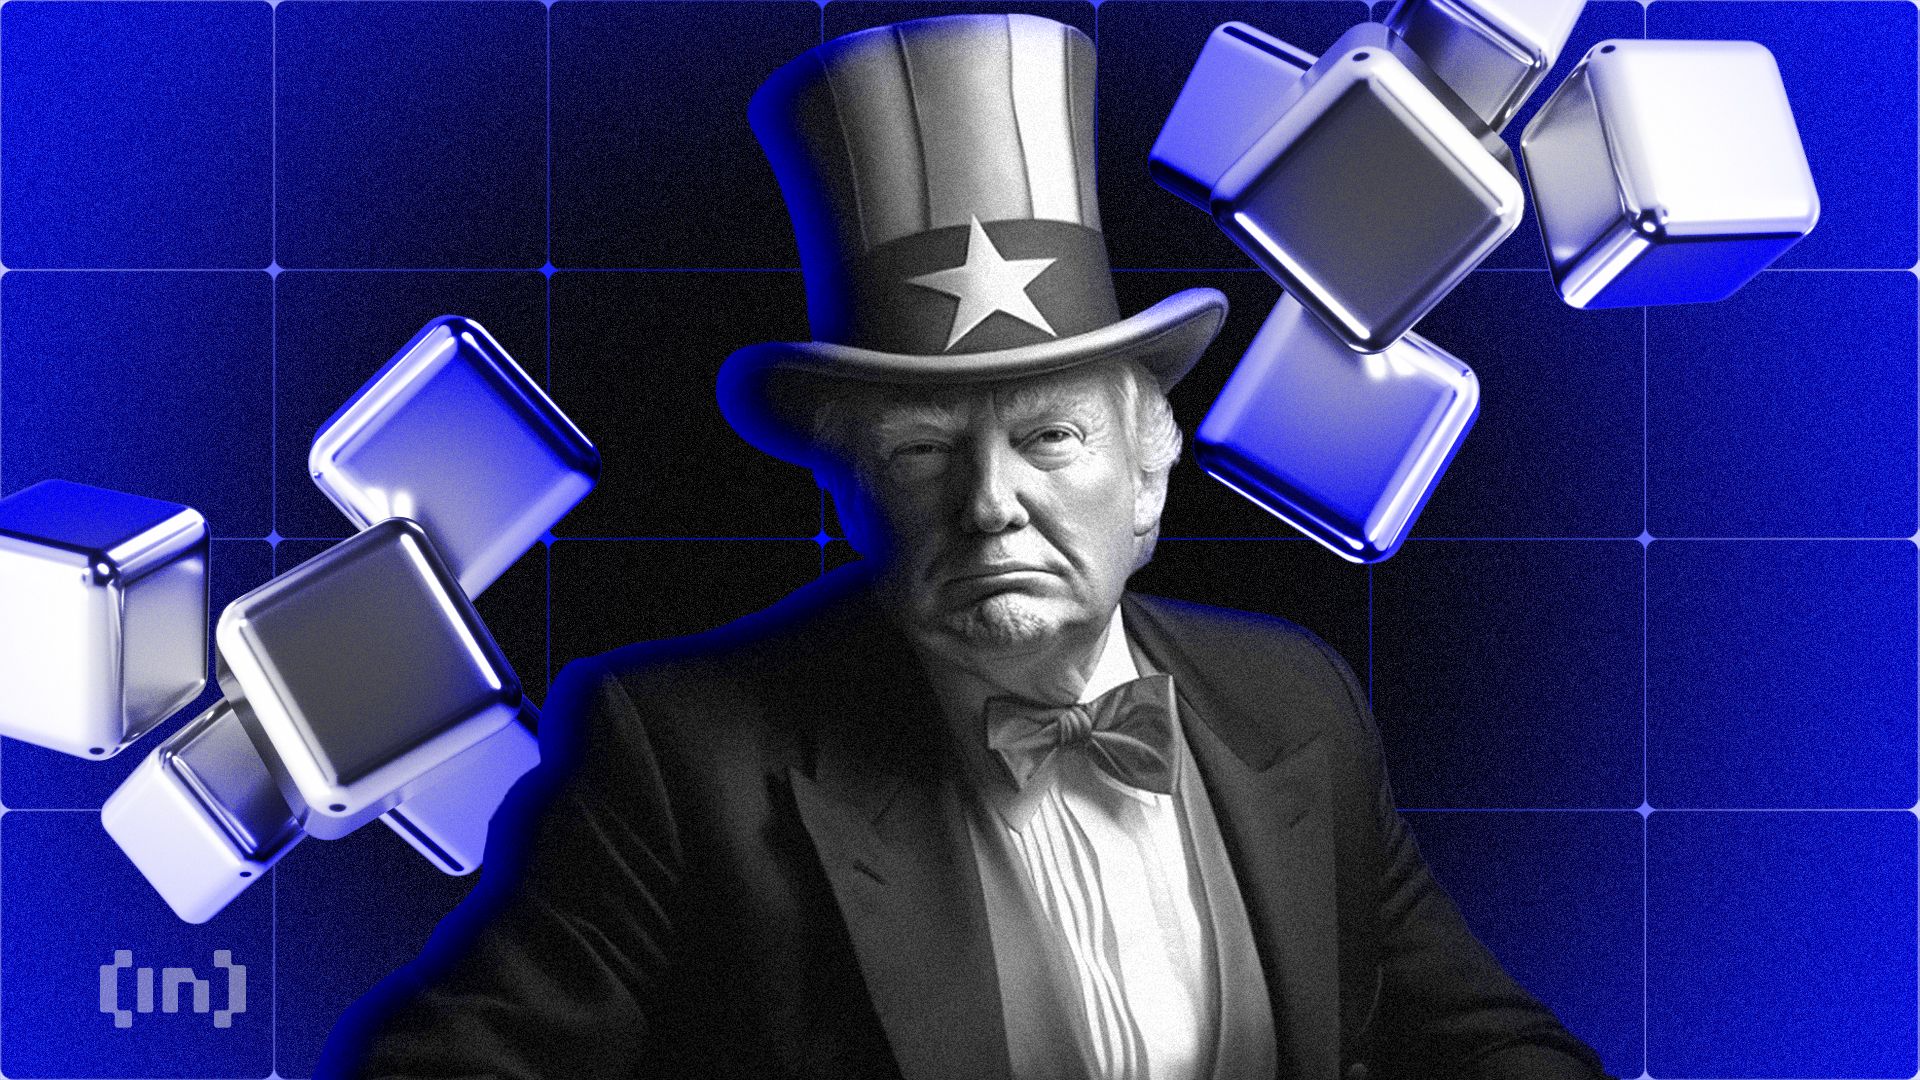
In the event of a Trump victory, Dan Gallagher is likely to replace Gary Gensler as the US Securities and Exchange Commission (SEC) Chair.
Gallagher may have a tough road to potential confirmation, but crypto’s relationship with regulators is only looking rosier.
Trump’s Pledge to Replace Gensler
According to rumors from Politico, Robinhood’s Chief Legal Officer Dan Gallagher is likely to head the Securities and Exchange Commission (SEC) in the event Donald Trump wins the upcoming US election. Politico claimed this scoop came from a “dozen former top regulators, lobbyists, and securities lawyers,” all speaking anonymously.
The US Presidential Election will take place on November 5, and crypto will likely be an important issue. At the Bitcoin Conference in Nashville this July, Trump promised to remove Gary Gensler as SEC chair. This promise won raucous cheering from the crowd, seemingly taking him aback.
“I didn’t know he was that unpopular! I didn’t know he was THAT unpopular. Let me say it again: on day one, I will fire Gary Gensler,” Trump claimed, reacting to the crowd’s outsized approval.
Read More: Who Is Gary Gensler? Everything To Know About the SEC Chairman
A popular promise like this could electrify potential voters, and that’s a good reason for Trump to carry it out. Setting aside the legal question of whether or not Trump can unilaterally fire Gensler, there’s another obvious question. Who can replace him?
Gallagher’s Qualifications
Dan Gallagher, Chief Legal Officer at Robinhood, has already been identified as a strong contender. Before taking a job at Robinhood, Gallagher previously served as one of the SEC’s five commissioners, and a former SEC official called him “a natural choice.” Politically, he would align with a potential Trump administration.
Robinhood has also intensified its crypto strategy in the past year, making Gallagher an even stronger contender as a pro-crypto standard bearer. However, this may be politically awkward, as Robinhood has faced SEC lawsuits this year. Gallagher has already spoken out on this battle:
“It’s a dog of a case. We’ve been forgoing revenue for the company by not going hog wild listing coins, and I think that puts us in a very, very unique position. Shooting at the good guys is a really bad policy,” claimed Gallagher.
Read More: How to Buy and Sell Crypto on Robinhood: A Step-by-Step Guide
As a result, Gallagher could face contentious confirmation hearings if he gets close to Gensler’s position. Ultimately, though, this won’t be his biggest obstacle. Before any of these things happen, Trump has to win a very contentious election.

In a moment where Trump’s Republican Party is casting itself as the pro-crypto option, Gallagher seems a real favorite. As the election approaches, however, both parties are tacking towards a crypto-friendly position. Regardless of the outcome in November, there’s a clear takeaway: the pressure is building everywhere for a new and positive direction in crypto policy.
Disclaimer
In adherence to the Trust Project guidelines, BeInCrypto is committed to unbiased, transparent reporting. This news article aims to provide accurate, timely information. However, readers are advised to verify facts independently and consult with a professional before making any decisions based on this content. Please note that our Terms and Conditions, Privacy Policy, and Disclaimers have been updated.


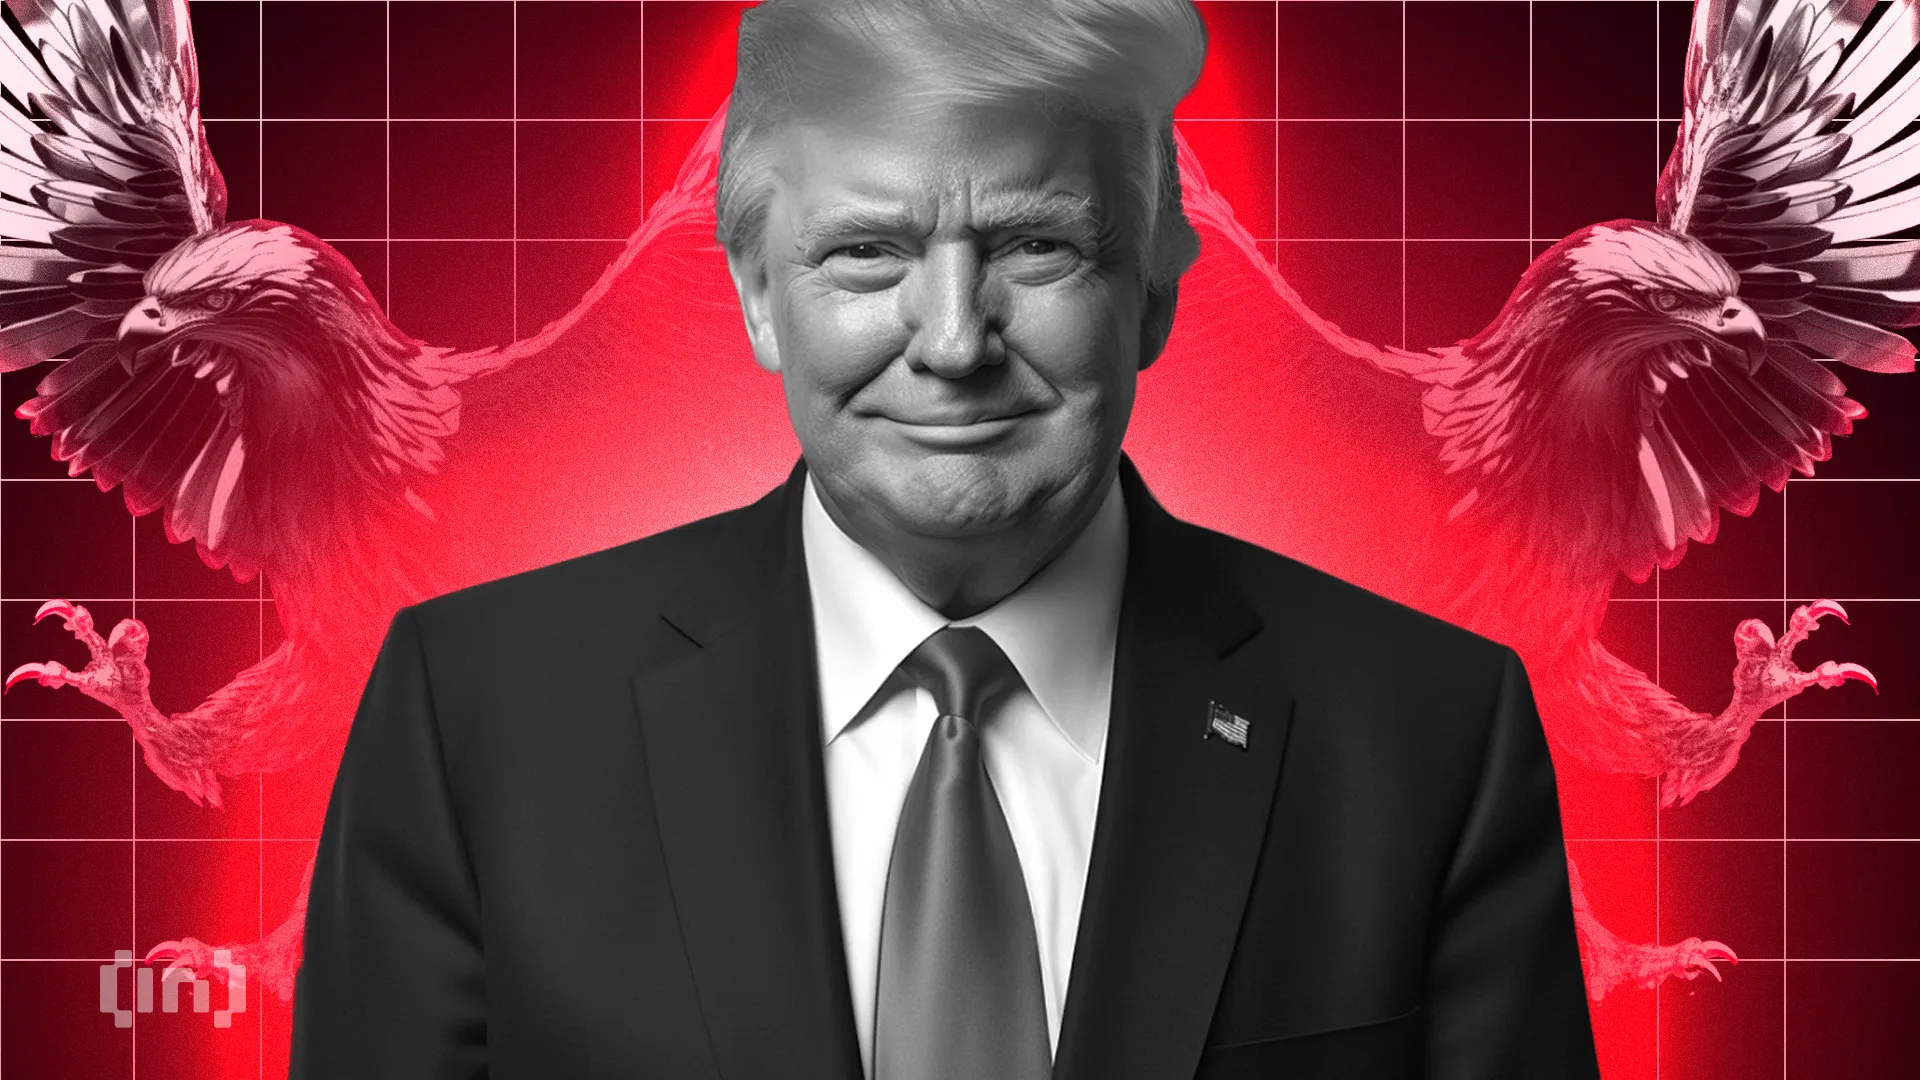


With support from Trump’s White House and easing regulations, firms like Circle and BitGo are pursuing becoming full-fledged financial institutions.
Reports indicate a new wave of crypto companies knocking on the once-closed doors of the American banking system. This time, someone is listening.
Crypto Firms Seek Bank Charters as Wall Street’s Doors Reopen
After years of being sidelined, crypto companies are coming back, this time through the front door of the US banking system.
Citing sources familiar with the matter, the Wall Street Journal revealed that several major players, including Circle and BitGo, are preparing to apply for bank charters or financial licenses.
Traditional banks are also responding to the shift. US Bancorp is re-launching its crypto custody program via NYDIG, while Bank of America (BofA) said it would issue its stablecoin once the legal framework is in place.
Even global giants are watching closely. A consortium including Deutsche Bank and Standard Chartered is evaluating how to expand crypto operations into the US.
While details remain scarce, the interest signals that crypto is no longer just a niche but a competitive frontier.
These firms reportedly aim to operate with the same legitimacy and access as traditional lenders. This includes holding deposits, issuing loans, and launching stablecoins under regulatory supervision.
The timing is not random. A sharp pivot in federal policy, driven by President Trump’s pledge to make the US a Bitcoin superpower, has reopened regulatory pathways once shut after the FTX collapse.
In parallel, Congress is advancing stablecoin legislation requiring issuers to secure federal or state licenses.
The push for bank status comes amid a broader effort to legitimize crypto within US finance. Earlier this year, regulators rolled back key restrictions. Among them, the SEC’s controversial SAB 121, which had blocked banks from holding crypto on behalf of clients.
Meanwhile, Federal Reserve (Fed) Chair Jerome Powell affirmed that banks could serve crypto customers provided proper risk management strategies exist.
In another regulatory green light, the Office of the Comptroller of the Currency (OCC) clarified that banks can offer stablecoin and custody services. However, this is provided they comply with established banking rules.
These signals have emboldened crypto firms previously kept at arm’s length. Anchorage Digital, the only US crypto-native firm with a federal bank charter, says the regulatory lift is massive but worth it.
“It hasn’t been easy… the whole gamut of regulatory and compliance obligations that banks have can be intertwined with the crypto industry,” Anchorage CEO Nathan McCauley reportedly admitted.
McCauley cited tens of millions in compliance costs. Nevertheless, Anchorage has since collaborated with BlackRock, Cantor Fitzgerald, and Copper for high-profile custody and lending programs.
BitGo, which will reportedly custody reserves for Trump-linked stablecoin USD1, is nearing a bank charter application.
Circle, the issuer of USDC, is also pursuing licenses while fending off competition, just like Tether. This is a traditional finance (TradFi) venture into stablecoins.
The firm delayed its IPO this month, citing market turmoil and financial uncertainty. However, insiders say regulatory clarity remains a top priority.
Firms like Coinbase and Paxos are exploring similar routes, considering industrial banks or trust charters to expand their financial offerings legally.
At the policy level, venture firm a16z has called on the SEC to modernize crypto custody rules for investment firms, reflecting the industry’s hunger for clarity and parity.
Disclaimer
In adherence to the Trust Project guidelines, BeInCrypto is committed to unbiased, transparent reporting. This news article aims to provide accurate, timely information. However, readers are advised to verify facts independently and consult with a professional before making any decisions based on this content. Please note that our Terms and Conditions, Privacy Policy, and Disclaimers have been updated.
My name is Godspower Owie, and I was born and brought up in Edo State, Nigeria. I grew up with my three siblings who have always been my idols and mentors, helping me to grow and understand the way of life.
My parents are literally the backbone of my story. They’ve always supported me in good and bad times and never for once left my side whenever I feel lost in this world. Honestly, having such amazing parents makes you feel safe and secure, and I won’t trade them for anything else in this world.
I was exposed to the cryptocurrency world 3 years ago and got so interested in knowing so much about it. It all started when a friend of mine invested in a crypto asset, which he yielded massive gains from his investments.
When I confronted him about cryptocurrency he explained his journey so far in the field. It was impressive getting to know about his consistency and dedication in the space despite the risks involved, and these are the major reasons why I got so interested in cryptocurrency.
Trust me, I’ve had my share of experience with the ups and downs in the market but I never for once lost the passion to grow in the field. This is because I believe growth leads to excellence and that’s my goal in the field. And today, I am an employee of Bitcoinnist and NewsBTC news outlets.
My Bosses and co-workers are the best kinds of people I have ever worked with, in and outside the crypto landscape. I intend to give my all working alongside my amazing colleagues for the growth of these companies.
Sometimes I like to picture myself as an explorer, this is because I like visiting new places, I like learning new things (useful things to be precise), I like meeting new people – people who make an impact in my life no matter how little it is.
One of the things I love and enjoy doing the most is football. It will remain my favorite outdoor activity, probably because I’m so good at it. I am also very good at singing, dancing, acting, fashion and others.
I cherish my time, work, family, and loved ones. I mean, those are probably the most important things in anyone’s life. I don’t chase illusions, I chase dreams.
I know there is still a lot about myself that I need to figure out as I strive to become successful in life. I’m certain I will get there because I know I am not a quitter, and I will give my all till the very end to see myself at the top.
I aspire to be a boss someday, having people work under me just as I’ve worked under great people. This is one of my biggest dreams professionally, and one I do not take lightly. Everyone knows the road ahead is not as easy as it looks, but with God Almighty, my family, and shared passion friends, there is no stopping me.
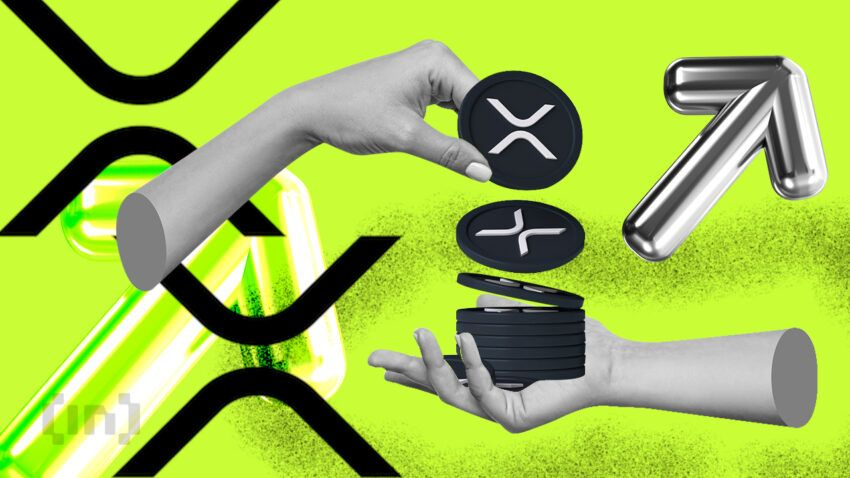
Over the past week, XRP’s price has remained range-bound amid the broader market’s recovery attempt.
However, with a growing bullish bias toward the altcoin, XRP may be on the brink of breaking free from this range and trending upward. This analysis explains why.
XRP Futures Traders Bet on Upside as Long Positions
The momentum shift towards the bulls has become evident, particularly within the futures market, where long bets on XRP are now surpassing short positions. This is reflected by the token’s XRP’s long/short ratio, which is currently at 1.07.

The long/short ratio measures the proportion of long positions (bets on price increases) to short positions (bets on price declines) in the market.
When its value is below one, it indicates that the number of short positions outweighs long positions in the market, suggesting bearish sentiment or a lack of confidence in the token’s future price performance.
As with XRP, when an asset’s long/short ratio is above one, it means there are more long positions than short ones. It indicates that traders are predominantly bullish on XRP and hints at a higher likelihood of an upward breach of its narrow range.
In addition, XRP’s relative strength index (RSI) has climbed steadily, indicating a gradual rise in demand for the token. The key momentum indicator, at 50.77, currently rests above the neutral line and is in an uptrend.
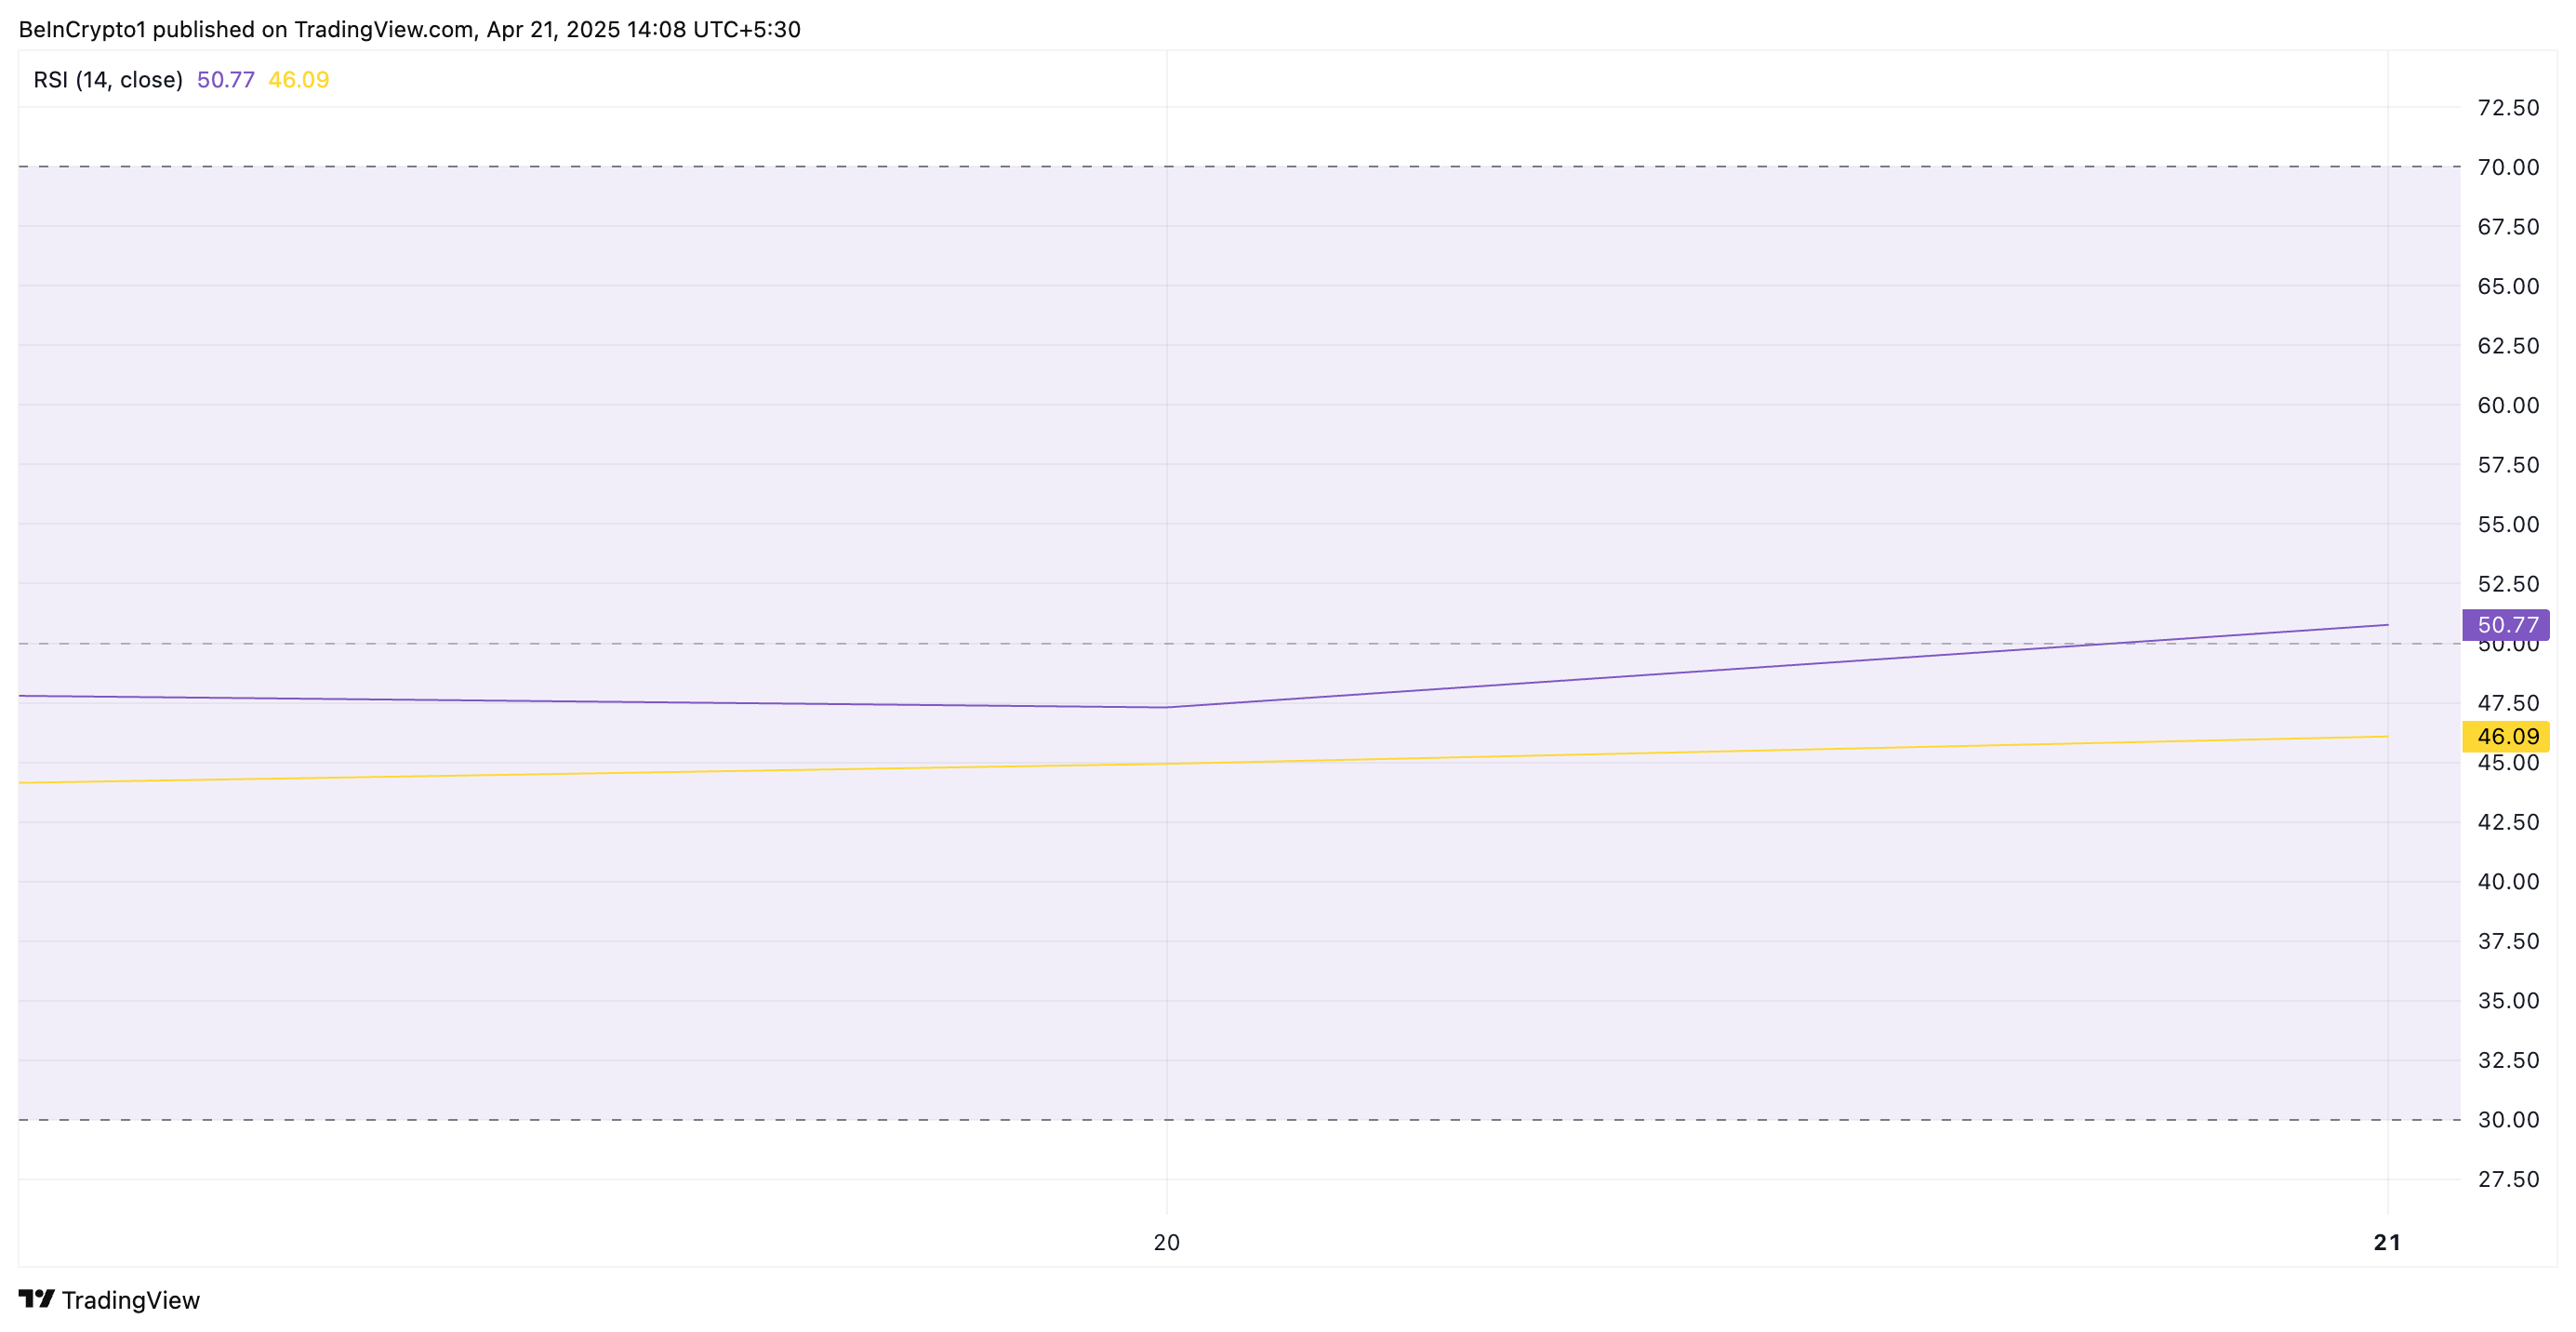
The RSI indicator measures an asset’s overbought and oversold market conditions. It ranges between 0 and 100. Values above 70 suggest that the asset is overbought and due for a price decline, while values under 30 indicate that the asset is oversold and may witness a rebound.
At 50.77, XRP’s RSI signals a shift toward bullish momentum. It indicates that buying pressure is starting to outweigh selling pressure, and the asset may be poised for further price increases.
XRP Eyes $2.18 Resistance as Bulls Look to Push for $2.29
XRP currently trades at $2.13, just 3% away from its next significant resistance level, $2.18. If buying pressure intensifies and the altcoin successfully flips this price point into a support floor, it could trigger further price growth. In this scenario, XRP could potentially climb to $2.29.
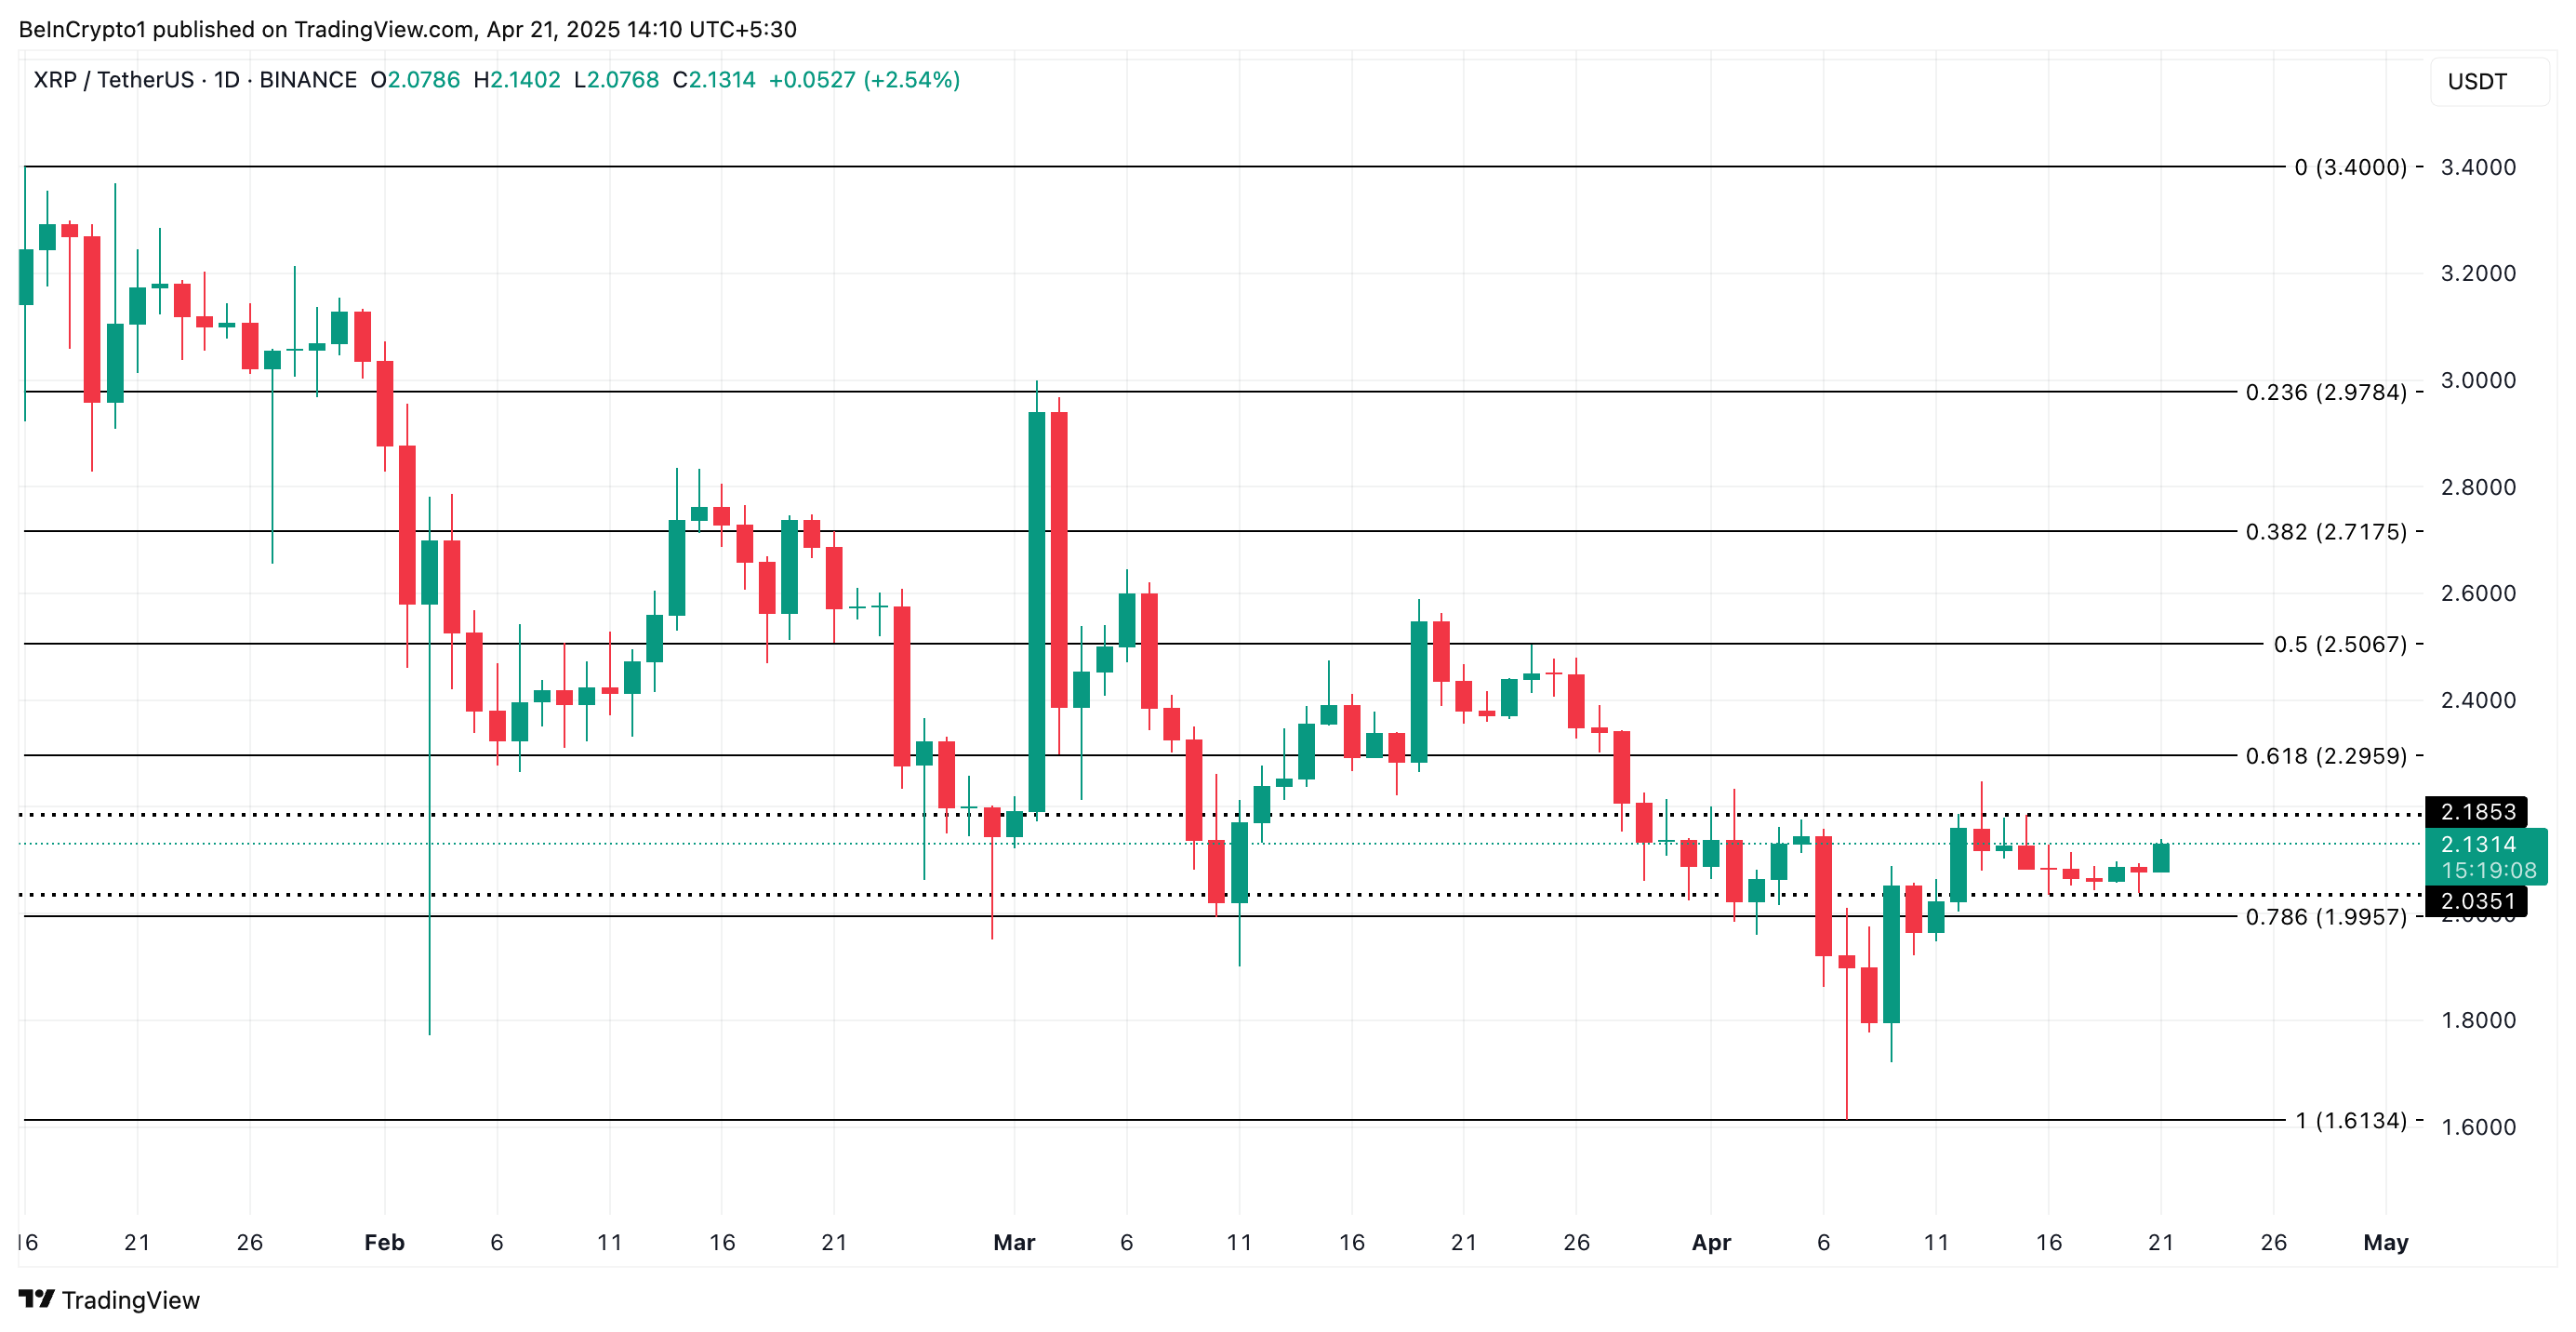
However, if demand weakens and the bears regain control, XRP may remain range-bound. It could even break below the $2.03 support and fall to $1.99.
Disclaimer
In line with the Trust Project guidelines, this price analysis article is for informational purposes only and should not be considered financial or investment advice. BeInCrypto is committed to accurate, unbiased reporting, but market conditions are subject to change without notice. Always conduct your own research and consult with a professional before making any financial decisions. Please note that our Terms and Conditions, Privacy Policy, and Disclaimers have been updated.
Top Solana Price Levels to Watch in the Short Term

Circle, BitGo, and Others Eye Bank Charters in US
Will Cardano Price Break Out Soon? Triangle Pattern Hints at 27% ADA Surge

BNB Springs Back From $531 With Unshaken Bullish Conviction

XRP Futures Traders Increase Bets on Upside

Optimism, Aztec, and Huma Finance

2.52 Million Altcoins Are Ruining Crypto’s Future

Animoca Brands Valuation Tanks 75% In Two Years, Here’s Why

Crypto exchange BingX hacked for $43 million

Are The Big Players Losing Interest?

Hong Kong’s Securities Association Tips Authorities On Crypto Self-Regulation

Coinbase cbBTC Set to go Live on Solana
2.52 Million Altcoins Are Ruining Crypto’s Future
Animoca Brands Valuation Tanks 75% In Two Years, Here’s Why
Crypto exchange BingX hacked for $43 million
Are The Big Players Losing Interest?
Hong Kong’s Securities Association Tips Authorities On Crypto Self-Regulation
Coinbase cbBTC Set to go Live on Solana
-
 Market22 hours ago
1 Year After Bitcoin Halving: What’s Different This Time?
-

 Market21 hours ago
Tokens Big Players Are Buying
-

 Market23 hours ago
VOXEL Climbs 200% After Suspected Bitget Bot Glitch
-

 Market20 hours ago
Dogecoin Defies Bullish Bets During Dogeday Celebration
-

 Market18 hours ago
Will XRP Break Support and Drop Below $2?
-

 Market11 hours ago
Bitcoin Price Breakout In Progress—Momentum Builds Above Resistance
-
 Bitcoin9 hours ago
US Economic Indicators to Watch & Potential Impact on Bitcoin
-

 Market8 hours ago
Vitalik Buterin Proposes to Replace EVM with RISC-V